It’s been 3 years and 2 days since Garmin announced the Forerunner 945, and today, it’s finally properly refreshed with the Forerunner 955. Except, it’s actually two watches – the Forerunner 955 & the Forerunner 955 Solar. Today’s announcement marks the first time we’ve seen solar in the Forerunner family. And similarly, it also marks the first time we’ve seen the more accurate multi-band/dual-frequency capability in a Forerunner watch (previously on the Fenix 7/Epix series). And finally, the first time we’ve seen native running power in a Garmin watch.
However, despite all those hardware innovations, I’d actually argue the most interesting new features here aren’t hardware at all – it’s the software changes. The Forerunner 955 picked up all the Fenix 7 software additions, but then added a massively revamped, and expanded, slate of training load and recovery tools, including detailed HRV status tracking and something called Training Readiness. This Training Readiness feature finally takes the hodgepodge of countless different Garmin body-related metrics, and puts them into one clear recommendation, with details on why it gives the guidance it does.
Oh, and the Forerunner 955 wasn’t the only watch announced today. They also announced the new Forerunner 255, which steps up to become a full multisport watch with much of the same new functionality seen on the Forerunner 955. I’ve got my full in-depth review here on that here.
As usual, this watch is a media loaner, and it’ll go back to Garmin shortly. This review is not sponsored (nor does any company get to preview anything I review), and I don’t take any advertiser money from any companies I review. And as regular readers know, if something is crap, I’m gonna tell it brutally like it is – no matter the brand (as Garmin saw just two weeks ago). Once this unit goes back, I’ll go out and get my own for any future testing needs. If you found this review useful, you can use the links at the bottom, or consider becoming a DCR Supporter which makes the site ad-free, while also getting access to a mostly weekly video series behind the scenes of the DCR Cave. And of course, it makes you awesome.
What’s New:
The Forerunner 955 packs in a massive slate of new features, compared to the previous Forerunner 945 (or FR945 LTE). However, there is a large chunk of them that was previously introduced on the Fenix 7 & Epix series some five months ago. Still, there are also legit new-to-Garmin features, virtually all of which are also coming to the Fenix 7 & Epix series. More on that a little later in this section.
So here’s the massive list I’ve compiled of what’s new compared to the Forerunner 945 or Forerunner 945 LTE (there are a handful of items noted below that the Forerunner 945 LTE already has). Of course, the reality is there are even more new items than this that are just too tiny to find/list here:
– Two variants now: Non-Solar ($499) & Solar ($599) – the only difference here is the solar bits
– Added Touchscreen
– Added Solar Power
– Added Multi-band GPS support (dual-frequency support)
– Added sorta-native running power (native fields/recording, but requires RD pod/HRM-PRO/HRM-TRI/HRM-RUN)
– Added Running-power specific training zones
– Added Training Readiness, a short-term daily readiness metric
– Added HRV status tracking (at night)
– Added Morning Report (summarizes HRV, Sleep, workout plans, etc…)
– Added New Race Calendar & Race Details/Countdown Widgets
– Added New Race prediction widget
– Added Acute Load metric
– Added the ability to redirect Emergency Assistance to a single person
– Added data carousel within certain watch faces
– Added Daily Health Snapshot
– Added ‘Up Ahead’ feature for distances to predefined markers like aide stations, climbs, etc…
– Added real-time Stamina feature, which is used during runs & rides to try and leave nothing in the tank (or, properly manage a workout)
– Added Race Predictor historical trendlines (to see if you’re getting faster or slower)
– Added Automatic Run/Walk/Stand graphing within a workout (see sports section for details)
– Added Spectator Messaging (seen on FR945 LTE, requires phone though on FR955)
– Added new graphical charts as data fields
– Added the ability to configure watch activity profiles and data fields from your phone
– Added Garmin Connect IQ store on wrist (well, a limited version of it anyway)
– Added new “Map Manager” feature for managing/downloading maps from your wrist via WiFi
– Added Garmin SkiView, now includes resort names & slope names
– Added Cross Country Ski Trails to maps
– Added Touchscreen Swipe from left to create a lap
– Added Power Manager (though, not as full-featured as Fenix 7)
– Massively overhauled how Training status/load works (more details lower down)
– Changed Training Load Focus to be aware of your entire race calendar
– Daily suggested workouts can now be seen into the future, configuration of long-workout days, more settings, etc…
– Daily suggested workouts can now be tied to future calendar race events, automatically creating workouts for that distance/course
– Changed to Garmin Elevate V4 Optical HR sensor
– Forerunner 955 display is 260x260px ,and 33mm across (the FR255 is identical, the FR255S is smaller at 218×218 and 27.5mm)
There is not an LTE version of the Forerunner 955, and I don’t expect to see one this go around.
So what’s new here that’s not on something like the recently Fenix 7 or Epix? Glad you asked, here’s the main hit-list:
A) HRV Status
B) Daily Training Readiness
C) Acute Training Load
D) Morning Report
E) Native Running Power
F) Race Calendar & Race Event Widgets
G) Daily Suggested Workouts now accounting for races on the calendar
There are lots of tiny things that tie into those (sub-features of those items) or menu/user interface tweaks (for example on a Fenix 7 you can long-press any data field on the watch face, and it’ll take you to the widget details for that data, but not on the FR955), but that’s the gist of it. In any case, as for the pile of features listed above that are new to the FR955 compared to the Fenix 7/Epix series, Garmin says to expect those very shortly, starting with beta rollouts in the recently announced beta program. The Forerunner 945 LTE will also gain all of those features, and also, look to the beta program very shortly for that (the fact that it’s getting everything is massive).
For the Instinct 2 series watches, they also gain a subset of these features to make them sorta-parity to the Forerunner 255. Specifically, they’ll gain items A/C/E above (those are the features seen on the FR255). And again, Garmin says to look to the beta program very shortly for the Instinct 2 beta updates covering these features.
Got all that? Let’s cruise.
The Basics:
In this section, I’m going to cover all of the basics of using the watch. Things like the overall usability and the new touchscreen, but more importantly all of the core daily fitness features like activity tracking, sleep, health tracking, and so on. Widgets, phone integration, etc… Of course, I also do this within my massive beginner’s guide video seen above, which starts off in that area and then gets deeper and deeper as you go along.
No matter which version of the Forerunner 955 you have (Solar or non-Solar), everything remains the same in this section. The only difference between those two units is literally the solar panel. That’s it. So all those differences are discussed in the ‘Solar’ section next.
Starting with the outer hardware, the Forerunner 955 has five buttons like most Garmin fitness watches. Three on the left side and two on the right. In general, the upper right button is your confirmation button, and the lower right is your back/escape button. The left buttons are for navigating in the menu. And you can long-hold any of the buttons to either access different menu items, or assign quick-access buttons.
The new Forerunner 955 touchscreen acts in much the same way as the Fenix 7/Epix touchscreen in that it allows you to navigate/swipe through items, or tap them like pretty much any other touchscreen device. I haven’t had any problems in rain or while sweating. Though as usual, you’ll see a bit less precision with a touchscreen than with buttons. However, there’s *ZERO* dependency on the touchscreen. in fact, the vast majority of the time I don’t use it. I just use the buttons. Garmin’s approach here is to let you choose which way you want to use the watch. If you want all touchy-feely, then go forth, you can do that. If you want all buttons, you can do that too. Or blend the two as I do.
By default, virtually all sports profiles have touch disabled, and then you enable it on a per-profile basis. You can also enable/disable it across the board, or just within all sports across the board. There’s a minor nuance in differences in that on the Fenix 7 series you can also disable it within just sleep too, but that doesn’t appear to be an option here at this time. To be clear, there’s still nightly do-not-disturb mode and such, just not the more advanced sleep-related display settings as found on the Fenix 7/Epix.
In any case, let’s slide back to the watch face. As with virtually all Garmin watches, this is customizable. You can choose from a pile of built-in watch faces and then customize virtually every data element on it, or you can download thousands from the Connect IQ store. Heck, you can even make your own with your face on it or something.
Here’s the Connect IQ app store, where you can download watch faces or create your own using photos. The Forerunner 955 has a 64-color display, which is identical to that of the Fenix 7 series. It is not an AMOLED display like the Garmin Venu or Epix series watches, so it won’t quite be as vibrant colors.
Next, after swiping down from the watch face you’ve got the widgets. Or more specifically, the widget glances. You’ll see roughly three widgets per screen chunk as you scroll through them. These are customizable (and you can download others too from the Connect IQ app store). In general, these are glanceable bits of information about things like sleep, training status, weather, activity, and so on.
You can then tap on any of these to crack open more details about that particular item. For example, if you open the steps widget, you’ll then see more detailed information and additional data pages. The first shows step accumulation throughout the day, and then after that you can look at historical data.
Every bit of data you see in widgets is also synced into Garmin Connect (both the web platform and mobile app), where you can go waaaaay deeper on whatever stats you want. You can be as granular as seeing it down to the minute/hour, or as broad as yearly trends. Here’s a quick look at how that appears for steps for me over the last long-while:
This is true for every metric from steps to sleep to heart rate tracking, breathing rate, and so on. There’s a dizzying list of things Garmin tracks, of which the majority you might never even open. In some ways, that’s long been Garmin’s secret sauce. They know that nobody uses everything, but everyone has some specific thing they want.
For fun, here’s a giant gallery of widgets and details from different ones:
Many of these metrics are derived from data captured by the optical heart rate sensor located on the bottom of the Forerunner 955. This optical HR sensor is powered on 24×7, constantly logging data well beyond just your heart rate. This includes things like calculating breathing rate, HRV, or even blood oxygenation levels (if enabled). The Forerunner 955 uses the Garmin’s Elevate V4 sensor (same as on the Fenix 7/Epix/FR945 LTE/Venu 2 series). The green light is for regular heart rate recordings, while the red light is for blood oxygenation levels (Garmin calls this Pulse Ox):
Beyond obvious metrics like heart rate or breathing rate, there’s a slew of algorithmic metrics. These are things that are unique to Garmin (or, at least Firstbeat, the company which Garmin acquired that develops algorithms but still licenses them to other companies). For example, one is Body Battery. Body Battery is basically your energy level. You recharge it every night, and then decrease it during the day, or during periods of relaxation (like sitting on the couch watching TV). However, with the Forerunner 955 there’s also Training Readiness, which is aimed at figuring out if you should train (or, to what intensity).
Think of it like this: Use Body Battery on vacation to see the impacts of your day when you don’t care about training. Whereas, use Training Readiness when you are trying to get workouts in. Again, tons more later on this in the ‘Training Readiness’ section.
I’ve found Body Battery pretty solid at matching how I feel. Do note that it’ll take a few weeks to nail your exact body, but once it does, it’s pretty good at it. Of course, just because you go to sleep doesn’t mean you refill the tank every day. As you can see above, some nights I get good sleep, and other nights less so. Like trying to charge an electric car, if you unplug it too soon, the tank isn’t full.
The areas where Body Battery tends to struggle is exceptionally long/hard days, like traveling overnight on a redeye without sleep – or simply working through the night. In those cases, usually Body Battery gets down to the single-digit numbers and just kinda creeps to a stop. It knows you are screwed, you know you are screwed, and everyone just looks at each other and says ‘It is what it is’.
Speaking of sleep, the FR955 will automatically track your sleep each night, recording that data both onto the watch, as well as to your account for more details. However, new to the Forerunner 255/955 is the ‘Morning Report’. This screen is shown when you wake up each morning and gives you a bit of a summary of where your body is at (sleep & recovery-wise and training-wise), as well as upcoming bits like the weather. Here’s some of the screens it shows:
You can customize what data you want in the morning report. By default the morning report will stay on the screen until you dismiss it, just like Apple’s similar concept. I’ve found it pretty handy, especially on the FR955 and seeing the Training Readiness score. Keep in mind though that score will likely increase over the course of the day/morning, as it’s heavily tied to your recovery time (from the last workout).
This is also where you’ll see your HRV status information too. HRV is measured on the FR255/FR955 constantly through the night. Garmin takes constant readings, and then displays them in 5-minute increments within the HRV timeline graph shown. That chart also shows your max values for the night. It’s 100% normal that there’s this much fluctuation in it, as your values are often tied to different sleep phases.
I dig into the HRV Status bits a bit later on in the Training Readiness section.
And, if you wanted to see the details about the sleep itself, that’s visible within the morning report, as well as afterwards in the sleep widgets:
It also gives specific peanut-gallery thoughts about your sleep too:
In terms of sleep accuracy, if I compare the stated times it says I fell asleep and woke up, as well as the times it says I was awake, these have all matched on most nights (or the differences are relatively minimal). However, I’m not evaluating sleep phases. If I look at the viable home options to compare sleep stages/phases in terms of accuracy, those devices aren’t that accurate by themselves (only about 80% accurate). We’d never accept comparing other features like optical HR accuracy to an “80% accurate chest strap”, so I won’t accept doing so here. However, I also don’t put much stock in the sleep phase/stage details anyways, so, I’m not too worried about it. I’ve found in general, if you’re getting enough hours of sleep, and that’s uninterrupted sleep, then that’s the main thing to focus on. And the watch can/does at least tell you that correctly.
Next, we’ll briefly touch on blood oxygenation levels, which Garmin calls PulseOx. You can configure this to be off, during sleep only, or 24×7. It has two basic purposes in a Garmin wearable, one is around sleep (as potentially an indicator of sleep-related issues), and two in high altitude environments as an indicator that something is about to go horribly wrong. Two totally different use cases (note: medical folks and such also monitor blood oxygen levels too for other reasons). For the first one – sleep – you can track your Pulse Ox readings each night. It’s the red LED that’ll light up on the back of the watch.
This will consume additional battery, lowering your overall battery a fair bit. Though, not as much as the 24×7 mode, which consumes a crapton of battery. I don’t use either due to battery draw, but only utilize it in spot-checks with respect to Health Snapshot (more on that in a second). However, in terms of accuracy, I find that if you treat it the same way you’d do an actual blood oxygen test with an approved/medical-grade device, you’ll get good results. Which is to say, sit still. And that’s the exact same way the FDA certifies blood oxygen medical-grade devices: Sitting still. If you swing your arms around, you’ll either not get good results, or Garmin these days won’t even give a reading. They (and others) have gotten smarter with just giving you a warning that there’s too much movement for a valid result.
Now as I mentioned, there’s the new Health Snapshot feature. This was introduced on the Venu 2 last year and carried through to virtually all other watches since. It takes five core metrics and distills them down into a single 2-minute measurement period. All you need to do is sit down and relax.
During the 2-minute period it’ll measure your heart rate, blood oxygen level, respiration rate, stress, and HRV (heart rate variability). The idea being you can consistently do this, ideally at the same time each day, and start to get a bit of a snapshot of how things are trending. All of these metrics are already tracked by Garmin more deeply in the app/platform, but this aims to put it on a single plate (so to speak). You can then export it into a single PDF if you’d like as well. As I noted a year ago, there still isn’t any way to track these points over time though. So if you were very specific about doing these measurements the same way every day/week/month, you can’t easily just compare all of these in a graph. Maybe if I keep asking for it, it’ll happen.
Next, we’ll quickly touch on a few non-health things. First up is smartphone notifications. These will come in automatically depending on how your smartphone is configured in terms of what apps notify you. You’ll change all this within your smartphone settings itself, Garmin just displays them as per those settings. These notifications do support some emojis, though not quite everything.
You can’t reply to any of these messages, at least not on iOS, because of limitations imposed by Apple and letting text message apps reply. But, you can dismiss them, which dismisses them on your phone as well.
Next, there’s also the newish Connect IQ App Store. The idea behind this was that you could see recommended apps and easily install them from the watch. This was announced last fall, and then rolled out in the Fenix 7/Epix series. You’ll find the Connect IQ app store listed in the sport profiles. It’s a weird place to put it, but from a technology standpoint it’s how it fits within the Garmin app concept.
Either way, this is properly useless at this point. It offered me a whopping two apps – Deezer and AccuWeather. You can’t browse apps or such, it just gives you a handful (under 5) of apps to consider installing. I’d hoped to see this be vibrant and dynamic full of apps, but again, 5 months later and there’s nothing vibrant, dynamic, exciting, or even intriguing about opening this up to see what it recommends. Because, it never recommends anything.
I get that this concept is still basic and such, but c’mon, at least try here. Heck, just do a random number generator and pick 5 totally random apps from the app store. At least there I have a chance of getting the Pizza Tracker or Beer Pong apps, which would be exciting.
Finally, while it probably won’t matter to many people, do note that in general, virtually all of the functions that involve a smartphone require internet to function. Meaning that while the watch will happily collect data without internet, and do so for a very long time (days/weeks/etc…), it won’t sync to the phone without internet. That’s because the Garmin Connect smartphone app itself is merely showing data from the Garmin Connect online platform.
The exception to this would be if you use the Garmin Explore app (also free), which then does allow syncing of data (namely tracks/routes) back and forth to a phone that doesn’t have internet. And again, this has no impact on viewing any of these stats on your watch itself, but only if you were spending extended periods of time without internet, analyzing your stats on the smartphone Garmin Connect app would not be possible. You can however still plug in your watch to a computer, and download the workout file and analyze that.
Solar Features:
This entire section is only applicable to the Solar edition of the Forerunner 955, as that specific edition has a solar panel in it. Well, technically two solar panels. Solar technology is not new to Garmin wearables. It was first introduced on the Fenix 6 series, and then has since been used on the Fenix 7, Enduro, Instinct 1, and Instinct 2 watches. The Forerunner 955’s solar technology is identical to how it’s been implemented on the Fenix 7, which means it’s a step-up over the Fenix 6 implementation, but falls a bit short of the solar potential that the Instinct series has with larger (but more obvious/visible) solar panels.
The Forerunner 955 has two basic solar panels on it:
A) A thin rim surrounding the inside edge of the display, which is easily seen
B) A layer below the glass but above the display, that is essentially invisible to you
Note that the display sizes are *IDENTICAL* between the Garmin FR955 Solar and non-Solar. The Solar band space is taken from the bezel, not from the display. Also, the display/solar strip sizing (4mm) is identical between the FR955 Solar & Fenix 7 Solar (the mid-sized one).
It might take you a few days to get used to the visual aesthetic of the solar rim on the FR955. I’d say the very first time I looked at the watch I was like “Nobody really asked for this”. For some reason it just stuck out more than on the Fenix 7 series (despite being absolutely identical). But over a few days I got used to it, and now I don’t notice it at all.
The thin 4mm strip around the edge of the display can collect 100% of the sun’s rays. Well, technically it’s of course less than that, but in terms of simple relativity here, we’ll go with that being 100% from a Garmin spec standpoint. Meanwhile, the portion under the glass can only receive 7% on the FR955 – but the surface area of course is massive.
On a solar series watch, you can check the current solar ‘income’ either through various watch faces or widgets. You’ll see for example this little sun icon, which is broken out into 10 pieces, each indicating 10% of full intensity. Technically speaking, full intensity is considered 50,000 lux conditions. Once you get to 100%, then the full sun icon lights up, no matter how sunny/powerful it is outside.
However, 50K lux actually isn’t super bright. For context, on a mildly sunny day in January in the Netherlands, it’s 10-40K. Similarly, a summer day in the Mediterranean and I’m easily clocking in 100k+ lux. In the Caribbean a few weeks ago I had 100K to 150K in the sun (mostly in the 60-100K range). All of Garmin’s figures for battery assume 3 hours a day at 50K. So in the winter that might be tough for folks, whereas in the summer on vacation, that’s probably trivial. Garmin notes that if you go beyond the 50K conditions, it’ll leverage that power – even though the icon itself won’t show more than the full sun indicator.
One key difference though between the Fenix 7 Solar series and the Forerunner 955 is that the FR955 won’t show the exact gains number, whereas the Fenix 7 will. This lack of gains number is identical to how it works on the Instinct Solar series, but in that case Garmin said the reason that metric was missing was due to a difference in the underlying power components.
Either way, here’s some numbers on the differences between Solar vs Non-Solar (these are official spec numbers):
GPS-only: 42 hours (49 hours with solar charging, but realistically it can be higher) All Systems: 31 Hours (34 hours with solar charging, but realistically it can be higher) All Systems + Multi-band: 20 hours (22 hours with solar charging, but realistically it can be higher) All Systems + Multi-band: + Music: 8.5 hours UltraTrac: Up to 80 hours (or 110hrs+ with solar charging) Smartwatch (not GPS, just a good place to stick it): 15 days (up to 20 days+ with Solar) *All Solar edition stats assume 50K lux solar conditions for 3 hours per day
As you can see, the gains can be somewhat significant in certain categories, assuming you hit that 3hrs of 50K lux conditions per day. So imagine you’re hiking in the summer across a mountain range. In that case, you’ll likely have both far more than 3 hours a day in the sun, and depending on the weather/location, you’ll also have way more than 50K lux conditions (perhaps 100-150K lux conditions). Garmin says that in none of these scenarios are they claiming ‘forever power’, but the reality is, if you turn off certain features, then you can basically get there with even just a few more hours of summer sun conditions. Inversely, if you’re hammering offline music + multi-band GPS in a winter snowstorm with the optical HR sensor enabled doing PulseOx 24×7, then solar isn’t gonna net you much.
Sports Usage:
The main reason to buy a Garmin Forerunner 955 is for sports. And the FR955 has a boatload of sport modes. Not quite as many as the Fenix 7 series (for example, it lacks Windsurfing), but it’s pretty darn close. The key thing to understand about the Garmin Forerunner and Fenix series though, is that the sport modes themselves are really only a piece of the puzzle.
The bigger aspect to understand is how many sport-related features tie it all together. Things like recovery and training load features, or functions like custom workouts or deep navigation options. And within all these areas, there are literally hundreds, if not thousands, of features. And there’s a strong likelihood you’ll never use 95% of them.
But the reality is you’ll use 1-5% of them, every single day. And which 1-5% you’ll use will vary wildly from person to person. I use sports features every day that others never use, and vice versa. It’s fundamentally why they lead this category. And perhaps more importantly, over the last few years, the software quality has increased substantially, largely through open firmware beta programs that go on for months.
To begin, you’ll tap the upper right button, which cracks open the sports listing:
The sports modes available on the Forerunner 955 are as listed below (some are technically not sports, but fall under sports modes in the Garmin world, like Map Manager):
Run, Map, Track Run, Treadmill, Bike, Bike Indoor, Pool Swim, Open Water Swim, Triathlon, Multisport (custom), Virtual Run, Indoor Track, Trail Run, Ultra Run, MTB, eMTB, Cyclocross, Gravel Bike, Bike Commute, Bike Tour, Road Bike, eBike, Hike, Climb, Golf, Swimrun, Ski, Snowboard, Backcountry Ski, XC Classic Ski, XC Skate Ski, Snowshoe, SUP, Kayak, Row, Row Indoor, Tennis, Pickleball, Padel, Walk, Yoga, Pilates, Breathwork, Strength, Climb Indoor, Bouldering, Cardio, HIIT, Floor Climb, Elliptical, Stair Stepper, Health Snapshot, Navigate, Track Me, Project Waypoint, Clocks, Other, Connect IQ Store
Each of these sport profiles are customizable, be it things like the data pages and data fields, or the aspects like auto-lap or auto-pause, or even ancillary settings like ClimbPro (for hiking/running/cycling in the mountains/hills) or alert settings. Every sport has a slate of these that can be tweaked, and you’ve got two main ways you can tweak them. First, is on the watch itself, and second is on your smartphone.
The Forerunner 955 follows the Fenix 7’s introduction of phone-based configuration for virtually every setting on the Forerunner 955, including not just sport modes, but all the watch settings too. From GPS satellite modes to widgets, even generic settings – all can be configured from the phone. About the only thing that can be viewed but not configured on your phone is downloading maps or adding new sensors. Those you’ll need to do from the watch itself.
On the phone, you’ll go into the settings and you can choose a given activity type to change the data fields or settings for that activity type:
This also includes built-in sensors like the altimeter, barometer, and optical HR sensor, but you can’t add external sensors here (like a power meter):
Overall it’s pretty good. It’s not perfect, but this is the first year we’ve seen Garmin introduce full configuration from the phone, and it’s definitely appreciated. Of course, you can always tweak data fields or settings from the watch – which is handy out on the trail or such when you want to quickly add a new data field and don’t have your phone handy.
The Forerunner 955 supports up to 6 custom data fields per data page, and has no practical limit of data pages you can customize/create. There are both custom data fields, but also numerous stock graphical pages like the heart rate or power gauges.
Once you’ve got everything sorted, you’re ready to start your workout. We’ll use a run as an example. For the most part, all these sport profiles work in roughly the same way. If it’s an outdoor sport profile that uses GPS, then it’ll find GPS (which usually only takes a second or two), and then no matter the sport location, it’ll also confirm it has heart rate lock. And further, if you’ve got external sensors, it’ll connect to those.
In my case, I’m going to go with a custom workout I’ve loaded. You can make custom workouts on Garmin Connect itself, or load them from 3rd party platforms. Or have them automatically sync from 3rd party platforms like TrainingPeaks. In addition, each day Garmin will suggest a workout for both run and bike. These are Daily Suggested Workouts, and look at your training goals (calendar), as well as current training load to figure out what makes the most sense. More on the vast changes there in the next section.
Once you get cookin’, you’ll see the data pages you’ve configured for that sport. One of the newer ones you’ll notice in there is Stamina. This was introduced on the Fenix 7 series, and aims to tell you how much juice you have left in the tank for this workout at this specific intensity. If you increase intensity, it’ll decrease your duration till death (in either distance or time). And if you decrease intensity, it’ll increase your duration till collapse.
Using the default Stamina page, the top portion of the page, titled Stamina, is your short-term potential. In other words, how much can you give right now at this second. This is the most notable one for intervals, because it’s going to go up and down. Whereas the middle-left one is your Potential, which is your long-term potential. How long can you maintain this interval workout for, or in an endurance event – how much gas is in the tank for the entire day. This will steadily decrease over the course of the workout.
But I actually prefer creating a new custom Stamina page that shows me the metrics in a more logical format, specifying exactly how much time/distance I have left, along with my current pace/HR. Here you can see earlier in the workout:
And then ultimately, you can review all this data afterwards in Garmin Connect:
In the case of a steady-state workout (like above), the line tends to be pretty linear. However, if using it during an interval workout, then you’ll see more variation, since you recover repeatedly. However, only your short-term stamina recovers, not your long-term. That’s logical, because that’s how intervals work. You slow down to recover for the next one, but eventually you’ll run out of gas to do more repeats.
All of this is based off of a blend of your estimated VO2Max in conjunction with aspects of Body Battery and recovery from the previous night. As such, it’s moderately important to get at least a few good hard workouts in on the watch, so that it can approximate your VO2Max. Else, the data will mostly fall apart.
As a good example, here’s a 7-hour ride from a Fenix 7 a few months ago using this same feature:
Yes, I seriously managed to arrive at my hotel with 0% remaining, and 1% potential. Here’s what the Fenix 7 said then:
Overall, I find Stamina pretty darn close to reality. Sure, I could have gone a few more kilometers, but to be within a couple of kilometers of exhaustion after 120KM and 10,000ft of climbing? That’s solid.
Anyways, back on my FR955 workout, we’ve got the newish running power. I saw ‘newish’, because it’s basically just shifting what used to be Garmin’s Running Power Connect IQ app, into being native running power. As such, it still (incredibly disappointingly) depends on you having an HRM-PRO, RD-POD, HRM-TRI, or HRM-RUN sensor connected. It is not native running power using your wrist like Polar or COROS.
Further, you can’t feed Stryd data into this (or any other running power sensor). Garmin says they aren’t opposed to that, and that they discussed having such an implementation (the same way it works on cycling), saying “we will likely get there sooner or later, but we just ran out of bandwidth and time on these products”. And to be fair to Garmin, no other company supports spec standards as strongly as they do, and they’ve virtually always made good on their promises to bring things to standard (eventually), such as seen with radar sensors, cycling dynamics, running dynamics, and so on. Note, you can still use the existing Stryd Connect IQ apps though, just as before.
In my case, I connected the RD-Pod to the watch. It costs about $70, and clips onto the back of your running shorts.
Then, I went in and added the running power fields. Note that as soon as you pair a compatible running power sensor, it’ll automatically record that data behind the scenes, even if you don’t add the data fields. Nonetheless, here’s the fields available:
– Power
– Power Gauge
– Avg. Power
– Lap Power
– Last Lap Power
– Max. Power
– Power Zone
As you can see, you’ll have a lot of the core fields you’d expect, but not everything you’d get on the cycling side. There’s disappointingly no 10-second or 30-second averaged power, nor things like normalized power. Granted, Garmin’s running power tends to be a bit more smoothed, but I don’t at all understand why there isn’t parity here on this kind of stuff.
In any event, while out running you’ll see the power as you’ve configured it. In my case, I went with the power gauge up top, and my lap power down below:
You can also do structured power workouts based on that too, and it’ll execute against those. And further, you can define power zones specific to running, and then set to have zones defined on either % of threshold or straight watts.
Once your workout is done, you’ll get a slew of summary information, including notably now running power shown on virtually all the pages in various places:
Switching focus areas briefly, the Forerunner 955 allows broadcasting of your heart rate data (from the optical HR sensor) on both ANT+ & Bluetooth Smart, so you can pair it up to something like a bike computer or any other app. Every app and device on the planet supports one of those two standards. You can enable this to automatically turn-on anytime you start a sport profile, or you can do a one-off enablement of it:
Here you can see it connected up to Zwift:
Inversely, the Forerunner 955 can connect to a slate of sensor types on both ANT+ & Bluetooth Smart, allowing you to save those sensor pairings. They are as follows:
eBike (ANT+), Extended Display (ANT+), External HR (ANT+ & Bluetooth Smart), Footpod (ANT+ & Bluetooth Smart), Headphones (Bluetooth), inReach (ANT+), Cycling Lights (ANT+), Muscle O2 (ANT+), Power (ANT+ & Bluetooth Smart), Cycling Radar (ANT+), RD Pod (ANT+), Shifting (ANT+), Shimano Di2 (Propriety ANT), Smart Trainer (ANT+), Speed/Cadence (ANT+ & Bluetooth Smart), Tempe (ANT+), VIRB (ANT+).
As noted, you can save multiple sensors of the same type, as well as give them custom names (e.g. DCR’s Heart Rate Strap, or Cervelo Quarq Power Meter).
Now for this review I’ve broken out all the training status/load/recovery metrics into a new section, so we’ll talk about that after this section. However, before we dive into that, I wanted to briefly cover the new race calendar and race-day widgets. This allows you to create races on your calendar which show up in a small widget showing a count-down and race-day conditions. However, *FAR* more important than that is that it actually changes what your watch will recommend to you training-wise, specifically for running. If you put a marathon on there (e.g. for 3-4 months out), it’ll immediately create an entire structured training plan of different training phases, including taper, for that event. Here’s one of a few real-life events I created and added to my calendar:
I also added a triathlon for later in June, but despite being a triathlon-focused watch, it doesn’t really support that well. You can’t define the different sport legs, and it won’t even show up on the watch at all. Right now, it’s basically just a run/cycling feature.
Note that you can search for events on Garmin Connect, which will pull in event data from Active.com, including even event logos. In my case, I added some faux-logos for my events, but they didn’t show up on the watch anywhere.
In any case, there’s two widgets, the first is the Race Calendar. This shows your upcoming events, and the number of days till the event, and for running it’ll also show a predicted finish time based on your VO2Max score, and show how that finish time has changed over the last month. The only challenge here is that it assumes the VO2Max score is correct, and also doesn’t account for forward gains (the time between now and the event). However, it will account for heat/humidity using the average weather for the day of the event:
Then there’s the Race Widget itself. This shows more detailed information including an overview of the course, as well as race-day weather for the exact start time of your event.
While these are kinda limited right now for triathletes, they are sorta neat for running/cycling. But again, the real meat of this feature is how it drives automatic workout creation and training plans. Which, is a great segue into the next section.
Training Readiness & New Related Metrics:
It’d be easy to look at the Forerunner 955 and focus on the solar power or multi-band GPS as the key new features. But in reality, I’d argue the biggest shifts are actually the way it presents training guidance. Any regular Garmin user knows the frustration of getting an ‘Unproductive’ message on your watch, despite having just thrown down big training days as part of a schedule.
Garmin’s significantly revamped how Training Status, Training Load, and a slew of metrics related to it work. At first glance, you’d likely just see the new Training Readiness & HRV Status metrics and assume everything else was the same. But there’s been fundamental shifts to those metrics that try to lessen the chance you’re going to get an Unproductive message when you’re simply in a hard training block.
First, though, we’ve got a couple of core concepts to explain briefly, and then in more depth in the rest of this section:
Training Readiness (New): This new metric aims to be your one-stop shop to decide whether or not to train that day. It blends Sleep (vs both short and long-term history), Recovery Time, HRV Status, Acute Load, and Stress. In short, you can spike one category (badly) without necessarily killing your next training day. But all categories aren’t created equal. Training Status (Revamped): This is looking at your acute load, HRV status, load focus, and VO2Max trends. This one is less about should you train, and more about how you’re training. Meaning, are you doing too much high intensity, or too much low intensity? That’s what’ll give you an unproductive status. In other words, how would a coach look at your training log, ignoring most other life/feeling type metrics. HRV Status (New): This is measuring your HRV values constantly while you sleep, and then comparing it against your 3-week baseline, up to a 90-day rolling window baseline. A single night of drinking doesn’t tank this score, but three nights of partying won’t keep you in the green. Acute Load (Newish): This is looking at your last 7 days of load, except the load now burns off dynamically. Meaning, a hard training day 7 days ago is far less impactful to the score than a hard training day yesterday. Previously this was called 7-Day Load, now it’s Acute Load. Load Focus (Same): This shows which categories your training efforts have fallen into, over the last 4 weeks. These include Anaerobic, High Aerobic, and Low Aerobic. Basically, you need to have an even training diet to get faster. Simply running hard/all-out every day won’t make you faster. It’ll just get you injured and slower. Recovery Time (Same): This calculates how much time you need till your next hard intensity workout. As is often misconstrued, this isn’t till your next workout, just your next hard one. This is largely the same as before. Exceptionally good sleep can speed this up, and inversely, a high-stress day can slow this down.
There are many metrics here, arguably, too many. But setting aside the quantity of them, most of them do actually have a purpose, even if confusing. If I were stepping back and looking at which ones to focus on, it’d essentially just be the new Training Readiness status. But before we get there, we’ll start with the foundational ones, and for that, the new HRV Status bits.
Up till now, Garmin used HRV data behind the scenes for countless metrics. But never really exposed that to you. We first saw them start to do so with the Health Snapshot feature a year ago, which allowed you to take one-off HRV values, but no easy way to trend them.
HRV Status works by trending your nightly HRV values against historical timeframes. It records your HRV values while you sleep, presenting you with a graph of the nighttime fluctuations and then the average/max values for the night, as well as 7-day trending values:
But this is just the data gathering bits. You’ll need to do this for three weeks before you get your first true ‘HRV Status’ message. More specifically, it needs 12 days of baseline data first, then you need 4 out of the next 7 nights, before you get the first message. So basically, day 19 in a perfect scenario. Prior to that point you’ll get all the HRV data, just not the pretty color chart/guidance bits. Once you do hit the background data, then you’ll get the coloring. Below at left you can see pre-HRV-status population, and then at right with the coloring:
That chart basically has four core values: Low, Unbalanced (Low), Balanced, and Unbalanced (high).
However, there’s also a more rare one at the very bottom titled ‘Poor’, which basically means something is likely a bit non-ideal for you:
There are a slew of messages that Garmin will then enumerate to you, based on what it thinks is causing the shift in HRV (good or bad). For example, it’ll note how a spike in training load is driving it, or lack of sleep might be impacting it.
In a long conference call with the FirstBeat team behind this, they noted that these ranges are unique to you, which is why they need the historical data as long as it is before they start giving guidance, and that historical data has a trail of 90 days back that it’s comparing to. Further, not only are the ranges unique to you, but so are the widths of the ranges. Meaning, if you’re super stable and every night have an average of 50ms (+/- 5ms), then that middle balanced range will be thinner than someone who has more variability.
(Above is a very rough visual comparison between a Polar H10 worn throughout the night and the Garmin FR955. I say ‘rough’ because to begin, the SDNN isn’t exactly the same as what Garmin records as SDRR, as Garmin’s is error corrected. Second, the scales aren’t the same here. Further, trying to get a chest strap to have good connectivity the entire night isn’t actually super easy. So in the same way that sleeping on your side/wrist can impact wrist values, so can movement where the strap might not be perfectly placed at some random point in the morning. Nonetheless, the averages recorded are within 2ms. The Polar’s average for the night was 52, while the Garmin’s was 54ms. If I can find better ways to get the data out of Garmin’s platform, I can look to do other comparisons.)
The idea here though is that a single bad night (of say, drinking), shouldn’t plummet your HRV status. Because by and large, that’s not how HRV status works in real-life. Simply having low values overnight can mean anything from a heavy training day prior, to poor sleep, to a bit of wine, to too much sun, etc… But it doesn’t by itself mean you shouldn’t train. In hard training blocks, that requires adding stress. That’s the point. For Garmin (as well as how Fitbit and Oura work, but not Whoop), the longer-term trending is far more important. It’ll take 2-3 really bad days to start shifting that HRV Status to a lower category. Which, is how it should be.
Garmin/Firstbeat’s Herman Bonner noted that “We’re not doing anything with a single night HRV value” in relation to training recommendations, with Elina Lammi, Firstbeat’s lead scientist on the HRV feature following up saying “The science is quite strong that you need at least 3-4 values per week before you can say what your body is doing”. Much of Firstbeat’s work here is based on many years of taking HRV values as part of their higher-end athletic suite that supports HRV tracking.
Next, there’s the new Acute Load. At first glance, you might think this is just 7-day Load renamed, but that doesn’t really cover all the changes under the hood. Yes, it shows your 7-day load, but now that load burns off dynamically. Previously, if you had a big ride 6 days ago, that load would be factored into your total 7-day load duration as if it just happened yesterday. Versus now, it’s weighted to burn-off within a few days, as logical. That’s because a week later it’s unlikely that big ride is still impacting you. The point of this is to reduce the massive swings that used to occur in the Training Status panel when a big workout from a week ago disappears, making you go instantly from Productive to Unproductive in a matter of seconds.
There are also new ranges shown on the Acute Load page, above, which Garmin calls “the tunnel”, basically a green range of goodness. You can see the exercise load types as well auto categorized:
This is then shown in the Load Focus widget for longer durations, some 4 weeks worth. As you can see, it’s displeased about my anaerobic shortage. It’s been upset about that for a while. This widget/area hasn’t changed any from before.
Next, is an easier one – recovery time. This largely hasn’t changed from before, but I need to briefly highlight it, because it’s now far more important in the new Training Readiness score that I’ll talk about momentarily. Recovery time is showing your recovery time based on workouts. This is basically showing your recovery time till your next hard workout, in hours. This can speed up with a good night’s sleep, or slow down with crappy sleep or a very stressful day:
This finally gets us to the new metric, Training Readiness. This metric is effectively Garmin’s answer to people’s confusion on trying to use a blend of Garmin Body Battery and Training Status to decide whether to train, or how hard to train. The idea with Training Readiness is that it takes into account everything, but is more heavily influenced by recovery time (from last workout) and sleep. First, there’s the score you’ll see each morning:
However, that score will actually go up throughout the day, because your recovery time is decreasing. So you’ll have a lower score at 7AM versus 7PM, because you’ve got 12 more hours of recovery from your last workout. Again, this makes a ton of sense, because if you normally work out at night, then working out again immediately the next morning would be more impacting recovery-wise than waiting till the usual evening workout time.
The score is comprised of all the fellows you’ve seen before: Sleep, Recovery Time, HRV Status, Acute Load, Sleep History, Stress History
Each of these components is weighted in varying ways, and against varying timeframes. Here’s the run-down:
– Sleep: This one is specifically looking at last night’s sleep
– Recovery time: This looks at your Recovery time from last workout, in hours
– HRV Status: This is comparing your 7-day trend versus historical trend
– Acute Load: This is looking at your 7-day trend
– Sleep History: This is looking at last night versus your prior 2 nights of sleep history
– Stress History: This is looking at the 3 days of daytime data (excluding overnight readings)
Again, the idea here is that you can figure out what’s impacting your training readiness, and whether it’s expected. If you’re at a training camp, you’ll expect high Acute Load and likely high recovery time too. But hopefully, the other stats are normal/good. Thus, you can try and figure out whether to proceed or not. Whereas if everything is looking like a red dumpster fire, then you should probably train on the couch.
This then gets us to the final area, Training Status. This too has been revamped a bit. Regular Garmin users know this as the place where you’re slapped with an ‘Unproductive’ message. Years of using a Garmin watch have demonstrated that, as much as I hated to admit it, generally speaking when the unit said ‘Unproductive’ for my training status, there was probably some truth there. Maybe a pebble’s worth, or maybe a boulder’s worth, but the reality is that the Unproductive message was on an imbalance in your training. Either an unhealthy spike, or a lack of certain training intensity zones. And in some ways, that’s still the same:
However, now, the unproductive is more clear that it’s about your training zone focus areas. In my case it initially was unhappy about lack of anaerobic load time. But then a few days later it was unhappy about too high a training load (despite being in the tunnel).
And then in the midst of all that it was unhappy about my decreasing VO2max. However, I think the decreasing VO2Max is actually a new-watch bug (more on that in a second). You can see earlier it lists the three core factors for Training Status: VO2Max, HRV Status, and Acute Load
And a big challenge for me here is that VO2Max score. It doesn’t see me trending as stable/increasing. And this I think is actually a bug. Garmin doesn’t seem to pull in historical Vo2Max values to a new watch. It seems to rebuild them on a new watch, and it usually takes 4-6 weeks to get those values correct across multiple sports, on multiple workout types (e.g. steady-state, interval, etc…). So when I changed to the FR955 a month ago, it basically flat-lined my VO2Max values from 56-58 down to 50 effectively overnight. And thus, it sees that as a decrease (I then went back and looked – and every time over the last 2 years I put on a new watch for testing, my VO2Max dropped for 3-5 weeks until the new watch figured things out again). That’s simply wrong. Albeit, it’s something that’ll probably sort itself out within a week or two. And at least now I can just ignore it and use Training Readiness instead.
Ultimately, setting aside what appears to be a short-term VO2Max quirk and my unproductiveness, Garmin seems to have nailed the Training Readiness feature. It does precisely what its name implies and seems to align super well to how I’m feeling each day, and also within the day as the values shift based on recovery time. I’d argue as an athlete using your own/others schedules, you can largely ignore the Training Status messages (e.g. unproductive), but still use Training Readiness as a good indicator for whether your body needs recovery or not, especially if you’re seeing a slate of red across all of the sub-components, that’s probably a very valid indicator that you’re in training/fatigue/etc debt.
Mapping:
While the previous Forerunner 945 had maps for the region you bought it in, the Forerunner 955 now has the ability to download maps for any region for free. Beyond that though it contains new navigational features, like Up Ahead, which lets you see pre-planned waypoints and the distance to those waypoints, sorta like a check-list or a cue sheet. Virtually all of the core navigation/routing functions are identical between the Forerunner 955 and Fenix 7 series, so you can also see my deeper navigation/routing section in that review too.
First, we’ve got the new map manager feature. As noted, previously you’d just get the maps for the region you bought it in (e.g. North America or Europe), but not outside that. You’d have to either download free 3rd party maps or purchase Garmin ones, both of which were cumbersome. But the new map manager feature makes it silly easy with WiFi, albeit a bit slow. You can also do it far faster with your computer and the Garmin Express desktop app.
Both Forerunner 955 editions have the same 32GB of storage (same as the Fenix 7 Sapphire units). To access the map manager, you’ll go to Settings > Map > Map Manager:
Within that, you’ve got two sections. The first is the TopoActive Maps, which are the main maps that you want for sports/adventure navigation. However, there’s also entries below it for SkiView and CourseView (golf), plus a vert basic worldwide base map (it’s useless). The SkiView and CourseView maps are preloaded on all units, because they’re relatively small (24MB for SkiView, and roughly 30-40MB for each continent’s golf courses in medium view).
However, it’s the TopoActive maps that are where the goods are. When you open that, it’ll show you which maps you’ve installed as well as the size. Or, you can choose ‘Add Map’, and it’ll connect via WiFi and show you additional map regions to download.
You can see above that the North American maps are about 9.1GB, and the TopoActive Maps about 10.4GB. And on the previous page it showed I had 7.8GB available. Remember, maps download sizes here are less about landmass size, and more about the amount of trails/roads/point of interests/etc… since that requires more data space.
For context, here’s the current sizes of these maps. These will undoubtedly change slightly over time, but shouldn’t change too dramatically over the years:
TopoActive North America: 9.1GB
TopoActive Europe: 10.4GB (*See update below for added Europe breakout)
TopoActive THID: 2.5GB
TopoActive MENA: 1.4GB
TopoActive Australia & New Zealand: 1.8GB
TopoActive Africa: 4.4GB
TopoActive Japan: 3.8GB
TopoActive Hong Kong & Macau: 17MB (yes, megabytes)
TopoActive South America: 6.0GB
TopoActive Taiwan: 96MB
TopoActive Korea: 213MB
TopoActive SGMYVNPH: 1.3GB
TopoActive China Mainland: 663MB
In addition, for Europe, Garmin has added the ability to download specific regions when you connect via computer instead. This is super helpful if you’re a bit tight on space. They are as follows:
Europe Whole: 10.4GB
Europe West: 6.3GB
Europe Central: 6.4GB
Europe East: 6.2GB
I don’t know why individually these add up to way more than just downloading Europe as a whole, but, that’s the actual sizes on the watch, listed on Map Manager for the TopoActive Europe region, within the watch itself, after the download of each Europe region. I’ve added all of these regions below in a gallery, so you can see exactly which countries are part of which regions:
Note you can only toggle one of the Europe regions, or all of Europe. So it’s either all of Europe, or just a single region. I suppose since two regions takes up more than the total download, I guess that’s why.
Multi-Band GPS Satellites Overview:
The Forerunner 955 and Forerunner 255 both add multi-band/dual-frequency GPS, which Garmin first introduced into their lineup with the Fenix 7 & Epix series watches back in January.
First up though, let’s explain what multi-band GPS is. At a non-technical level, it’s been touted as the holy grail of GPS accuracy. But technically, GPS is the wrong word. That’s because GPS is actually a ‘brand’, whereas this is officially just an umbrella of GNSS’s (Global Navigation Satellite System). But we’ll set aside the Kleenex argument for the moment. The theory behind dual-frequency GPS is that you can connect across two different frequencies to the satellites, thus if one frequency is having connection or visibility troubles this would mitigate that by providing not just a secondary frequency to validate against (L5), but a frequency that’s 10X greater. Thus, instead of perhaps 20-25 satellites, there’s now upwards of 60+ satellites your watch can see. And by seeing more satellites in addition to increasing the signal and varying the frequency, it allows your watch to better mitigate signal obstructions and increase accuracy.
Garmin is hardly the first company here in this space. While Garmin did roll out multi-band GPS to some of their hand-held devices a year ago, the Fenix 7 & Epix were the first Garmin wearables to have this. In any case, the first endurance sports watch to add it was the COROS Vertix 2 last summer, and then more recently Huawei has touted it in their GT 3. In my testing of the COROS Vertix 2, I didn’t see holy-grail-like results. It wasn’t bad, but it wasn’t the promised land either. Of course, the tech is new, and thus we’re likely to see (and have seen) firmware updates rapidly that’ll improve that. More on that in a minute. In the case of COROS, they’re using the MediaTek/Airoha chipset (AG3335M), and Garmin confirmed they are also using Airoha as their supplier for all their units (Fenix 7 Sapphire units/Epix Sapphire/FR255/FR955/Tactix 7), and that it’s the same chipset that is in the Fenix 7/Epix Sapphire units. While Garmin won’t disclose which exact chipset they’re using, it’s incredibly likely it’s the exact same AG3335M chipset, since practically speaking it’s the only public Airoha chipset that matches the specs for what Garmin needs.
In any event, the Forerunner 955 makes some notable changes here, specifically in GPS selection. With the Fenix 7 & Epix series, the default was “All Systems”, which is good, but not as good as “Multi-band”. However, with the Forerunner 955, the default GPS option is now “All Systems + Multi-band”. That certainly consumes substantially more battery life, but, gives you the best accuracy.
In conjunction with the Fenix 7 launch, and carried through to the Forerunner 955, Garmin has revamped the GPS selection process. There’s two places you can change satellite things:
Entire watch (System): This is a system-wide setting across all sport profiles, and is considered the default for any sport profiles unless otherwise specified Per-Sport/Activity Profile: This allows you to increase (or decrease) GPS accuracy on a given sport, likely in exchange for battery life.
So the idea being that you can perhaps use higher-level dual-band accuracy on an openwater swim or a mountain bike ride through difficult terrain, but then go with less-battery-draining options for a road bike ride, which is typically one of the easier things to track GPS-wise.
Next, there’s now four GPS settings you can choose from:
GPS Only: This is the base GPS-only option, however, Garmin says they’ve drastically increased the battery life here compared to the past GPS-only option, and indeed, you can see that in the battery chart. All Systems: This confusingly named option is dealer’s choice between GLONASS and GALILEO, and Garmin is the dealer. As a user you can’t choose which one to use, but instead, Garmin is now switching between GPS< GLONASS, GALILEO, BeiDou, and QZSS based on the quality of the satellites from each, determining “which to prioritize” All Systems + Multi-band: This is the new dual-frequency option that everyone has been waiting for, which combines the All Systems option, and then makes it multi-band across both L1 and L5 satellites. As a result, this burns a boatload more battery, and in theory is the most accurate. UltraTrac: This setting is for crazy-long adventures, whereby it reduces the GPS update rate significantly. Do not ever use this setting unless you absolutely need it, your GPS tracks won’t be pretty. Think of this as the emergency option.
Note that the usual smart-recording or 1-second recording option is still in the settings (and still annoying defaulted to ‘Smart Recording’), but that has no bearing on the GPS reception timing/display, it’s purely what it writes to the recorded file.
Using the Power Manager feature, you can get crazy detailed on which features you care about (for example, toggling off optical HR sensor and connecting to a chest strap saves a boatload of battery), and thus can easily extend these. Or, inversely, leaving the backlight on at full blast while playing music will decrease them. Use your powers wisely.
Here’s a simple listing of the battery claims on the Forerunner 955 & Forerunner 955 Solar:
GPS-only: 42 hours (49 hours with solar charging, but realistically it can be higher) All Systems: 31 Hours (34 hours with solar charging, but realistically it can be higher) All Systems + Multi-band: 20 hours (22 hours with solar charging, but realistically it can be higher) All Systems + Multi-band: + Music: 8.5 hours UltraTrac: Up to 80 hours (or 110hrs+ with solar charging) Smartwatch (not GPS, just a good place to stick it): 15 days (up to 20 days+ with Solar) *All Solar edition stats assume 50K lux solar conditions for 3 hours per day
I’ve largely been testing within the multi-band/dual-frequency option, and looking at battery burn rates, they’re pretty much exactly on spec. Here’s a 2-hour ride with parts of it in the sun, and you can see the battery burn rate there:
Or another 80ish-minute ride with mixed sun conditions, again with multi-band/dual-frequency:
So, now that we’ve talked about the options, let’s actually look at the results of it.
GPS Accuracy:
There’s likely no topic that stirs as much discussion and passion as GPS or heart rate accuracy. A watch could fall apart and give you dire electrical shocks while doing so, but if it shows you on the wrong side of the road? Oh hell no, bring on the fury of the internet!
GPS accuracy can be looked at in a number of different ways, but I prefer to look at it using a number of devices in real-world scenarios across a vast number of activities. I use 2-6 other devices at once, trying to get a clear picture of how a given set of devices handles conditions on a certain day. Conditions include everything from tree/building cover to weather.
Over the years, I’ve continued to tweak my GPS testing methodology. For example, I don’t place two units next to each other on my wrists, as that can impact signal. Instead, I’ll often carry other units by the straps, or attach them to the shoulder straps of my hydration pack or backpack. Plus, wearing multiple watches on the same wrist is well known to impact optical HR accuracy.
Normally, I’d spend a lot of time showing you chart after chart of perfectly good runs/rides/hikes. But this time, I’m going to save you (and me), a boatload of time. Because frankly, they’re all perfect. Nonetheless, if you want to look at data sets, you can. All of these are using multi-band GPS:
– Here’s a run deeper into the forest with big trees and all – This against the COROS Vertix 2 and Forerunner 945 LTE. Also, boringly perfect…except when the COROS Vertix 2 was wandering off-trail somewhere else (there was also a 100m stretch where the Forerunner 255 was a few meters off the trail).
So what do I do when I get bored making perfect GPS tracks? I add buildings. Big. Ass. Buildings. Combine that with a bit of European walkable street design, and we get tiny streets surrounded by the business district – perfect to try and screw up even the most persistent GPS units.
And thus I give you this data set, a 13KM run where I ended up zig-zagging back and forth through the downtown business district, under the overhangs of buildings trying to break things. Plus, I threw at it numerous massive highway overpasses stretching hundreds of meters each (four times), and passed by a windmill, just in case it got distracted with the views. Here’s the overview. Ignore that random Polar Pacer Pro line skipping a highway section, that was just me accidentally pausing it.
Instead, let’s cut to the good part, which are the buildings. First, here’s the entire gaggle of watches – the COROS Vertix 2, the Garmin Forerunner 945 LTE, the Polar Pace Pro, plus the FR955 and FR255. I basically swept up and down the streets once, like a wiggle worm:
Now, let’s remove all the noise, and show just the Forerunner 955 and 255. As you can see, drastically different. The Forerunner 955 was spot-on crazy perfect here, while the Forerunner 255 struggled a little bit more. I’m reasonably confident I had set the FR255 to multi-band, but now am questioning whether or not that got switched back with a firmware update. I mean, it’s still better than all of the other watches above, but doesn’t match what I’d expect if multi-band was toggled on. I’m going to do this again tomorrow and report back.
Finally, we’ve got an openwater swim. Forerunner 955 on the left wrist, Forerunner 255 on the right wrist, and then another GPS atop a swim buoy attached to me. Now while I had set the FR255 to be multi-band the day prior, I have a funny feeling a recent firmware update reverted it back, because later that night I checked again, and it was back to non-multi-band. In any case, here’s that data set:
As you can see, it’s very very close, but the FR255 seems slightly imperfect, likely because of what I think was the lower GPS configuration (there’s no public way that I know of to see which setting was used after the fact). Whereas the FR955 was scary-accurate with the swim-buoy. Like, basically stuck to it, check out how perfect it is around those posts, which is precisely where I same, right up against them. It’s crazy.
Ultimately, the multi-band option on the Forerunner 955 and Forerunner 255 units are producing some of the best GPS tracks we’ve ever seen from a GPS device. Which makes sense, because the multi-band Fenix 7 & Epix units from a few months ago using the same GPS chipset are also doing the same. What’s most impressive though is that just a few months ago you had to spend double the money to get this level of accuracy, and now, you’re starting off at $349 for the Forerunner 255 or $499 for the Forerunner 955.
Of course, there is a trade-off on battery there. It basically halves your battery life. However, in my testing of other units on the ‘All Systems’ GPS option, the accuracy was nearly identical, even in the buildings of Manhattan. Once I get a breather, I’ll try doing some more building tests on the lower-battery burning options and add them in.
(Note: All of the charts in these accuracy portions were created using the DCR Analyzer tool. It allows you to compare power meters/trainers, heart rate, cadence, speed/pace, running power, GPS tracks and plenty more. You can use it as well for your own gadget comparisons, more details here.)
Heart Rate Accuracy:
Before we move on to the test results, note that optical HR sensor accuracy is rather varied from individual to individual. Aspects such as skin color, hair density, and position can impact accuracy. Position and how the band is worn, are *the most important* pieces. A unit with an optical HR sensor should be snug. It doesn’t need to leave marks, but you shouldn’t be able to slide a finger under the band (at least during workouts). You can wear it a tiny bit looser the rest of the day.
One of the things that’ll help with the Forerunner 955 compared to something like a Fenix 7 is that the Forerunner 955 is lighter. In general, heavier watches will bounce around more, and thus are more challenging to get optical HR accuracy. That said, in my Fenix 7 testing, I saw pretty much equal results across the different sizes.
Meanwhile, for HR accuracy testing I’m typically wearing a chest strap (either the Polar H10 or the Garmin HRM-PRO), as well as another optical HR sensor watch on the bicep (mostly the Polar Verity Sense, as well as the Whoop 4.0 band). Note that the numbers you see in the upper right corner of the charts below are *not* the averages, but rather just the exact point my mouse is sitting over. Note all this data is analyzed using the DCR Analyzer, details here.
We’ll start off with something relatively basic to get warmed up, in this case an hour-long relatively steady-state run (you can click on any of these data sets to dig in deeper if you want):
The FR955 and FR255 were virtually identical here, and even outdid the chest strap slightly on the initial minute or two, which, is semi-common to see sometimes. The spike/drop you see towards the end was some sort of chest strap connectivity issue, because it dropped from the Polar/Garmin/COROS secondary recording watches all instantly. Then resumed. You do see one minor blip from the FR255 in green around the 50-minute marker, that’s when I was attacked by a goose and was holding my phone on the same wrist as the FR255. More on that another day.
For this next set, my wife dragged me out onto her workout, which was a slate of 20 intervals at 20-seconds, hard. This would be one of the more challenging workouts for optical HR sensors to do (or any sensor for that matter). However, what’s interesting here is that the HRM-PRO actually failed low here, while the FR955 and FR255 were correct. I initially believed it was the two watches that failed (which would be super rare), but then a commenter looked at the data versus pace and it didn’t add up. From there, I pulled in the Whoop 4.0 data (which won’t export, but I can validate it was worn on the upper arm), and that matches the watch data. In any case, the data:
In any case, we see a bit of latency (about 3-5 seconds) from the FR255/955 compared to the chest strap reference, but that was on both ups and downs, so practically speaking it didn’t matter for time in zone. And functionally speaking, nobody is using heart rate to pace 20-second intervals. That’s about speed/power, not heart rate (because HR is a lagging indicator in short-burst scenarios). So while it somehow screwed up the easy part, it nailed the hard part.
Let’s step it up again, this time with a set of 4×400 and 4×800 intervals, along with some warm-up and cool-down. Between this and the above workout, this composes basically anything most runners would do on the higher intensity side. In other words, the rubber meets the road here. Here’s that data set:
I mean, I’m not sure what there’s to say here. This is virtually flawless. There’s nothing meaningful to complain about here.
So again, let’s add more intervals, this time on an indoor trainer, starting off with a ride on Rouvy, this time with the FR955 on the left wrist compared to a Polar Pacer Pro on the other wrist. Here’s that data set:
A smidgen of lag on the FR955, again, just a couple of seconds at most, but pretty good. It beats the Polar Pacer Pro, which shows occasional artifacts here and there (little drops/spikes).
Next, here’s a TrainerRoad session I did, a slate of intervals there as well, and again, it basically mirrors the Wahoo TICKR, except about 1-2 seconds delayed. Data here:
Finally on indoor rides, here’s a set of VO2Max intervals I did, and you can see it’s virtually identical to the Garmin HRM-PRO chest strap. The line below that’s a bit lower/lagging is the Whoop 4.0 band, though, not terribly off.
Finally for now, here’s a couple hour outdoor ride tossed in. Forerunner 955 on the left, and Forerunner 255 on the right. I had a brief pause in the middle there to get some footage (in red), and then it was back to normal riding again. Here’s that data set:
So, setting aside me doing footage stuff in red, the rest of the ride actually isn’t horrific. I generally wouldn’t recommend optical HR for road-riding (or MTB), because you just don’t see good results. But this is actually not too bad. It’s a bit rougher towards the last 20 minutes or so again during stop and go city sections, so it wouldn’t be my first choice of HR sensor while riding, but, if/when things are steadier, it seems perfectly fine.
I’ve probably got plenty more workouts I can stick in here (and will), but essentially, things look about the same as we’ve seen on other Garmin ELEVATE V4 optical HR sensors: Fairly solid. Arguably among the best wrist-based sensors out there, to the point where for my body/wrists/whatever, I can use it pretty reliably on most workout types, including intervals. Like most optical HR sensors, it can have a bad day, but these are few and far between here, and the one time it clearly failed while running was actually an easy part. It nailed every hard interval I threw at it over multiple workouts.
Summary:
While Garmin is generally known for charging a premium for its products, the Forerunner 955 is probably one of the best deals in sports technology today. With the base unit priced at $499, it packs in effectively the same features as the higher-end Sapphire-enabled Fenix 7 units. It’s got the multi-band GPS, the larger 32GB of storage for maps, as well as virtually every feature minus a handful of sports modes (e.g. windsurfing). But for a short time, the Forerunner 955 also has more features than the Fenix 7 does. Of course, it’ll catch up before summer gets into full swing. And, as a reminder, when the Forerunner 945 came out, it was priced at $599, so in effect, the price actually went down for once.
The implementation by Garmin for the new Training Readiness piece is super well done. It’s clear, easy-to-follow guidance that finally does away with the guesswork of trying to figure out exactly what the watch wants you to do. Each component is laid out, and consistently aligns with what’s actually happening in my life – both training as well as non-training. While I think it’s still early days for Garmin’s HRV implementation, for a first go it’s pretty comprehensive and covers the vast majority of scenarios people would want to track HRV status for, while also resisting the temptation to be too focused on HRV values.
Of course, as you can see, there are still quirks to be found. Some of it is persistent Garmin quirks – after all, I’m still managing to rock Unproductive Training Status despite having virtually every indicator in the green. And while the running power implementation is appreciated, it does fall short of what many were hoping for in terms of not requiring any external sensor. While running power purists can have endless debates about which manufacturer’s running power algorithm is more accurate, the reality is that there is no agreed-upon standard to measure them by – and at the same time, all of them do a relatively good job of being consistent to themselves. Which at the moment, is all we can hope for.
Ultimately, after 6 months of ever-increasing pricey Garmin product launches in 2022, it’s nice to see not only the Forerunner 955 be priced reasonably, but also the new Forerunner 255 nail the price point with a $349 full-blown multisport watch, complete with multi-band GPS and plenty more. As to whether or not to splurge on Solar? Well, the reality is that it’s not giving you a ton of power in most scenarios, but, if your longest efforts are spent under the bright and prolonged sun, then it can be considerable in the right conditions. You’ve just got to decide whether those conditions apply to you.
With that, thanks for reading!
Found This Post Useful? Support The Site!
Hopefully you found this review useful. At the end of the day, I’m an athlete just like you looking for the most detail possible on a new purchase – so my review is written from the standpoint of how I used the device. The reviews generally take a lot of hours to put together, so it’s a fair bit of work (and labor of love). As you probably noticed by looking below, I also take time to answer all the questions posted in the comments – and there’s quite a bit of detail in there as well.
If you're shopping for the Garmin Forerunner 955 Solar or any other accessory items, please consider using the affiliate links below! As an Amazon Associate I earn from qualifying purchases. It doesn’t cost you anything extra, but your purchases help support this website a lot. Even more, if you shop with TPC (The Pro's Closet), you'll save $40 on purchases over $200 with coupon code DCRAIN40! The Pro's Closet has been a long-time partner of the site here - including sponsoring videos like my cargo bike race, as well as just being an awesome Colorado-based company full of good humans. Check them out with the links below and the DCRAIN40 coupon!
And finally, here’s a handy list of accessories that work well with this unit (and some that I showed in the review). Given the unit pairs with ANT+ & Bluetooth Smart sensors, you can use just about anything though.
This is a dual ANT+/Bluetooth Smart cycling cadence sensor that you strap to your crank arm, but also does dual Bluetooth Smart, so you can pair it both to Zwift and another Bluetooth Smart app at once if you want.
This is one of the top straps I use daily for accuracy comparisons (the others being the Polar H9/H10). It's dual ANT+/Bluetooth Smart, and in fact dual-Bluetooth Smart too, in case you need multiple connectons.
Seriously, this will change your life. $9 for a two-pack of these puck Garmin chargers that stay put and stay connected. One for the office, one for your bedside, another for your bag, and one for your dog's house. Just in case.
This speed sensor is unique in that it can record offline (sans-watch), making it perfect for a commuter bike quietly recording your rides. But it's also a standard ANT+/BLE sensor that pairs to your device. It's become my go-to speed sensor.
This wifi-connected scale will track your weight and related metrics both on the scale display and in Garmin Connect (plus 3rd party apps like TrainingPeaks). It'll also then sync your weight to your watch/bike computer, to ensure accurate calorie data.
The HRM-PRO Plus is Garmin's top-end chest strap. It transmits dual ANT+/Bluetooth Smart, but also transmits Running Dynamics & Running Pace/Distance metrics, stores HR data during a swim, and can be used without a watch for other sports. Also, it can transmit XC Skiing Dynamics as well.
And of course – you can always sign-up to be a DCR Supporter! That gets you an ad-free DCR, access to the DCR Quarantine Corner video series packed with behind the scenes tidbits...and it also makes you awesome. And being awesome is what it’s all about!
Thanks for reading! And as always, feel free to post comments or questions in the comments section below, I’ll be happy to try and answer them as quickly as possible. And lastly, if you felt this review was useful – I always appreciate feedback in the comments below. Thanks!
I swim, bike and run. Then, I come here and write about my adventures. It’s as simple as that. Most of the time. If you’re new around these parts, here’s the long version of my story.
You'll support the site, and get ad-free DCR! Plus, you'll be more awesome. Click above for all the details. Oh, and you can sign-up for the newsletter here!
Here’s how to save!
Wanna save some cash and support the site? These companies help support the site! With Backcountry.com or Competitive Cyclist with either the coupon code DCRAINMAKER for first time users saving 15% on applicable products.
You can also pick-up tons of gear at REI via these links, which is a long-time supporter as well:
With TPC (The Pro's Closet), you'll save $40 on purchases over $200 with coupon code DCRAIN40 for tech and non-tech purchases!
Alternatively, for everything else on the planet, simply buy your goods from Amazon via the link below and I get a tiny bit back as an Amazon Associate. No cost to you, easy as pie!
You can use the above link for any Amazon country and it (should) automatically redirect to your local Amazon site.
Want to compare the features of each product, down to the nitty-gritty? No problem, the product comparison data is constantly updated with new products and new features added to old products!
Wanna create comparison chart graphs just like I do for GPS, heart rate, power meters and more? No problem, here's the platform I use - you can too!
Think my written reviews are deep? You should check out my videos. I take things to a whole new level of interactive depth!
Smart Trainers Buyers Guide: Looking at a smart trainer this winter? I cover all the units to buy (and avoid) for indoor training. The good, the bad, and the ugly.
Check out
my weekly podcast - with DesFit, which is packed with both gadget and non-gadget goodness!
Get all your awesome DC Rainmaker gear here!
FAQ’s
I have built an extensive list of my most frequently asked questions. Below are the most popular.
You probably stumbled upon here looking for a review of a sports gadget. If you’re trying to decide which unit to buy – check out my in-depth reviews section. Some reviews are over 60 pages long when printed out, with hundreds of photos! I aim to leave no stone unturned.
I travel a fair bit, both for work and for fun. Here’s a bunch of random trip reports and daily trip-logs that I’ve put together and posted. I’ve sorted it all by world geography, in an attempt to make it easy to figure out where I’ve been.
The most common question I receive outside of the “what’s the best GPS watch for me” variant, are photography-esq based. So in efforts to combat the amount of emails I need to sort through on a daily basis, I’ve complied this “My Photography Gear” post for your curious minds! It’s a nice break from the day to day sports-tech talk, and I hope you get something out of it!
Many readers stumble into my website in search of information on the latest and greatest sports tech products. But at the end of the day, you might just be wondering “What does Ray use when not testing new products?”. So here is the most up to date list of products I like and fit the bill for me and my training needs best! DC Rainmaker 2023 swim, bike, run, and general gear list. But wait, are you a female and feel like these things might not apply to you? If that’s the case (but certainly not saying my choices aren’t good for women), and you just want to see a different gear junkies “picks”, check out The Girl’s Gear Guide too.


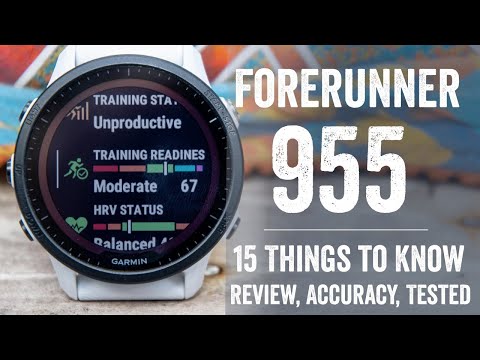


![clip_image001[6]](https://media.dcrainmaker.com/images/2022/06/clip_image0016.png "clip_image001[6]")


![clip_image001[11]](https://media.dcrainmaker.com/images/2022/06/clip_image00111.png "clip_image001[11]")
![clip_image001[13]](https://media.dcrainmaker.com/images/2022/06/clip_image00113.png "clip_image001[13]")
![clip_image001[15]](https://media.dcrainmaker.com/images/2022/06/clip_image00115.png "clip_image001[15]")
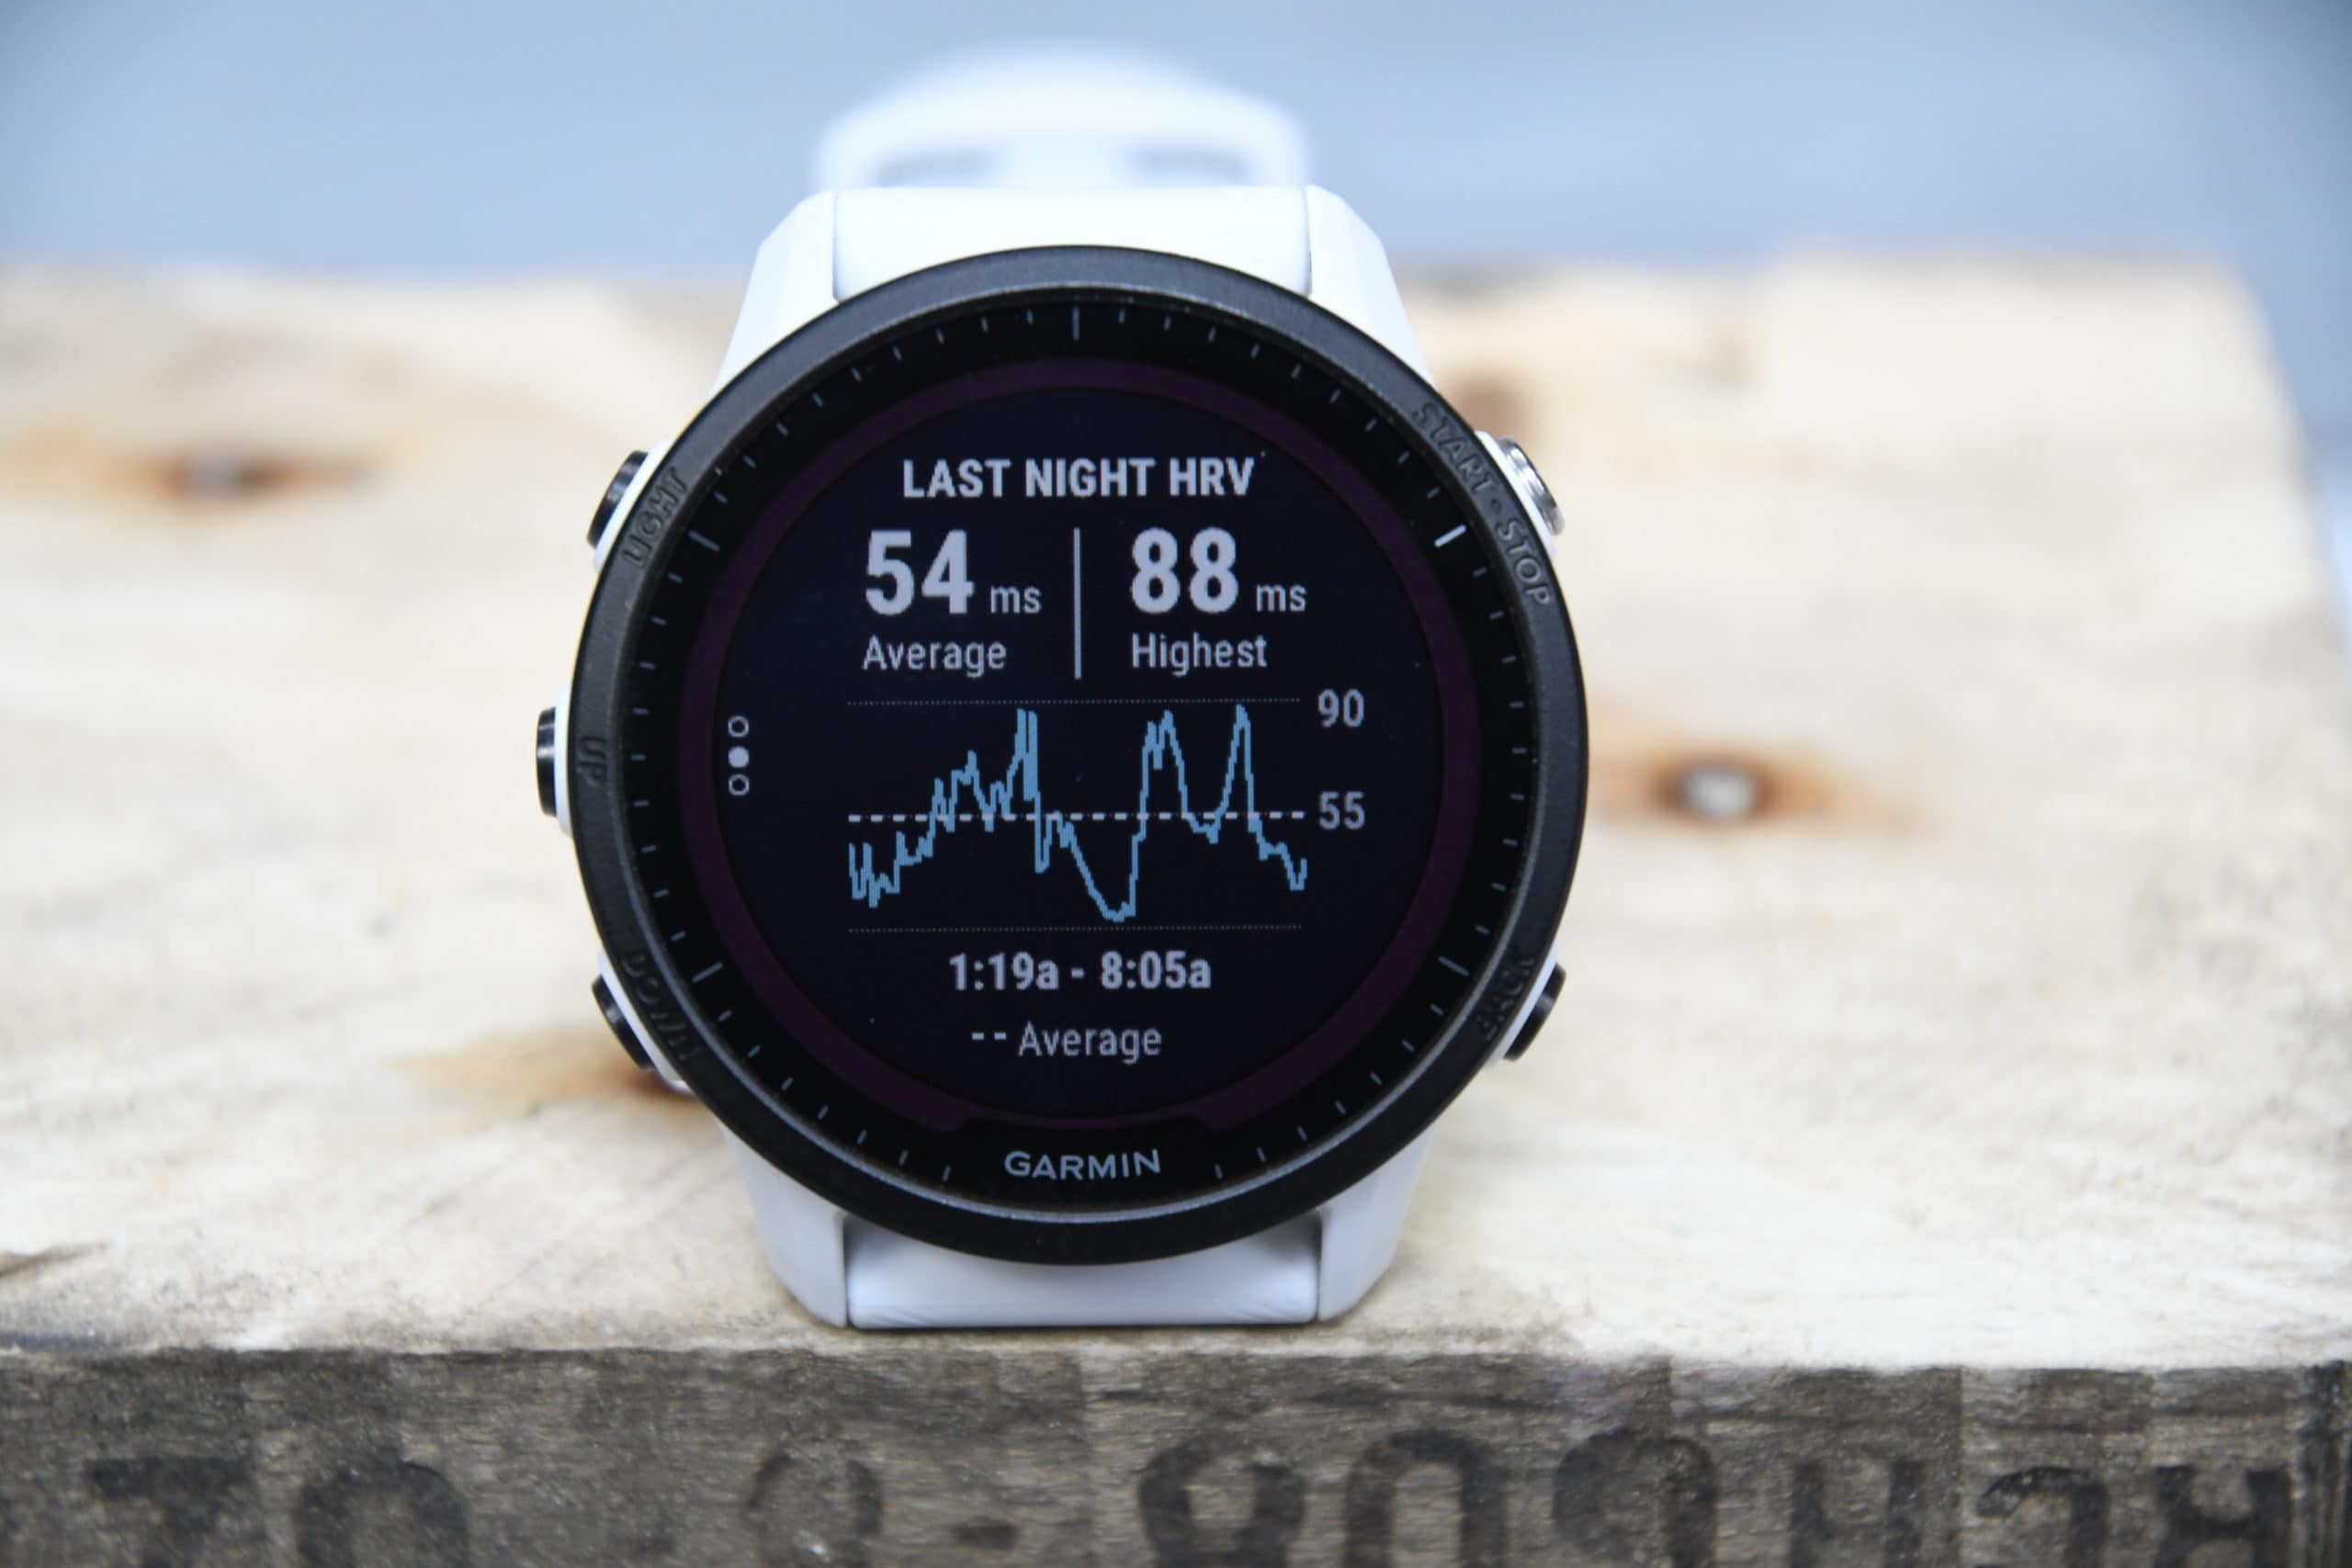

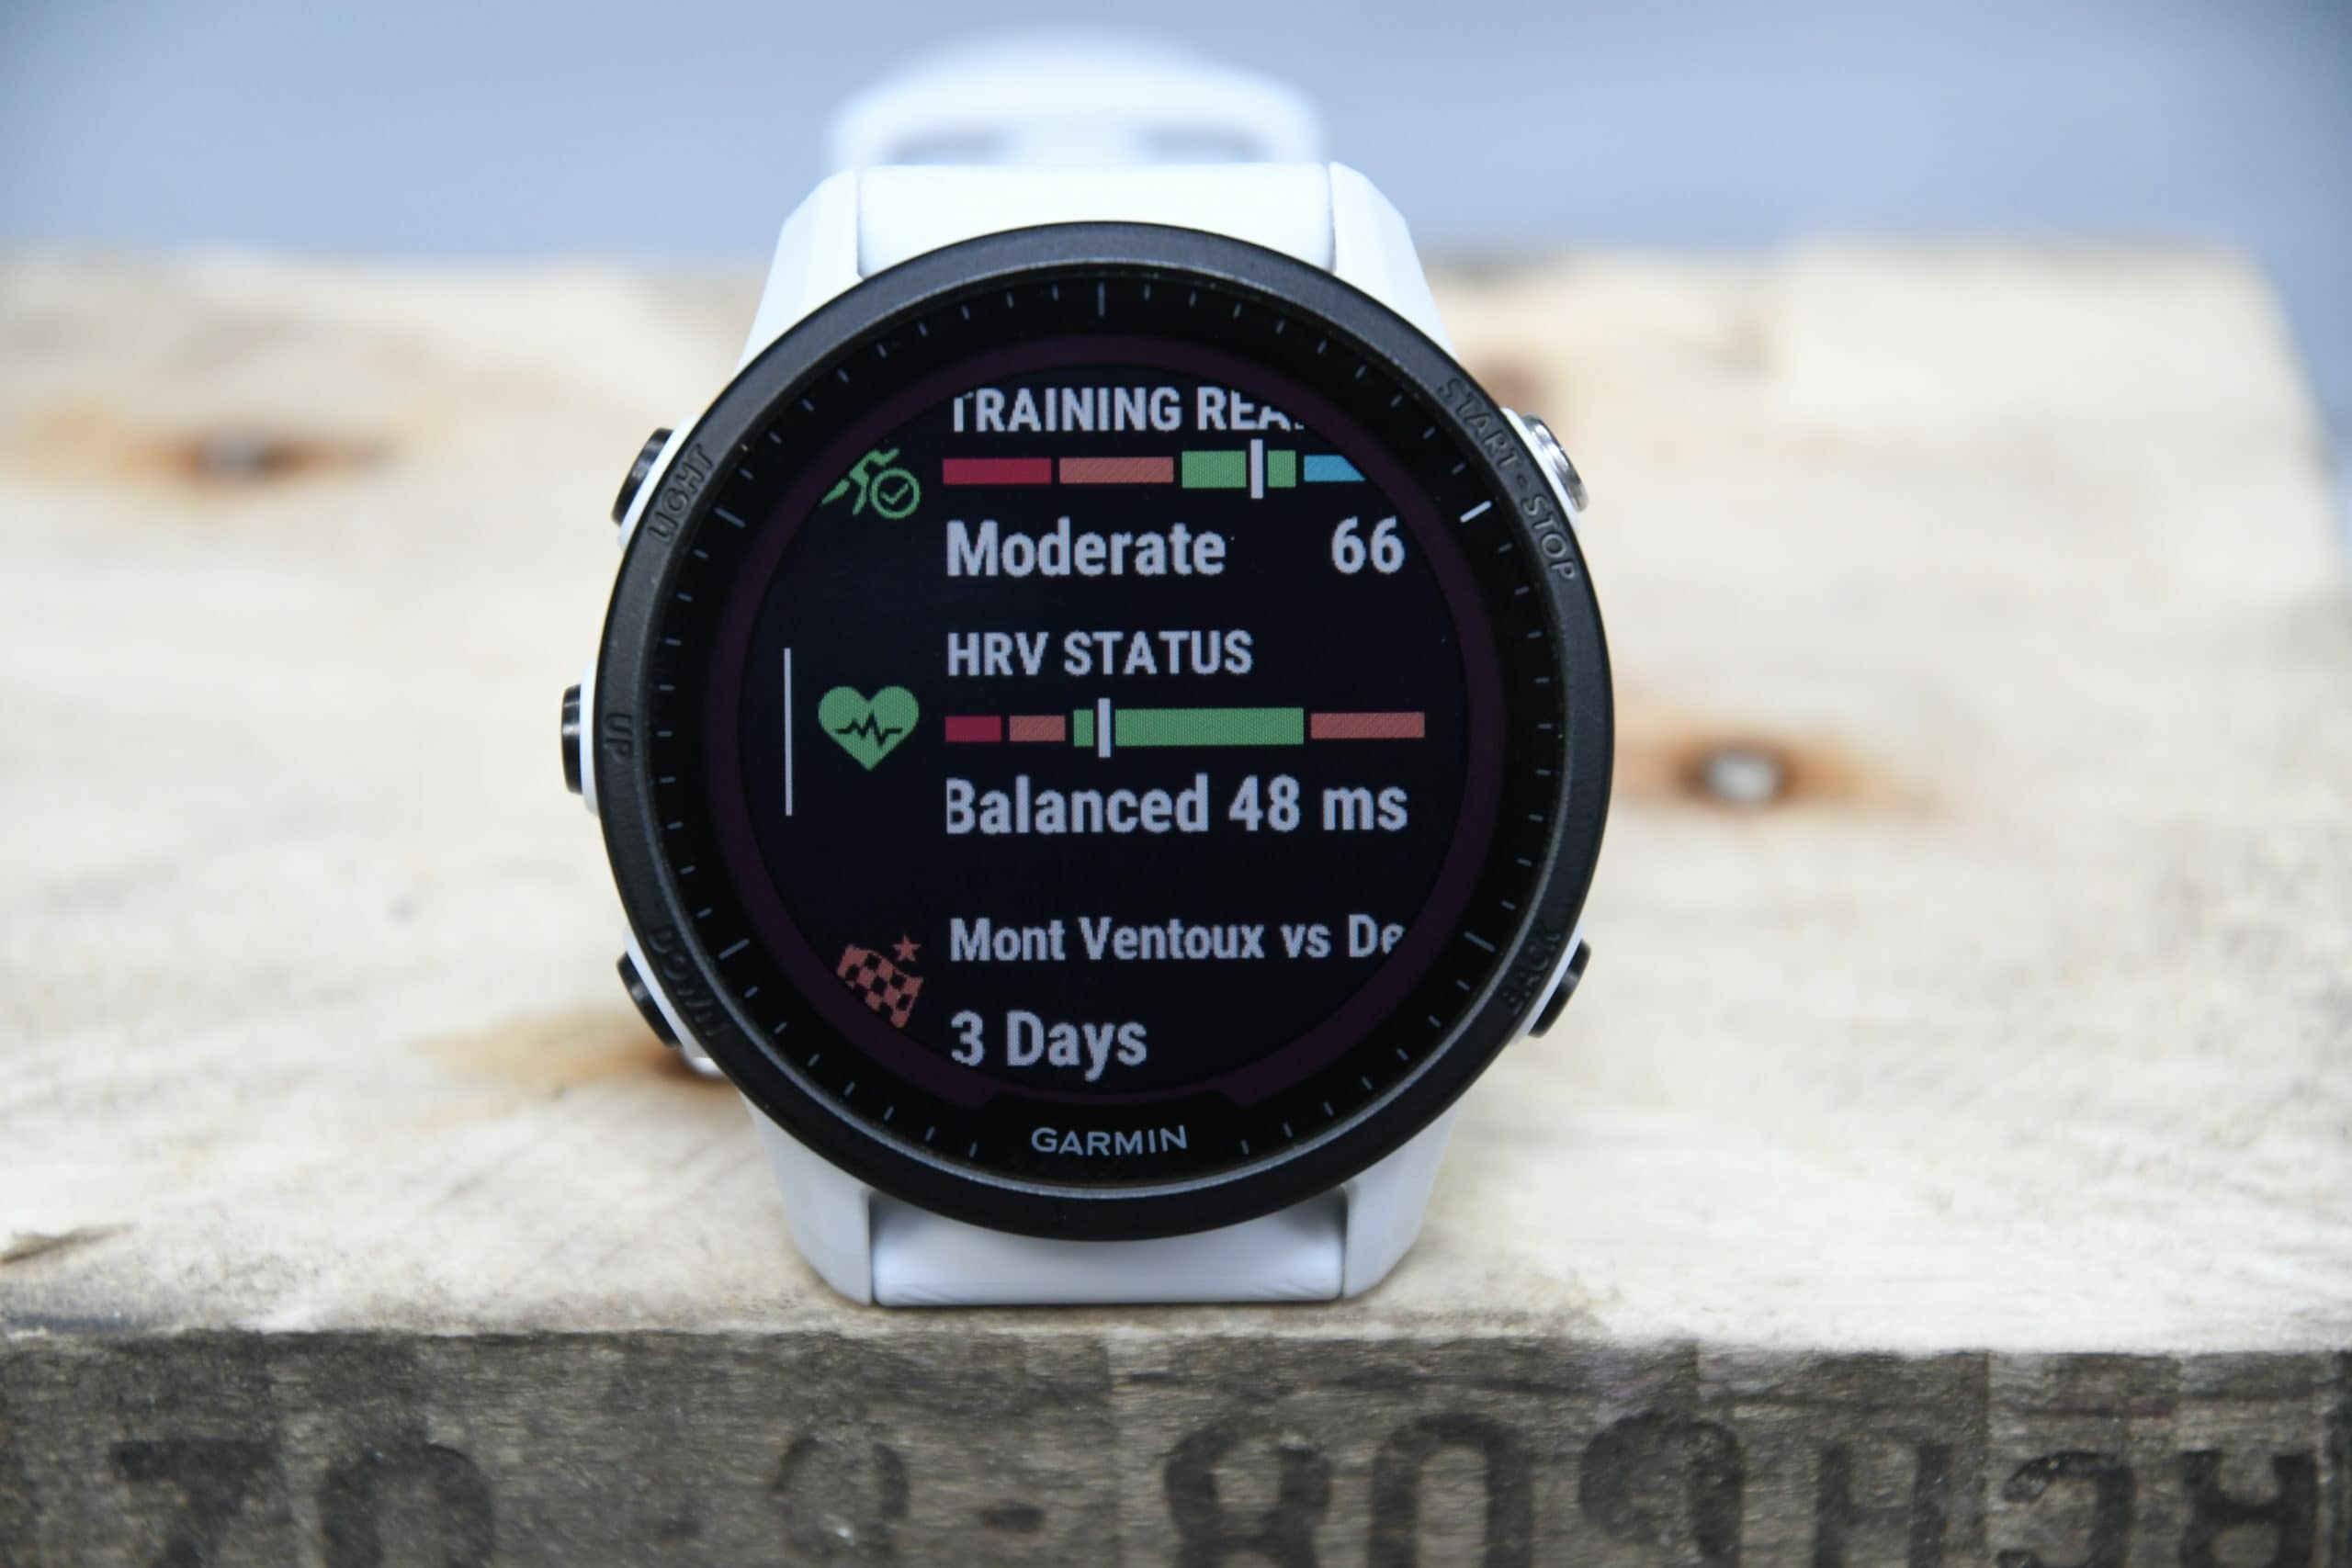
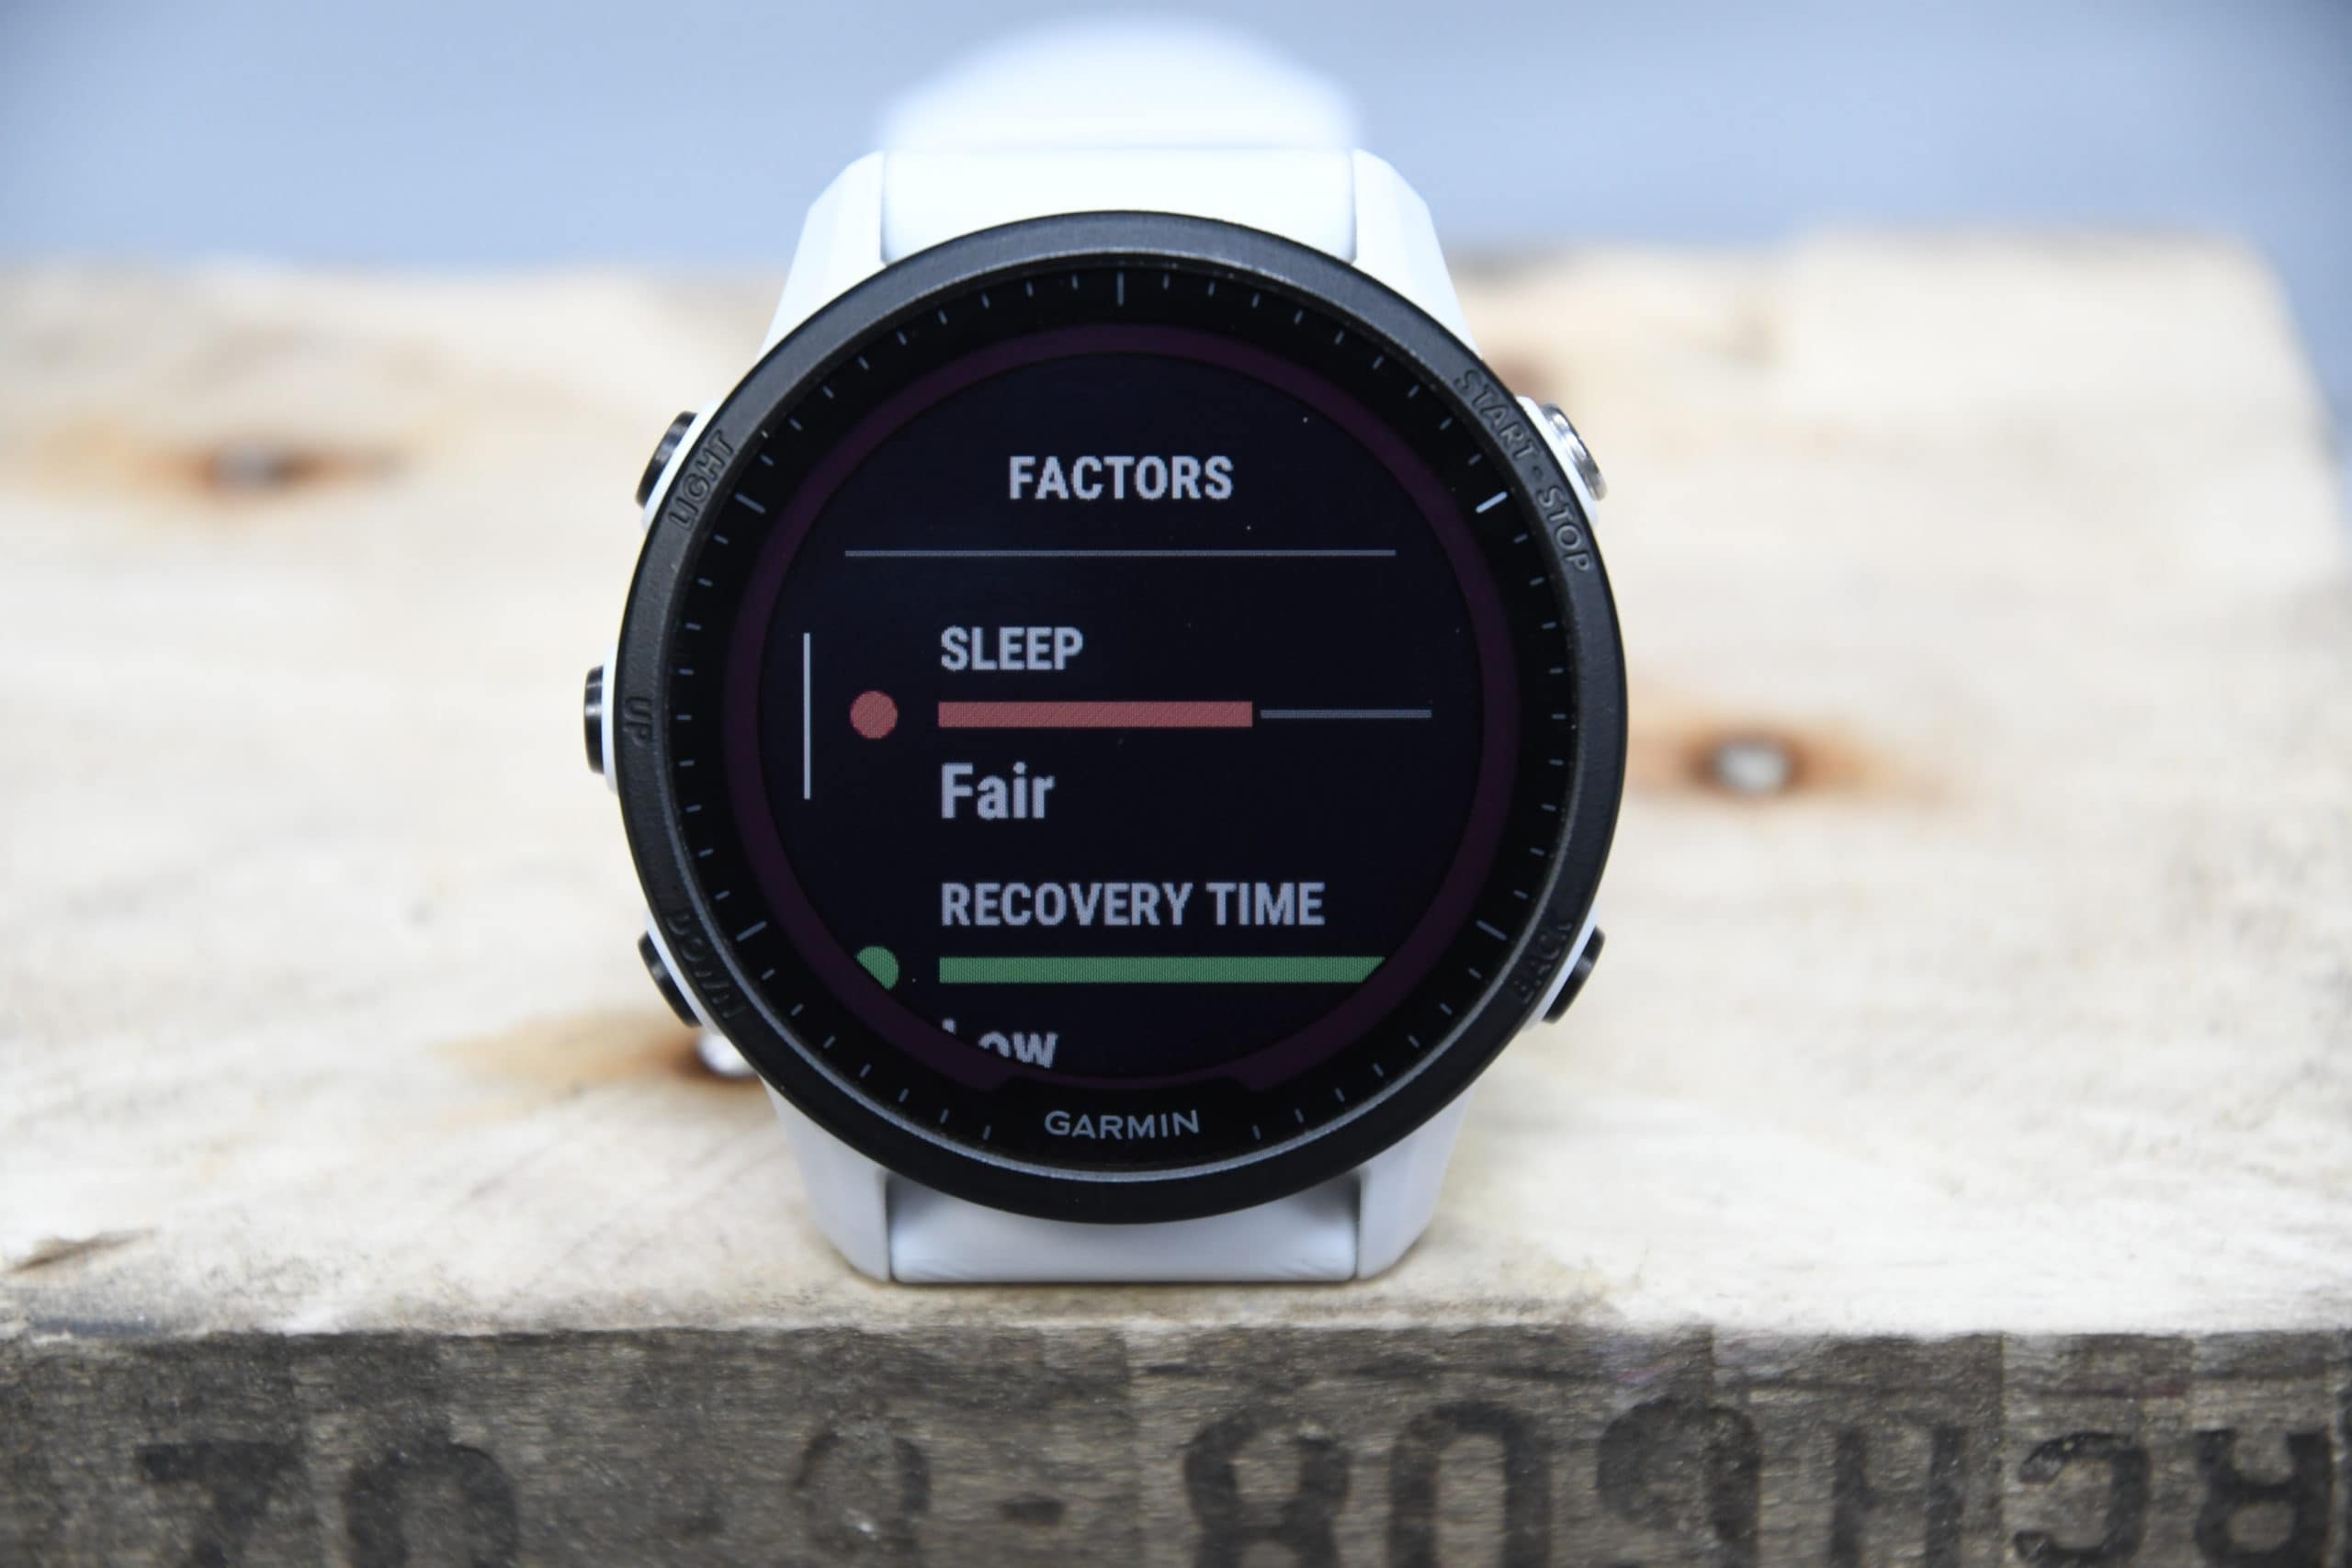

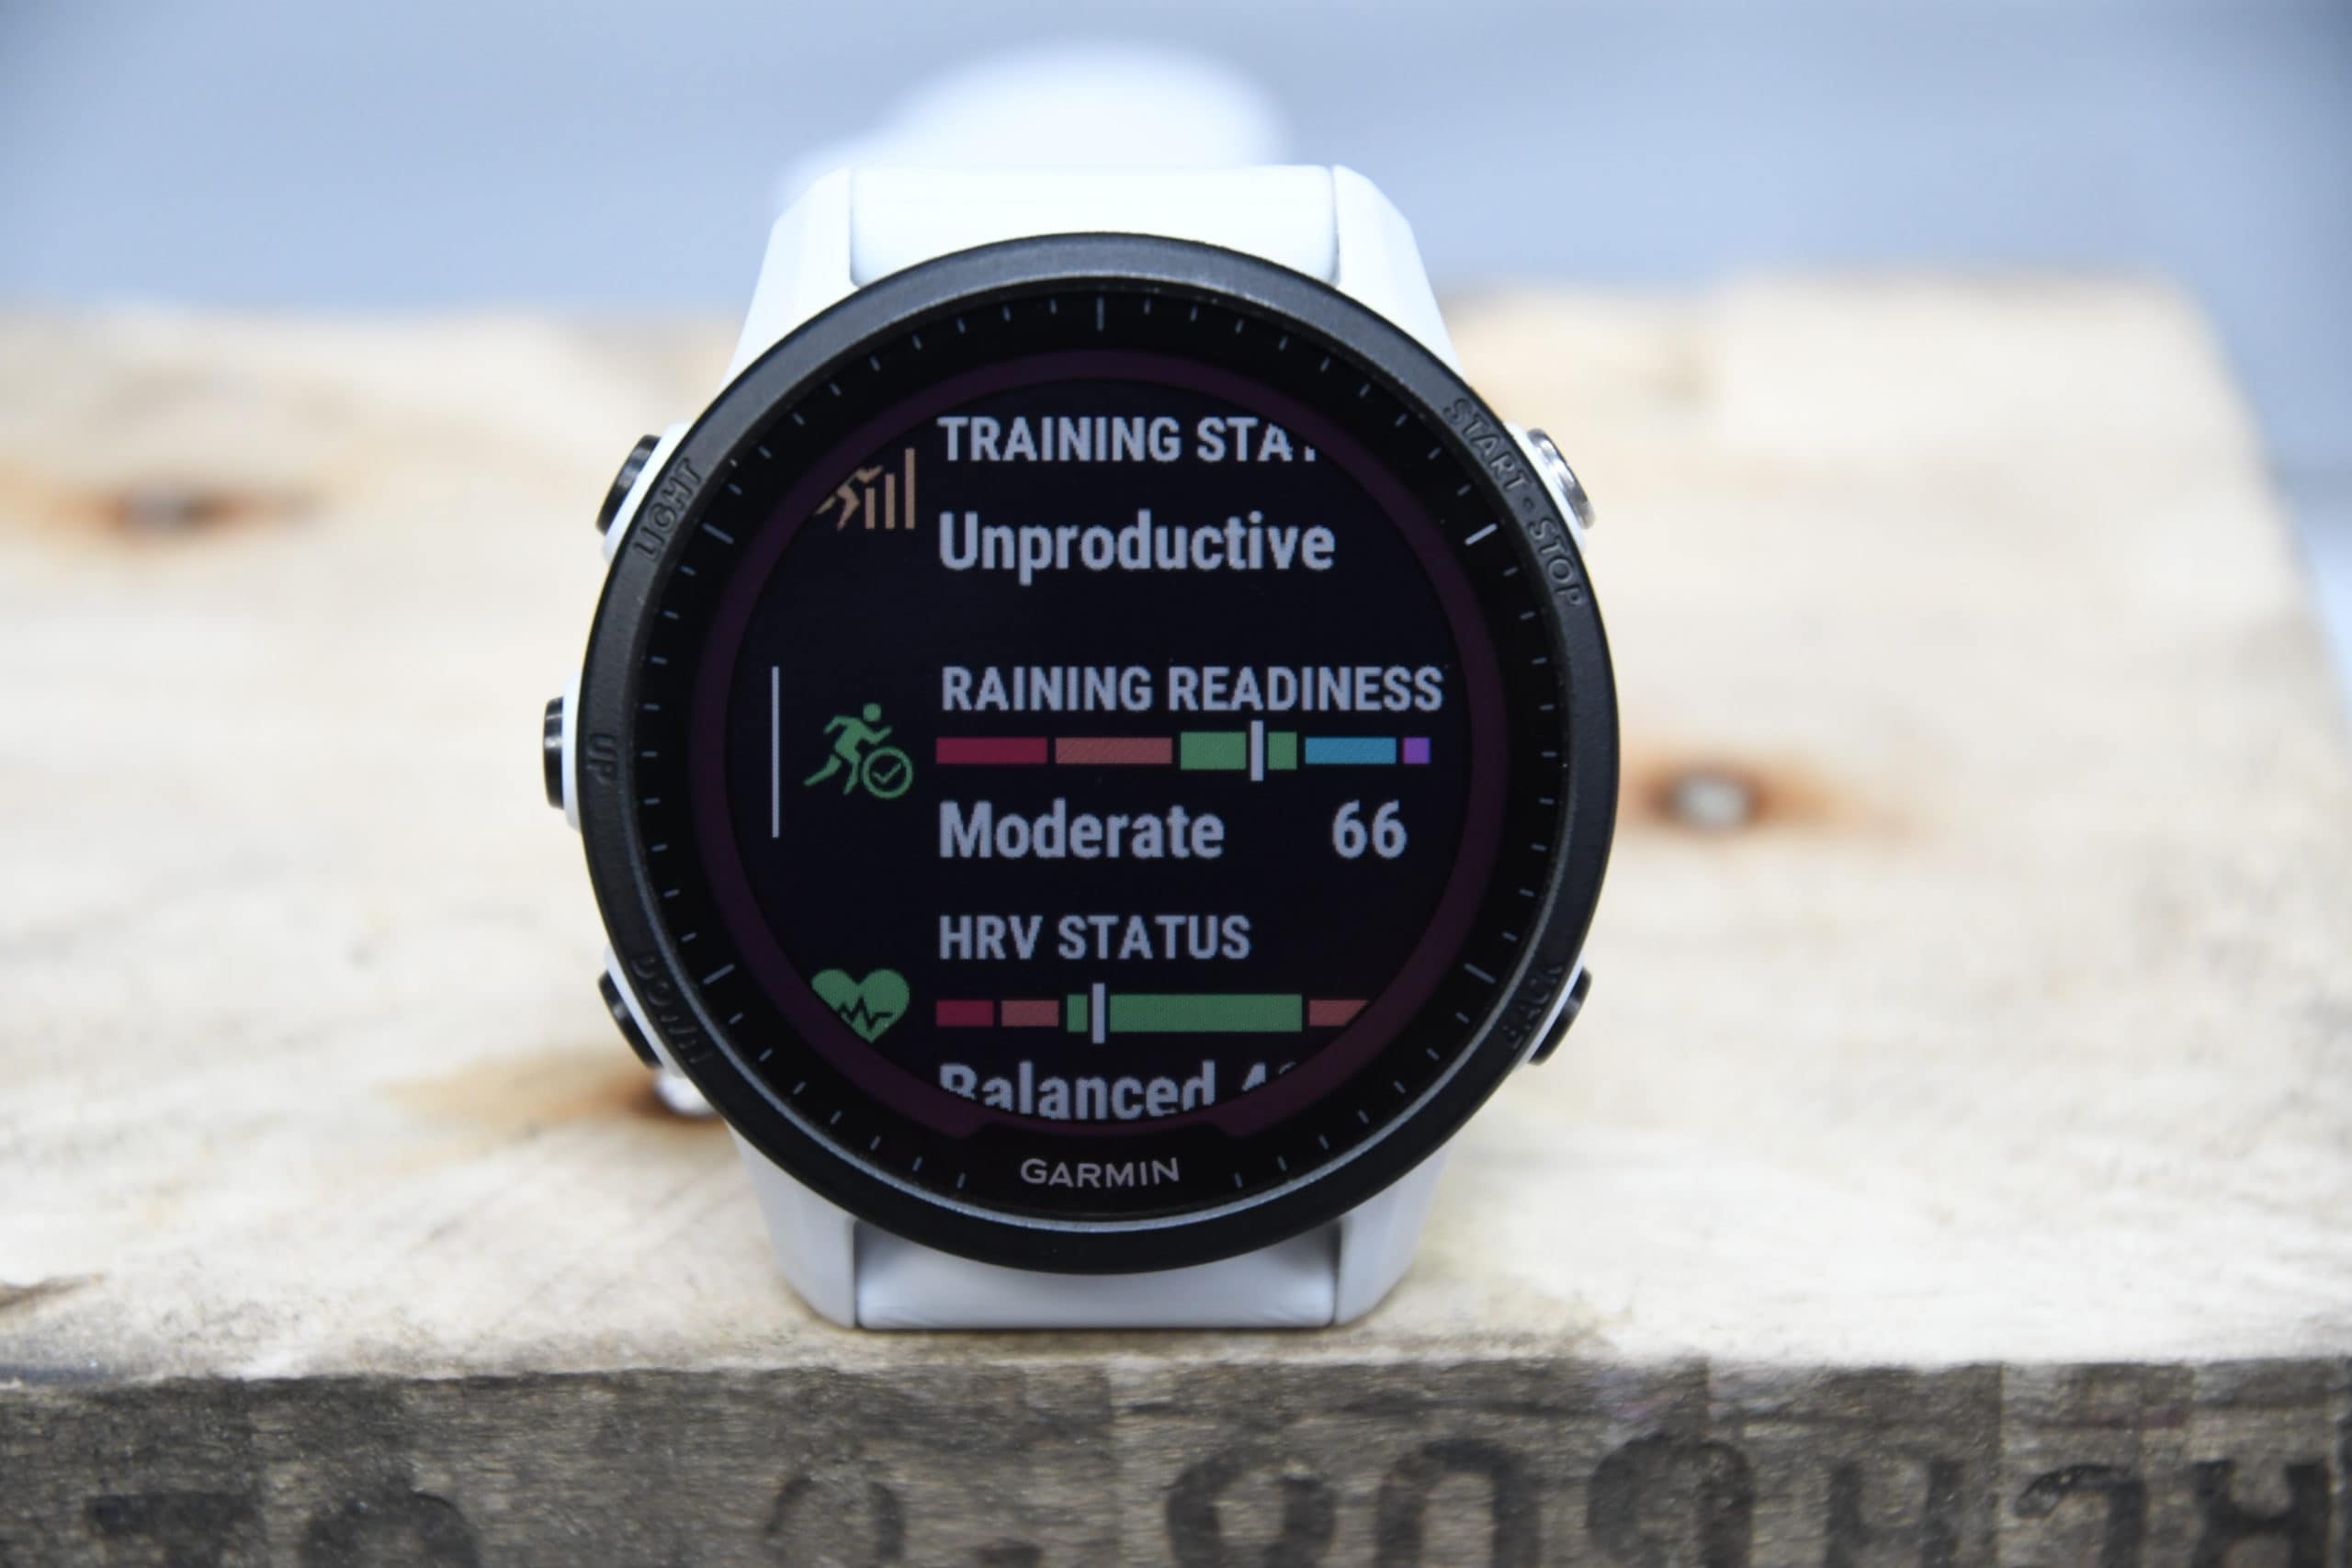


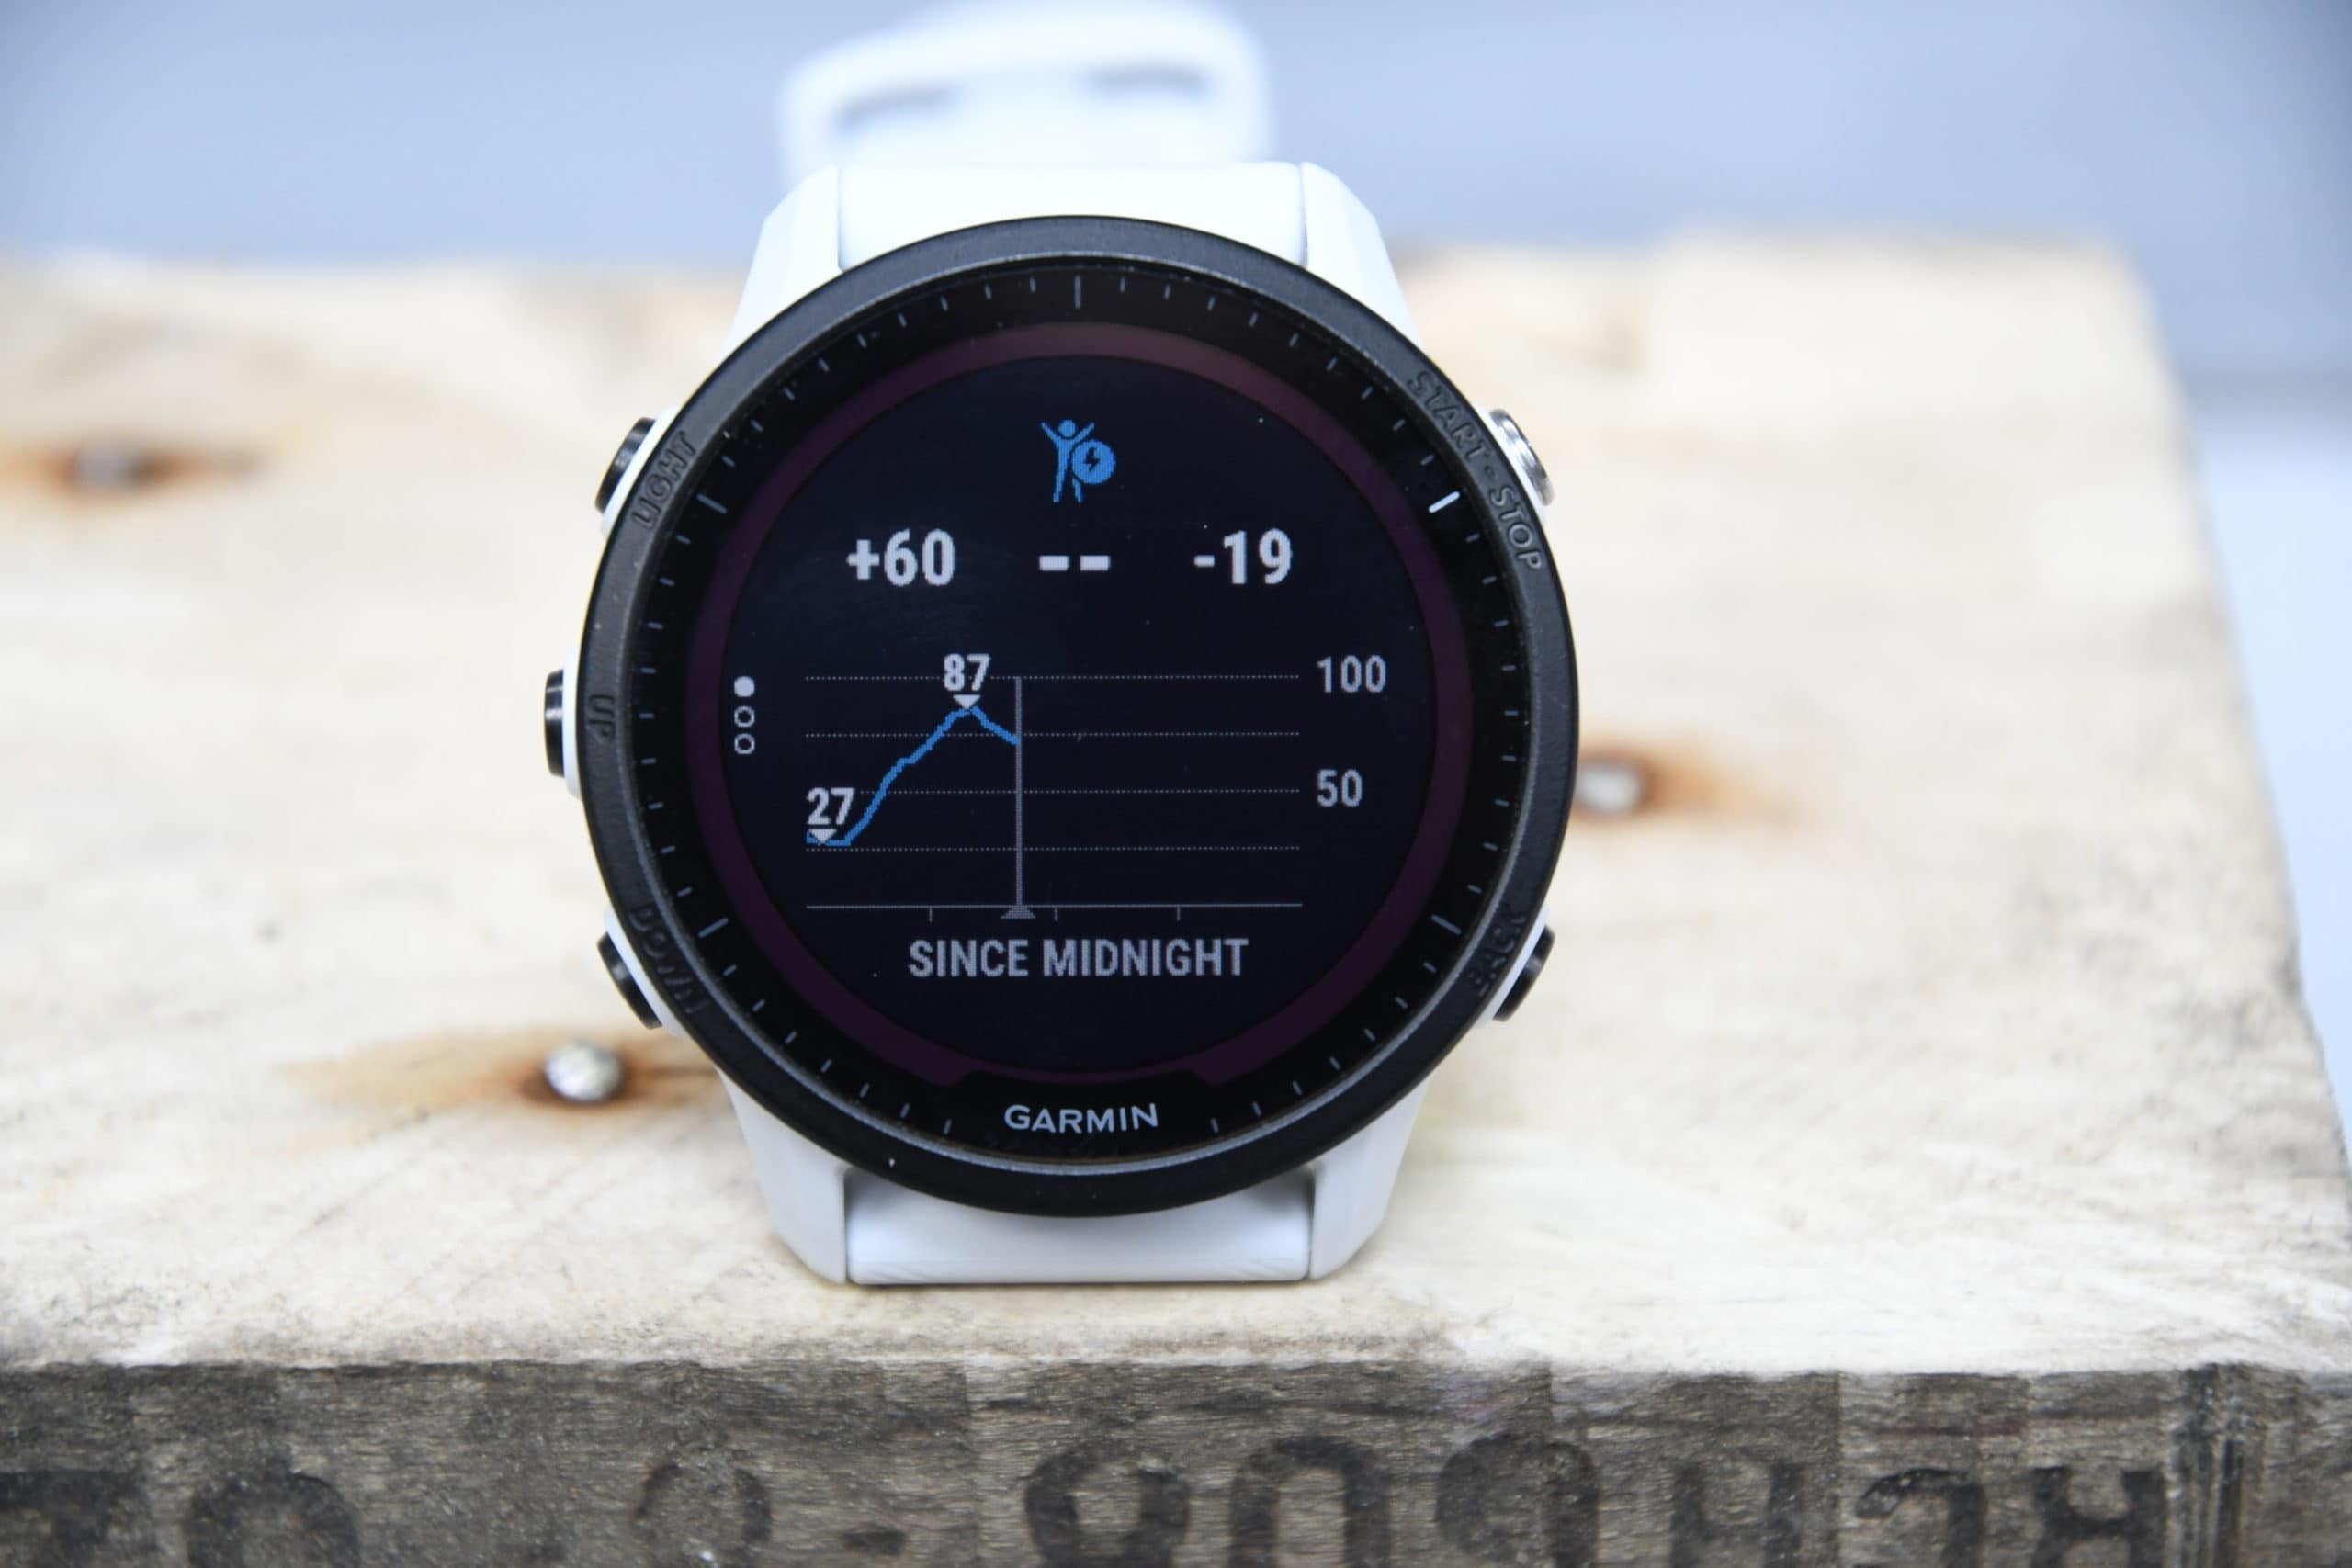
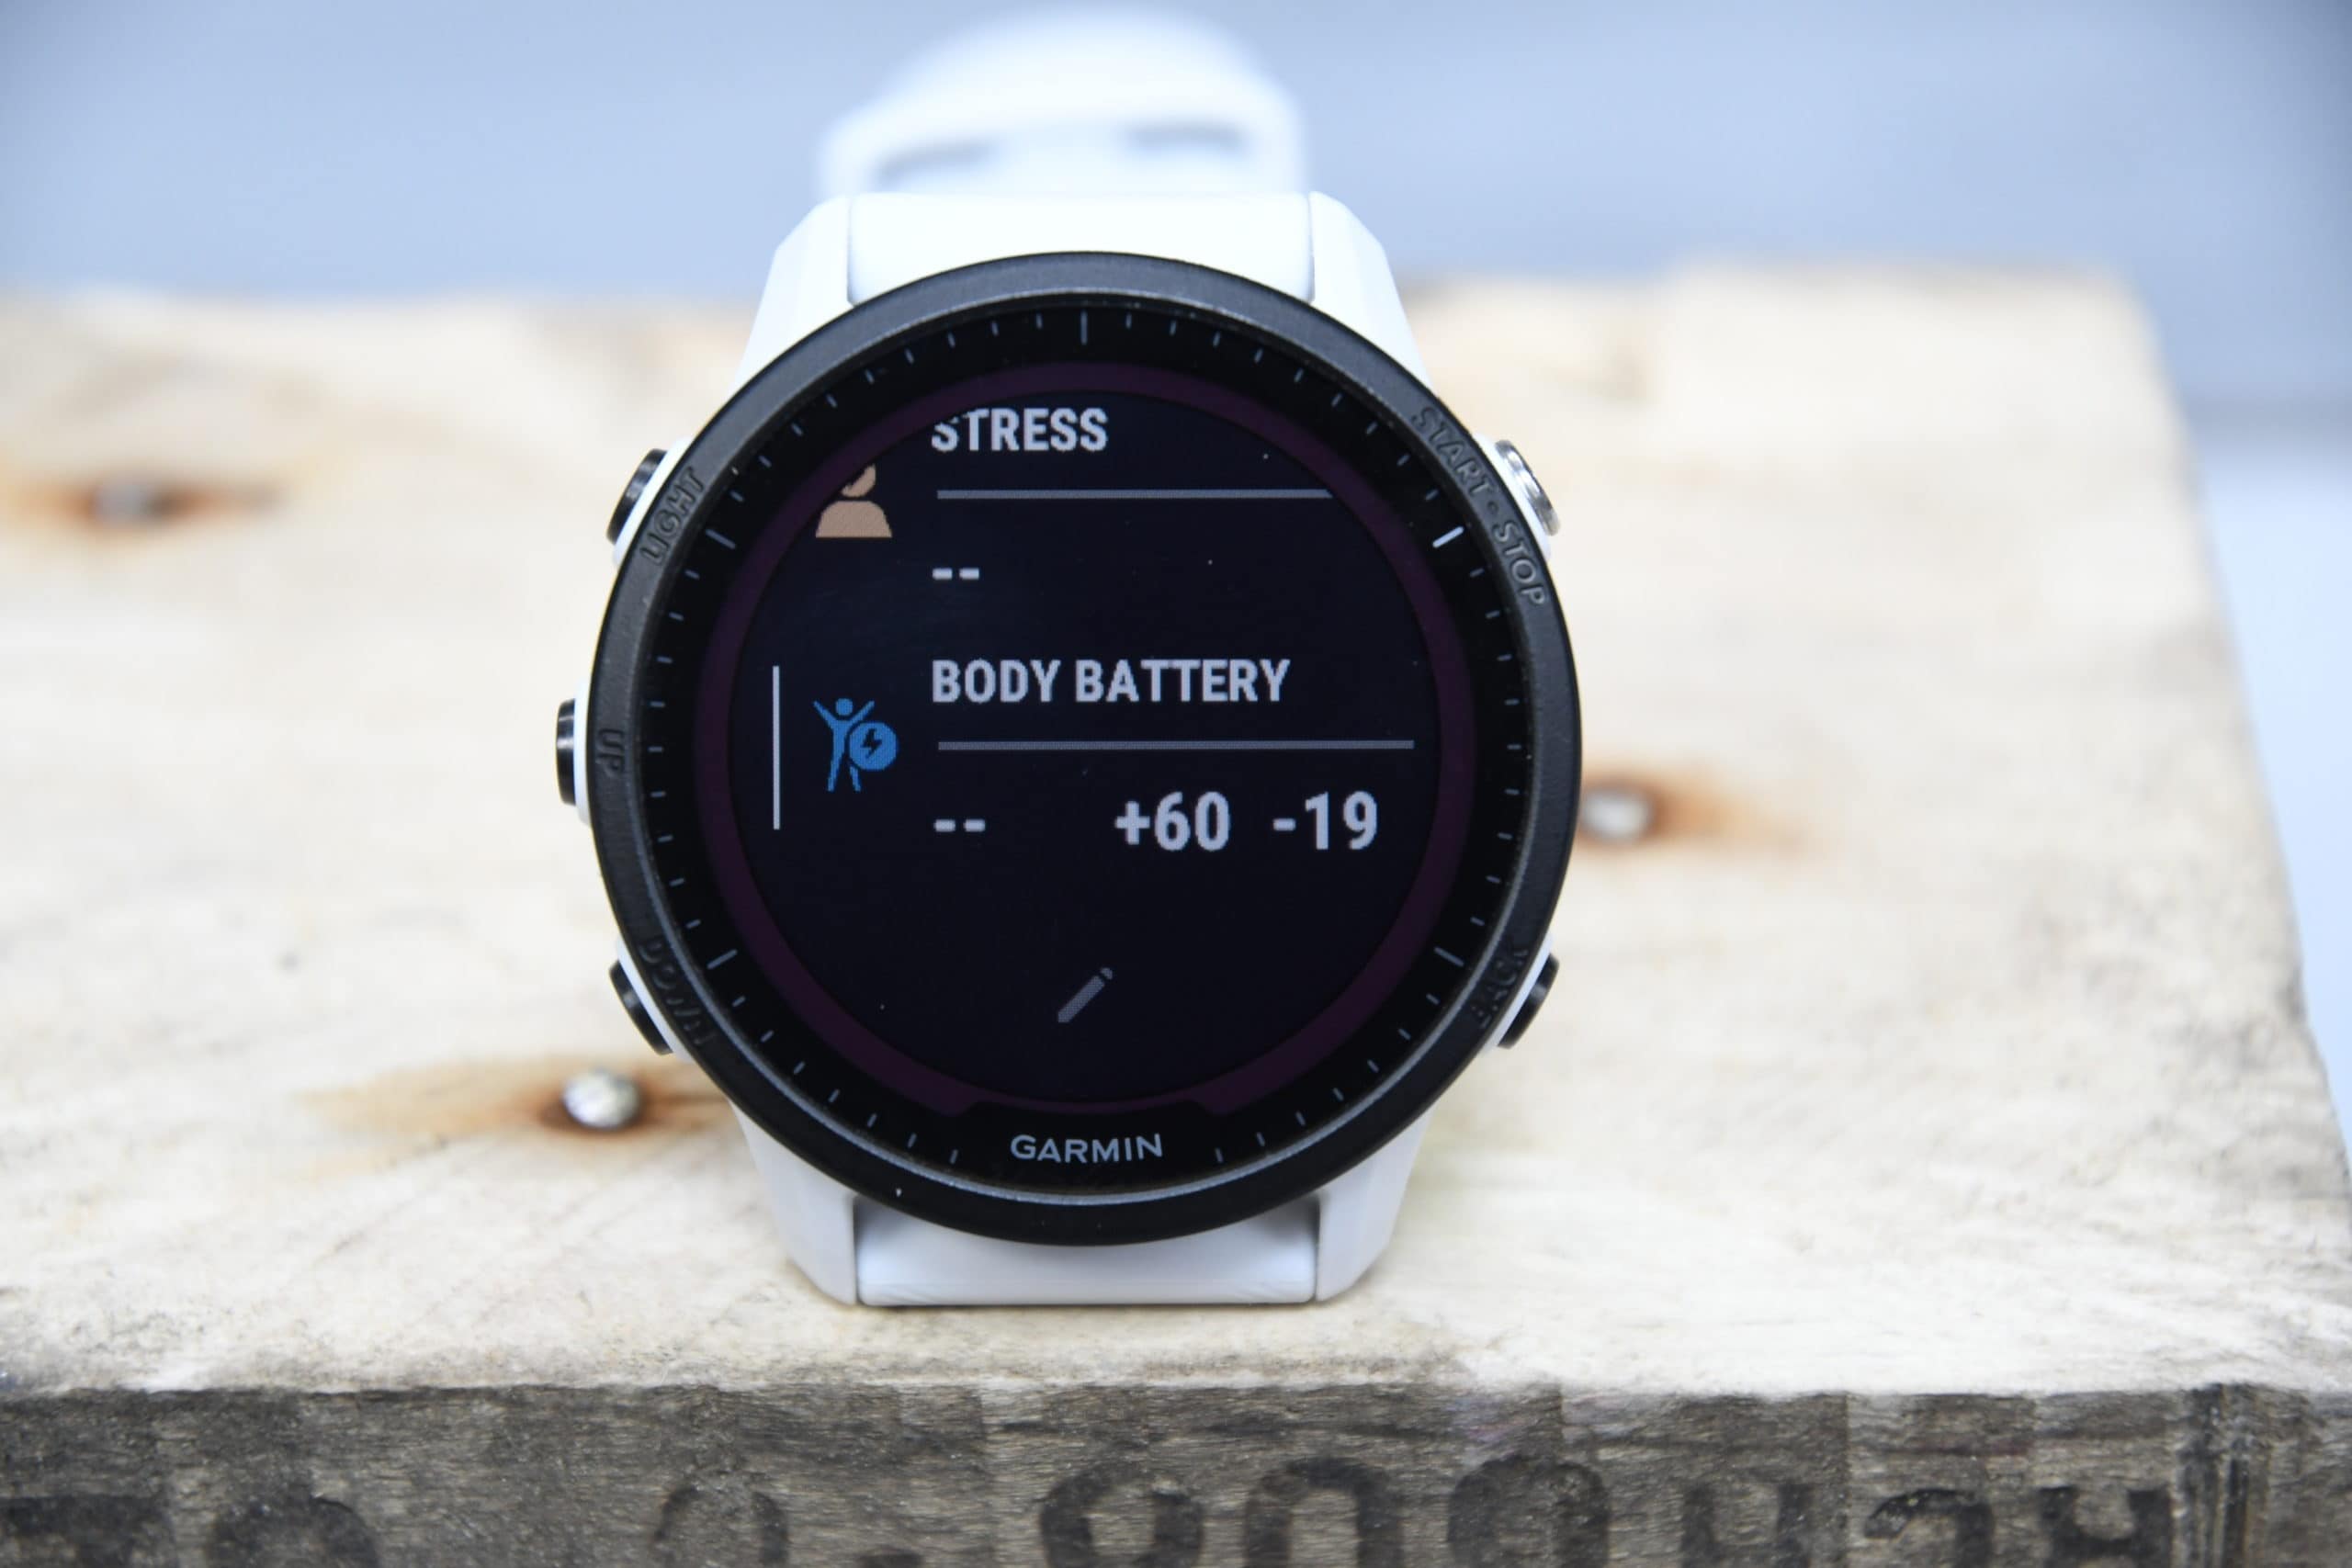

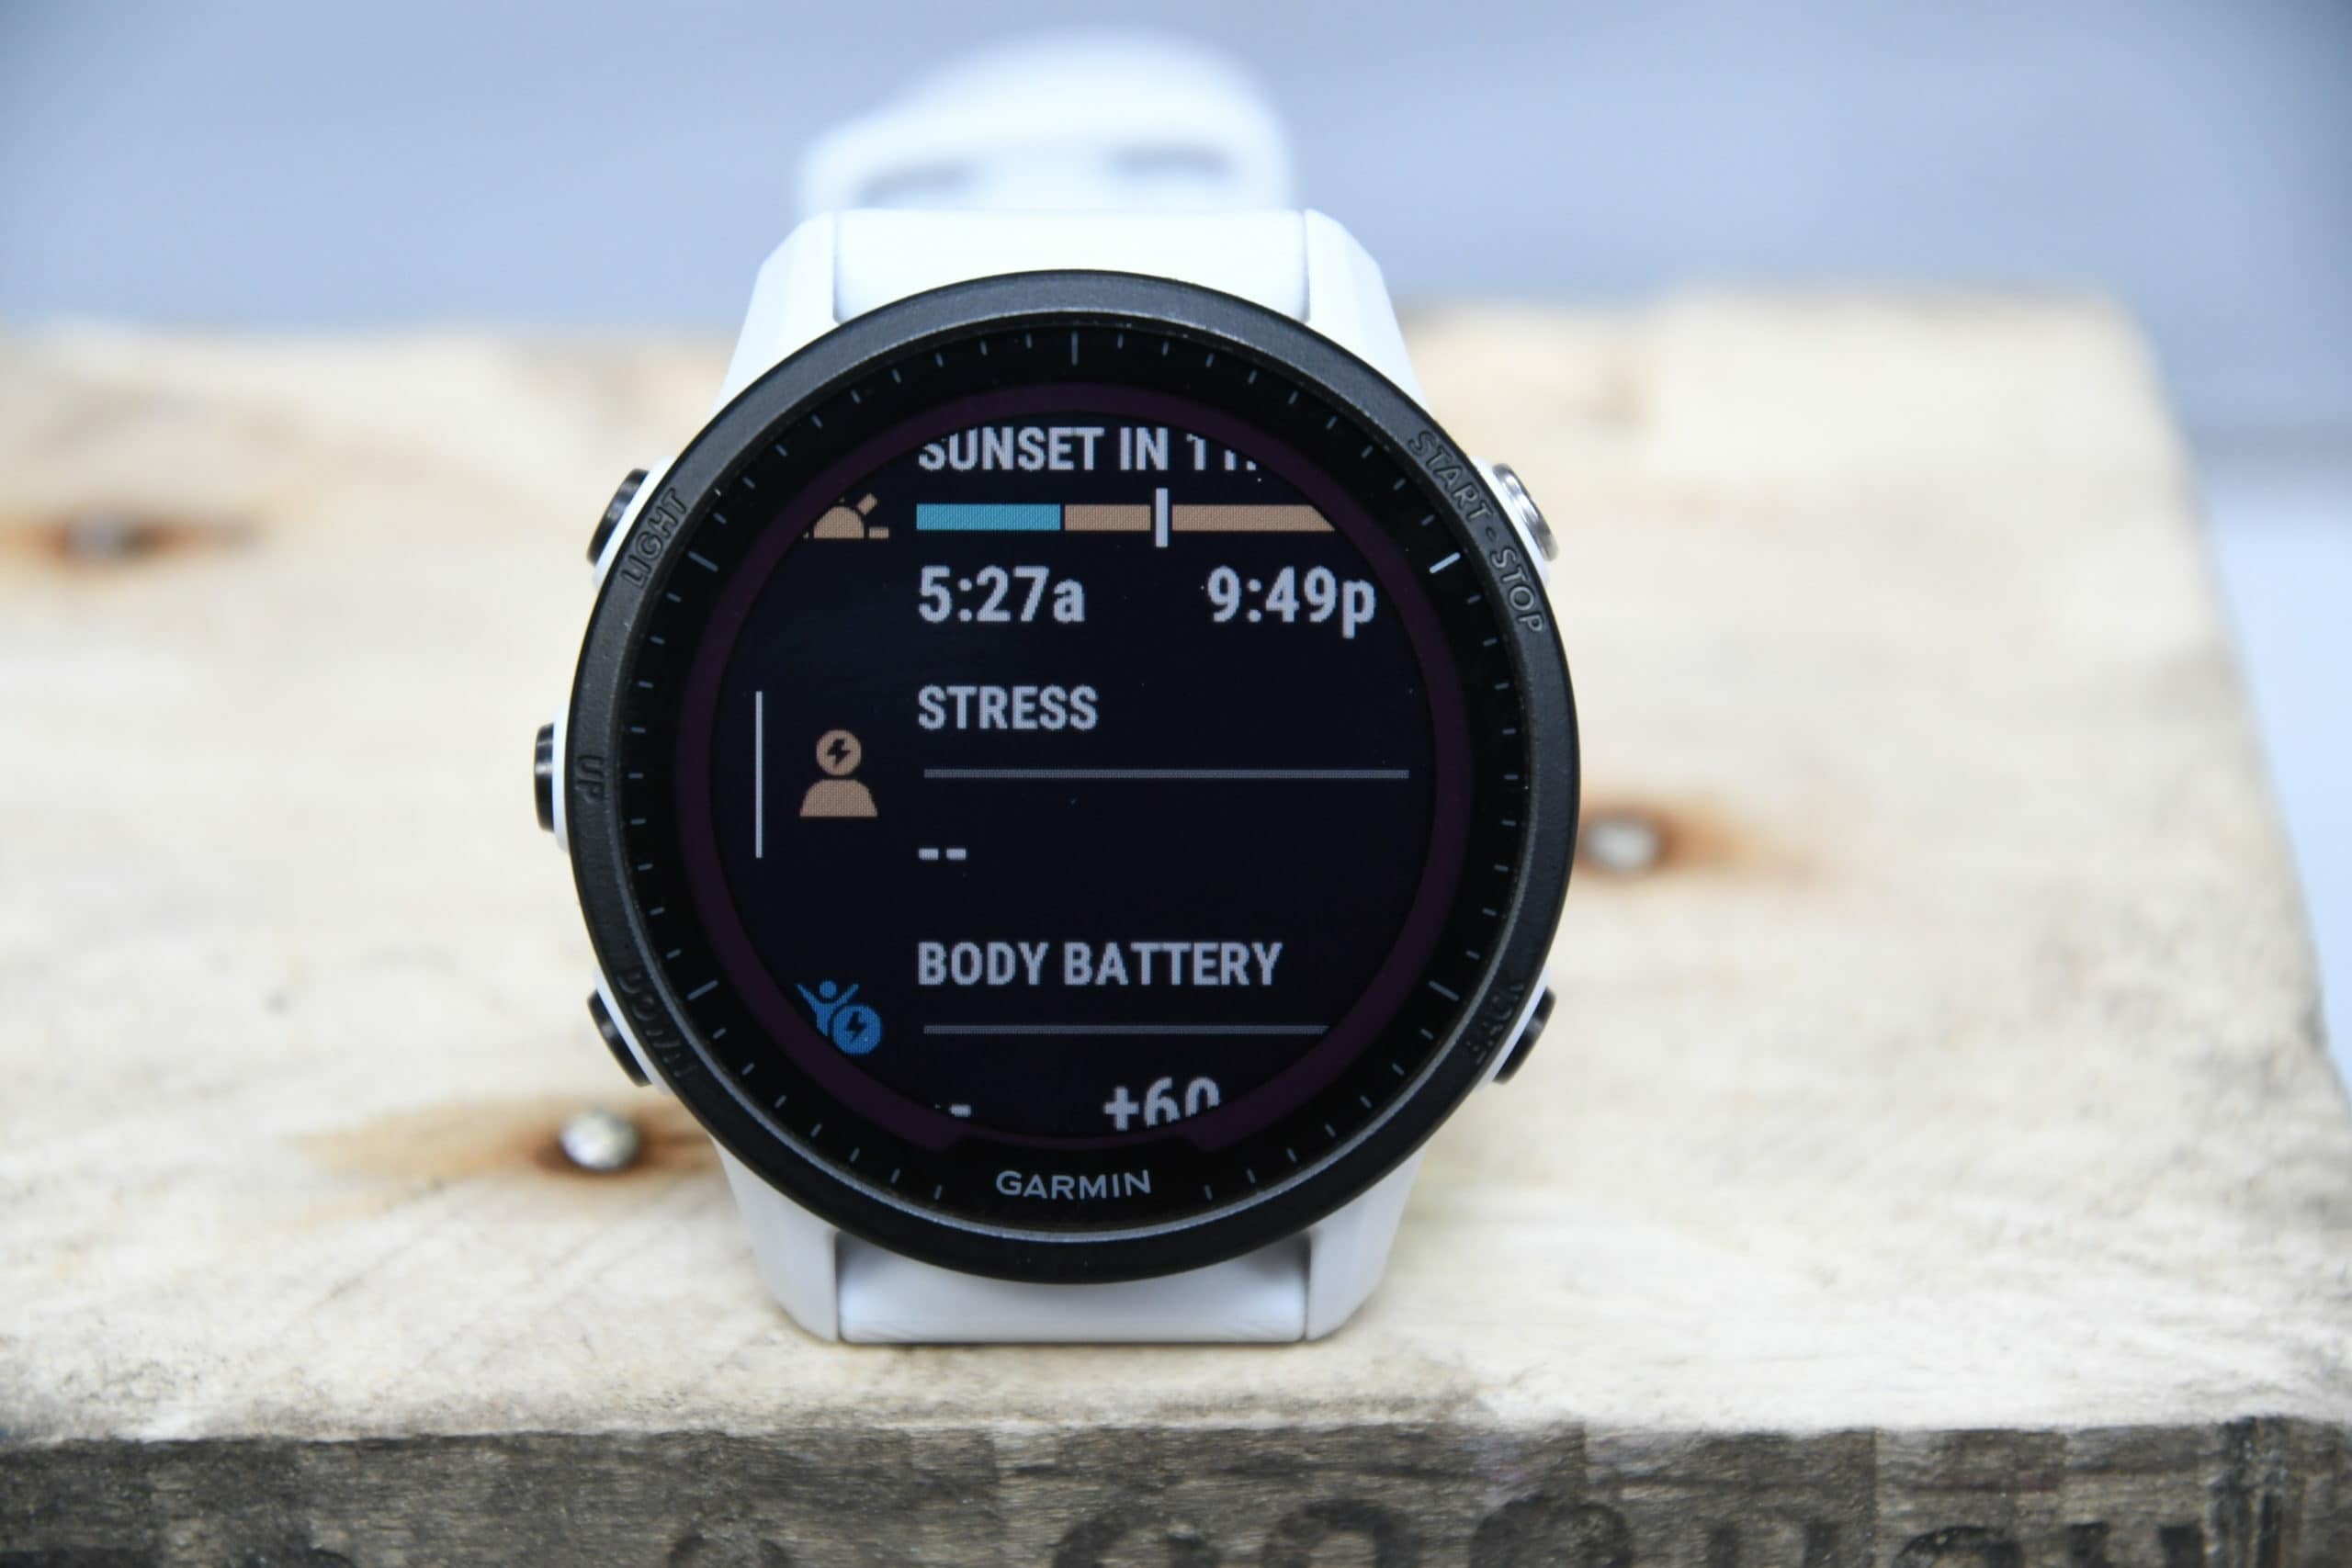
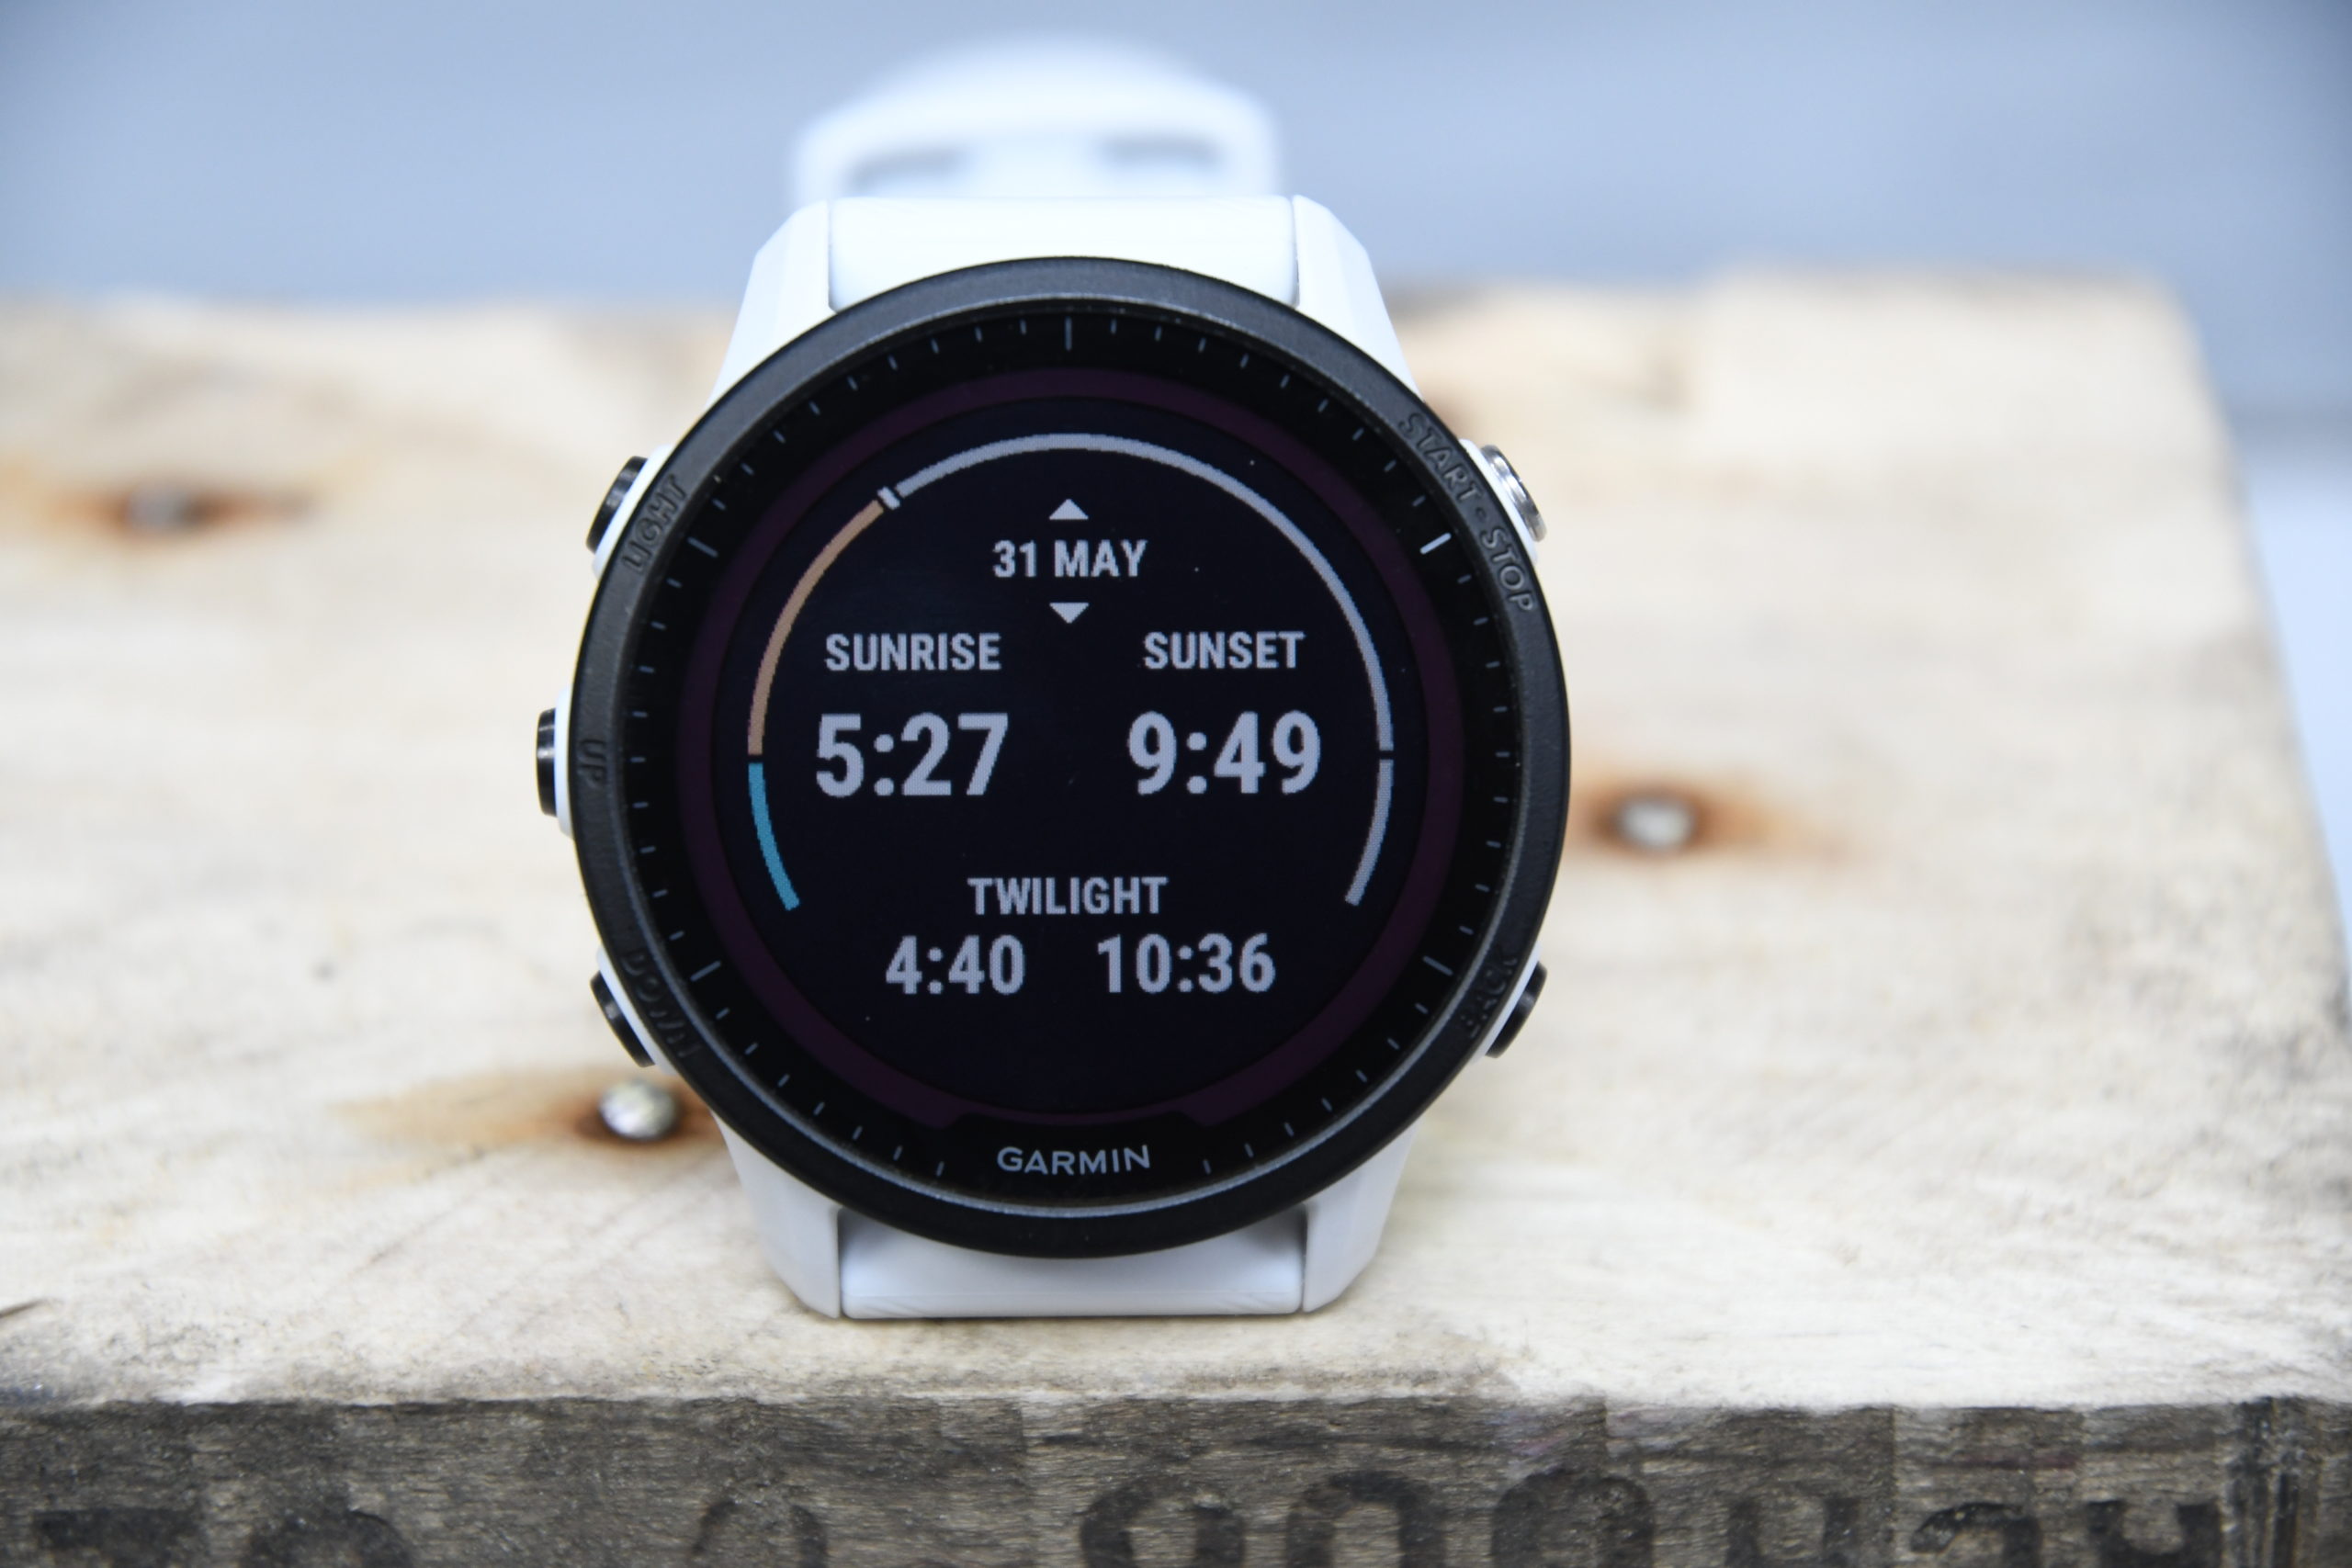

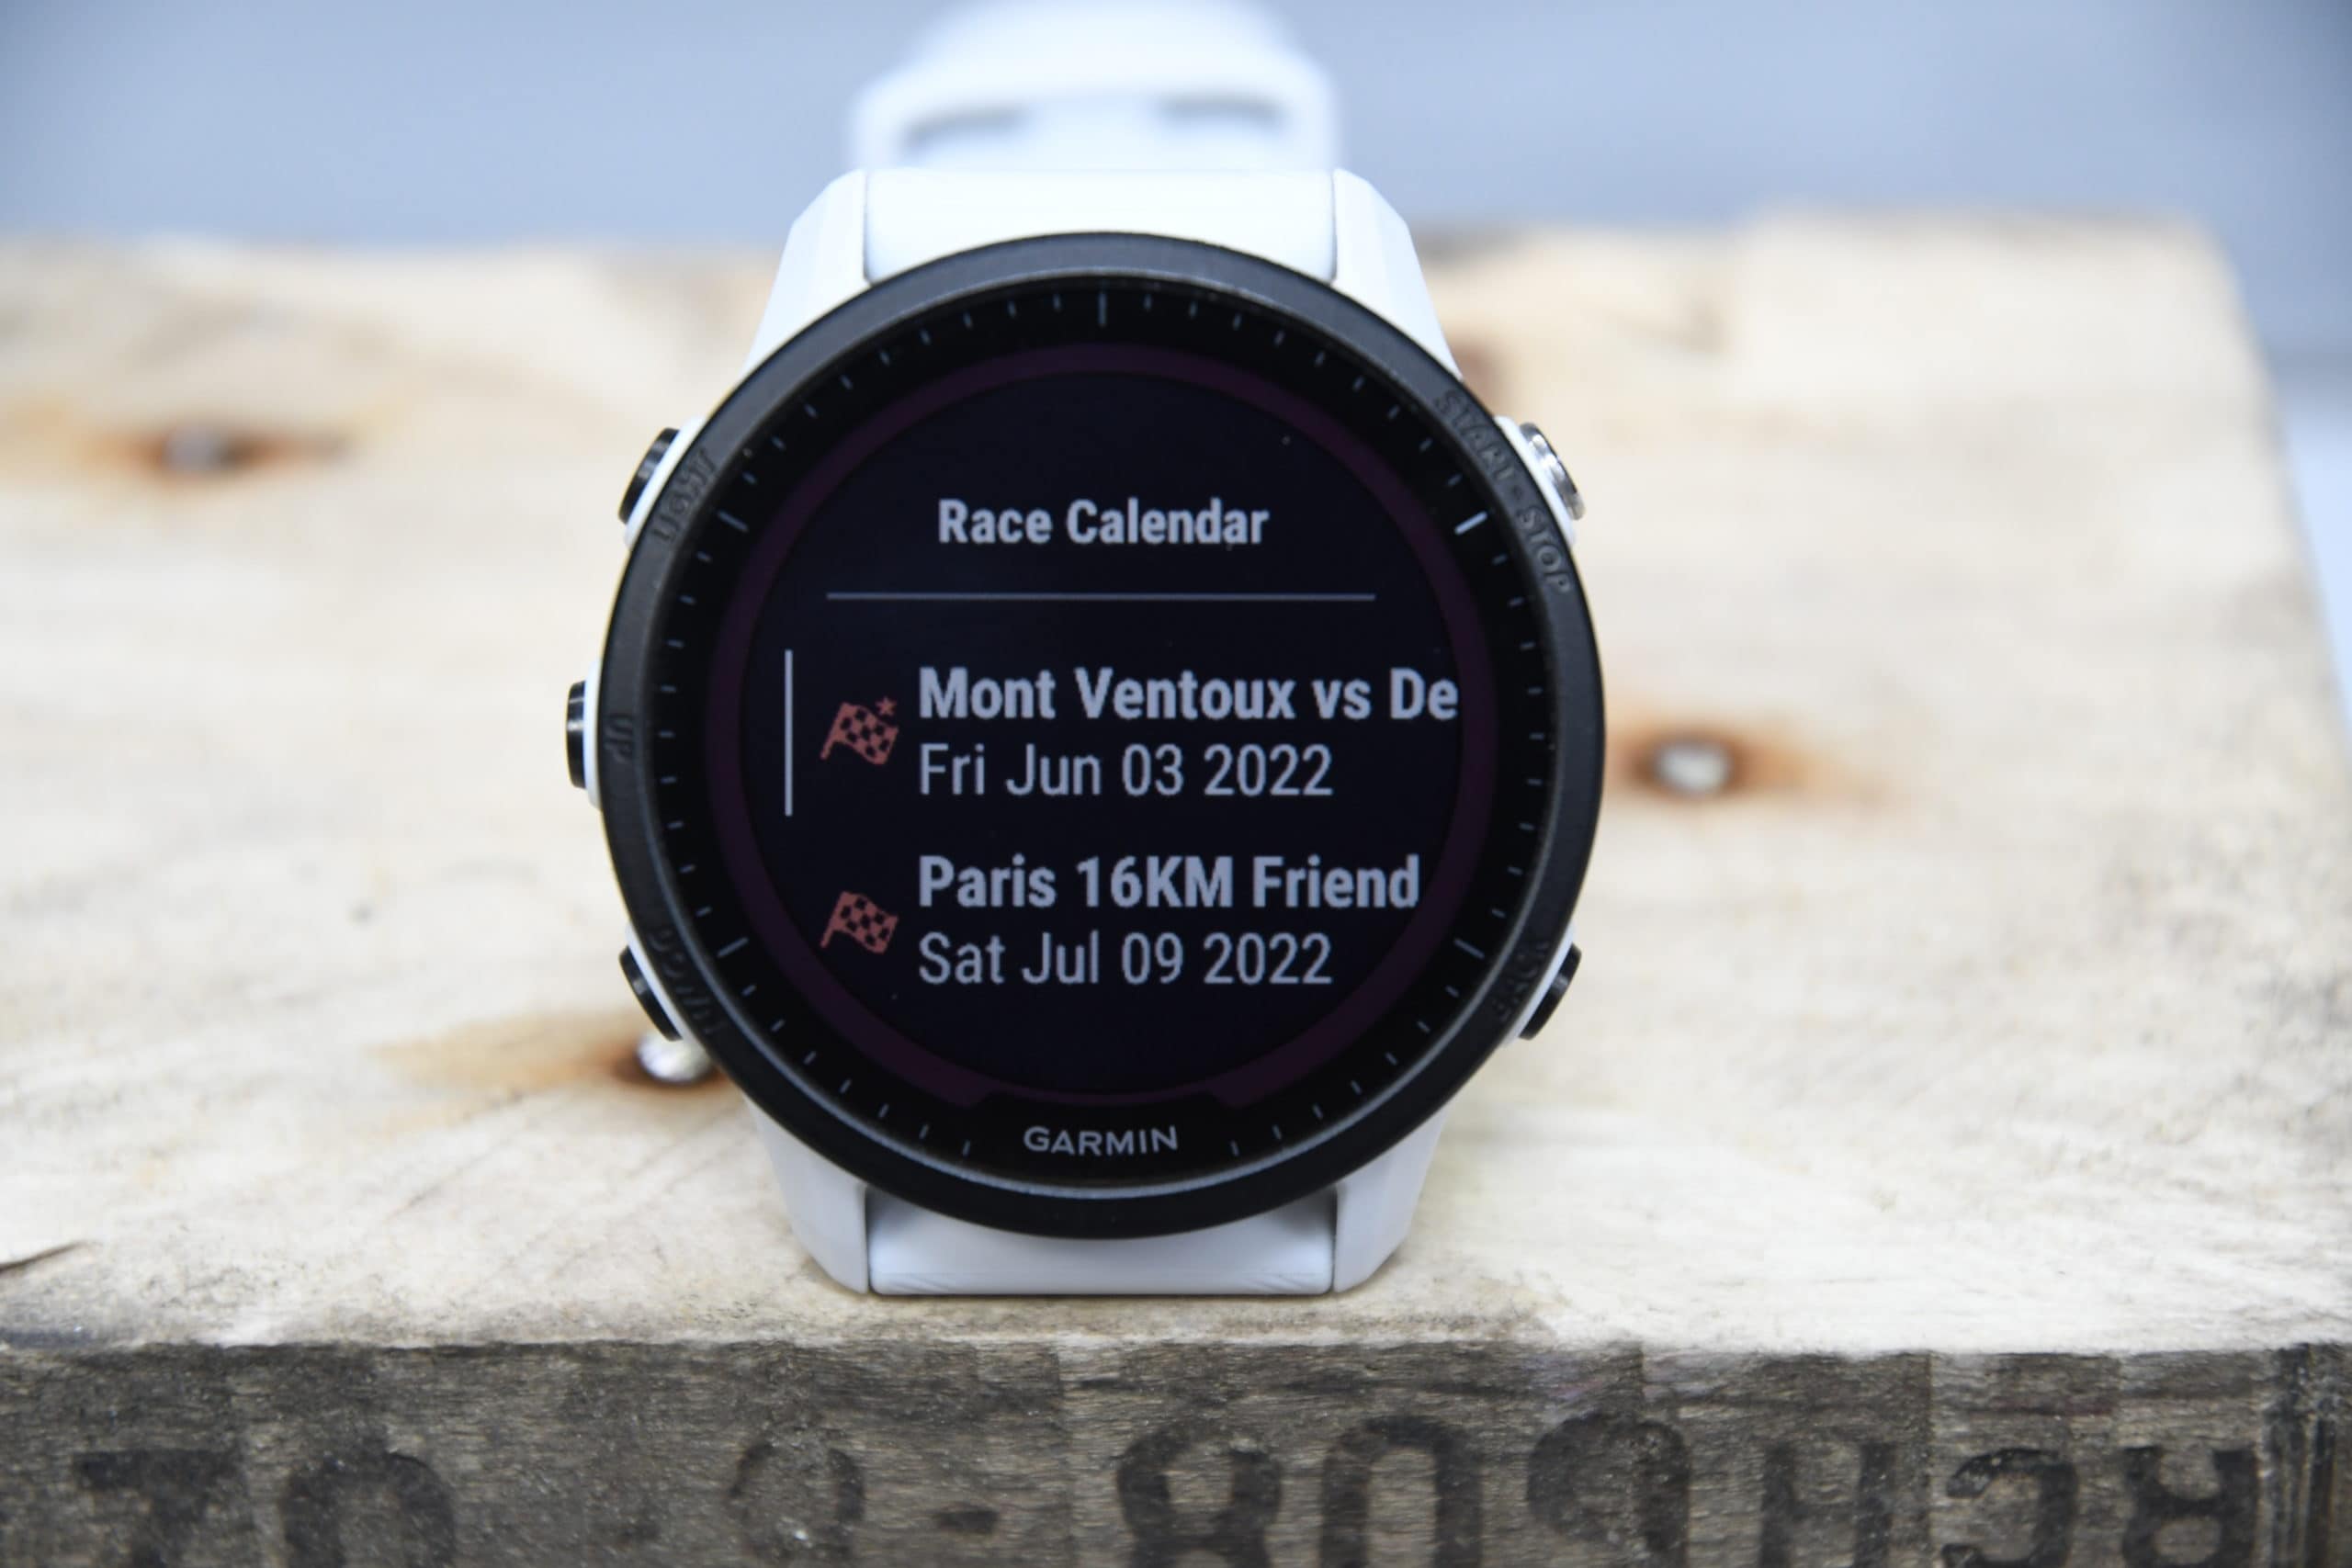
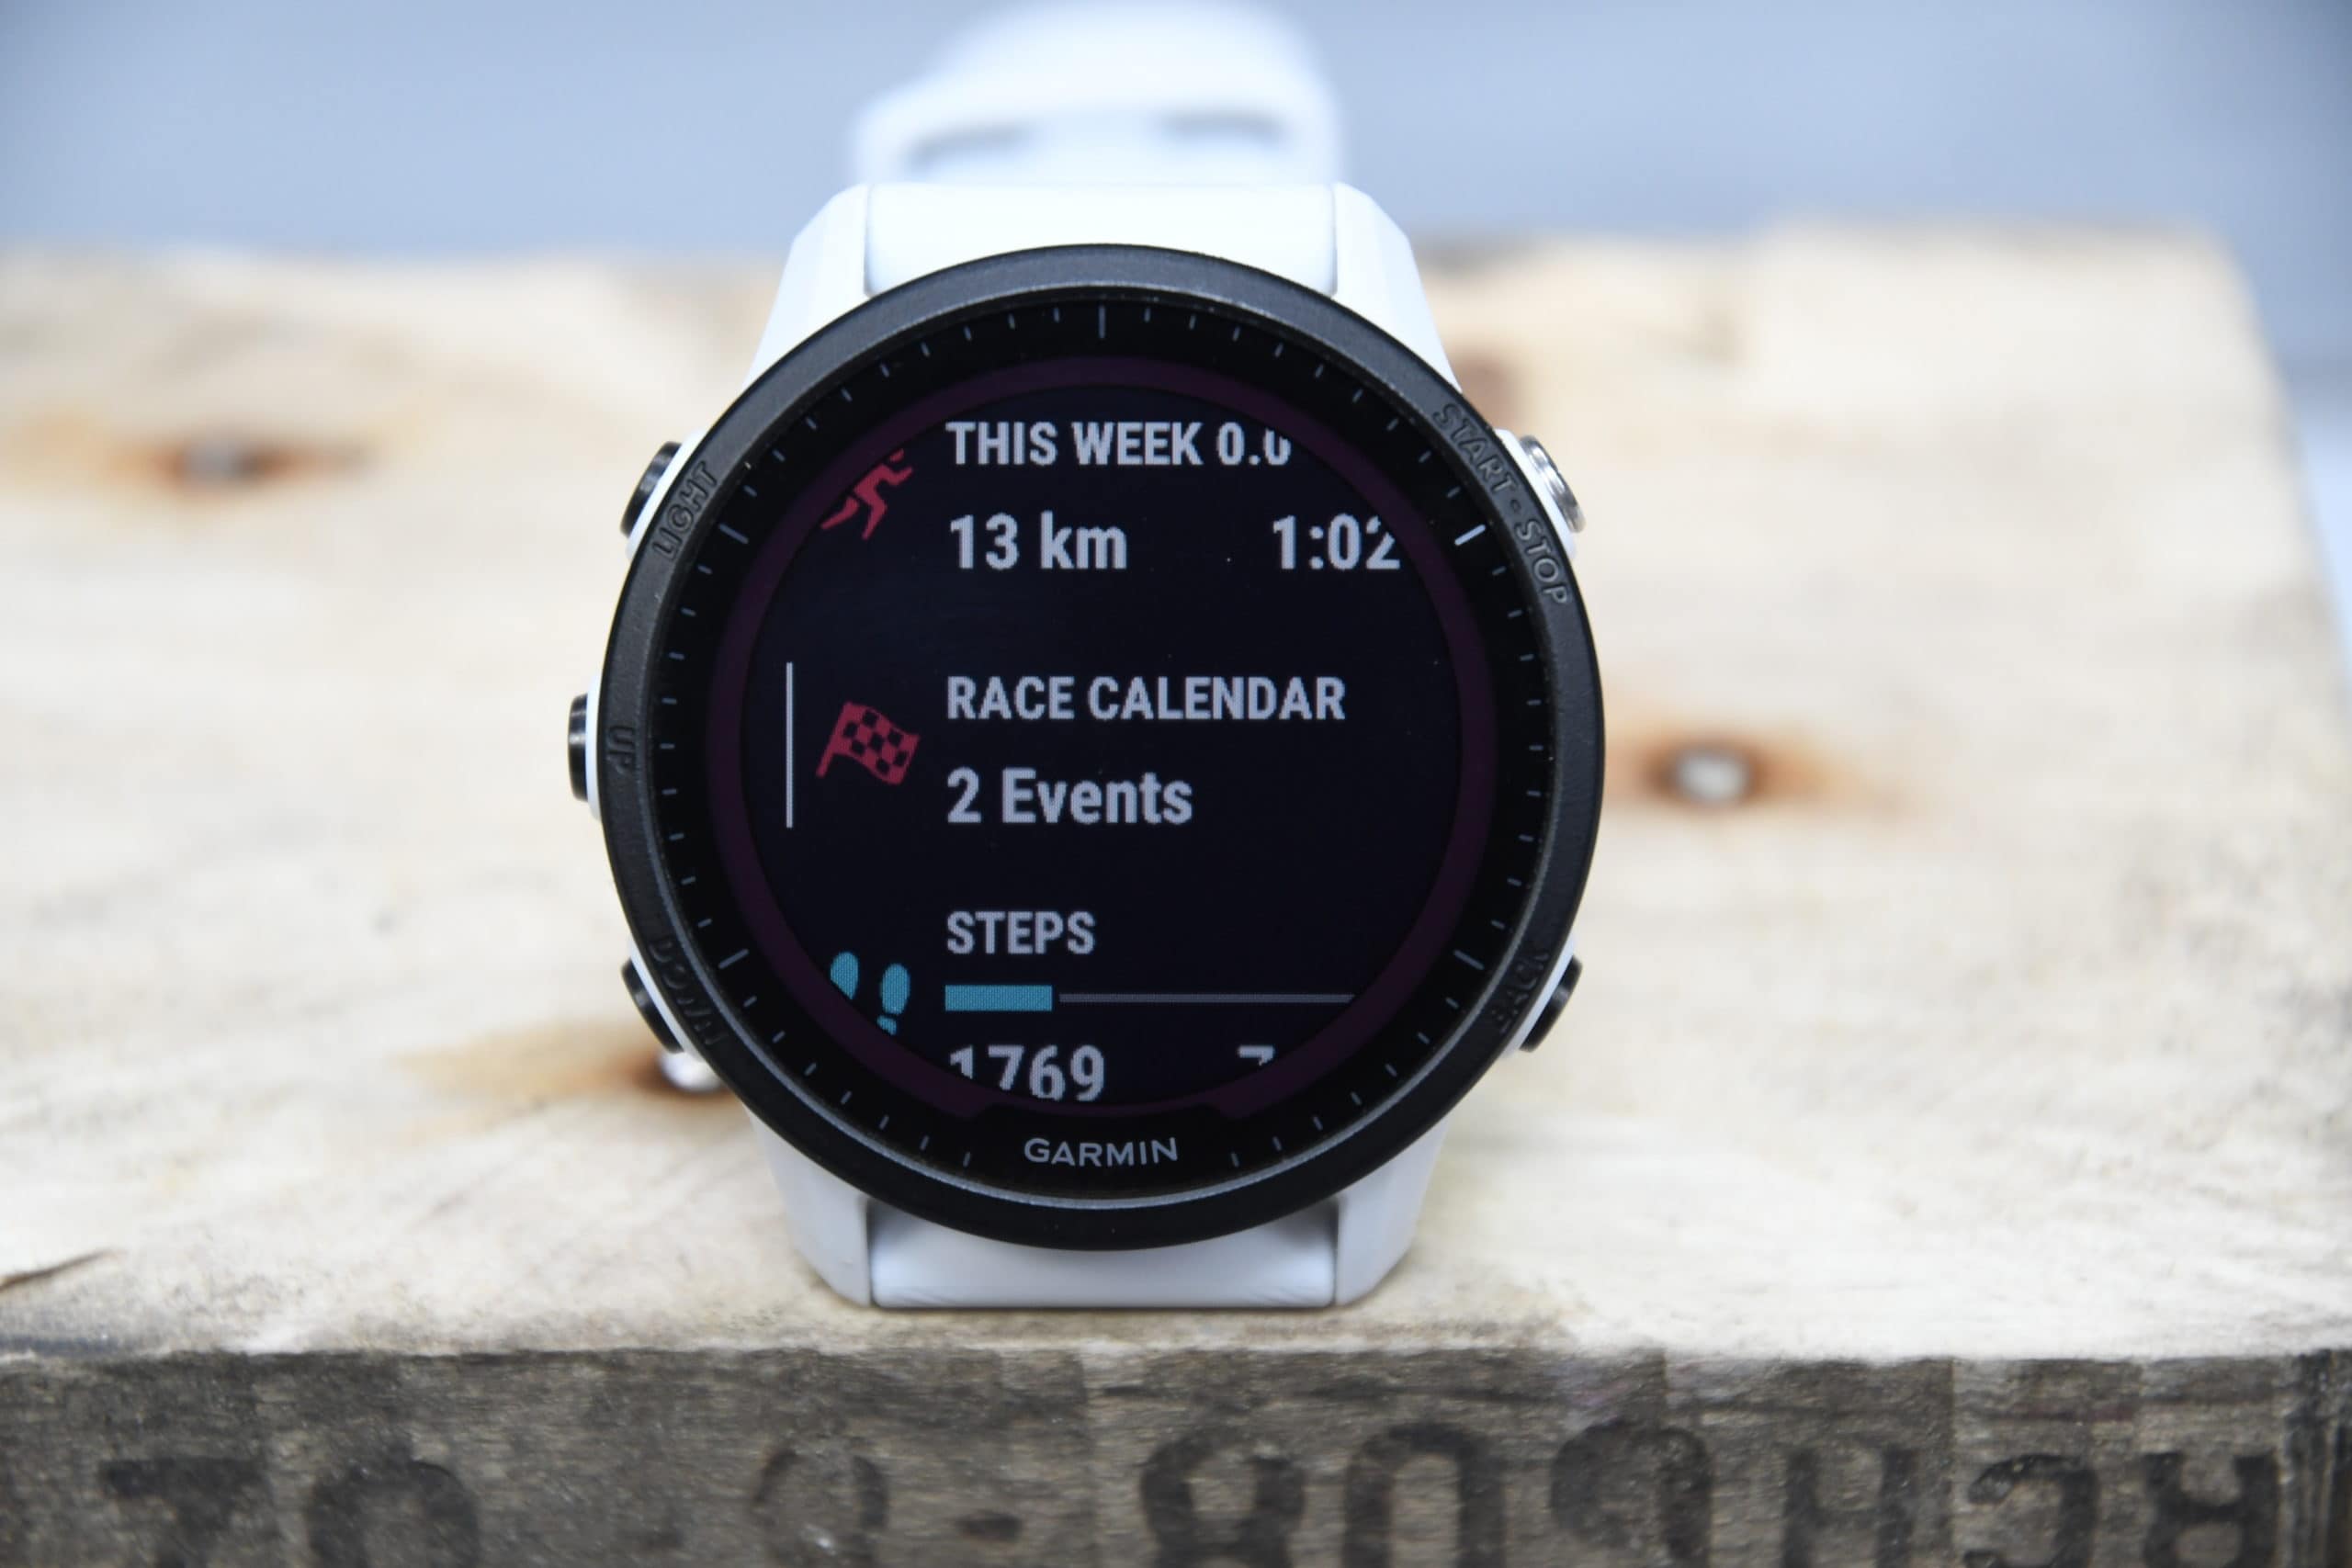
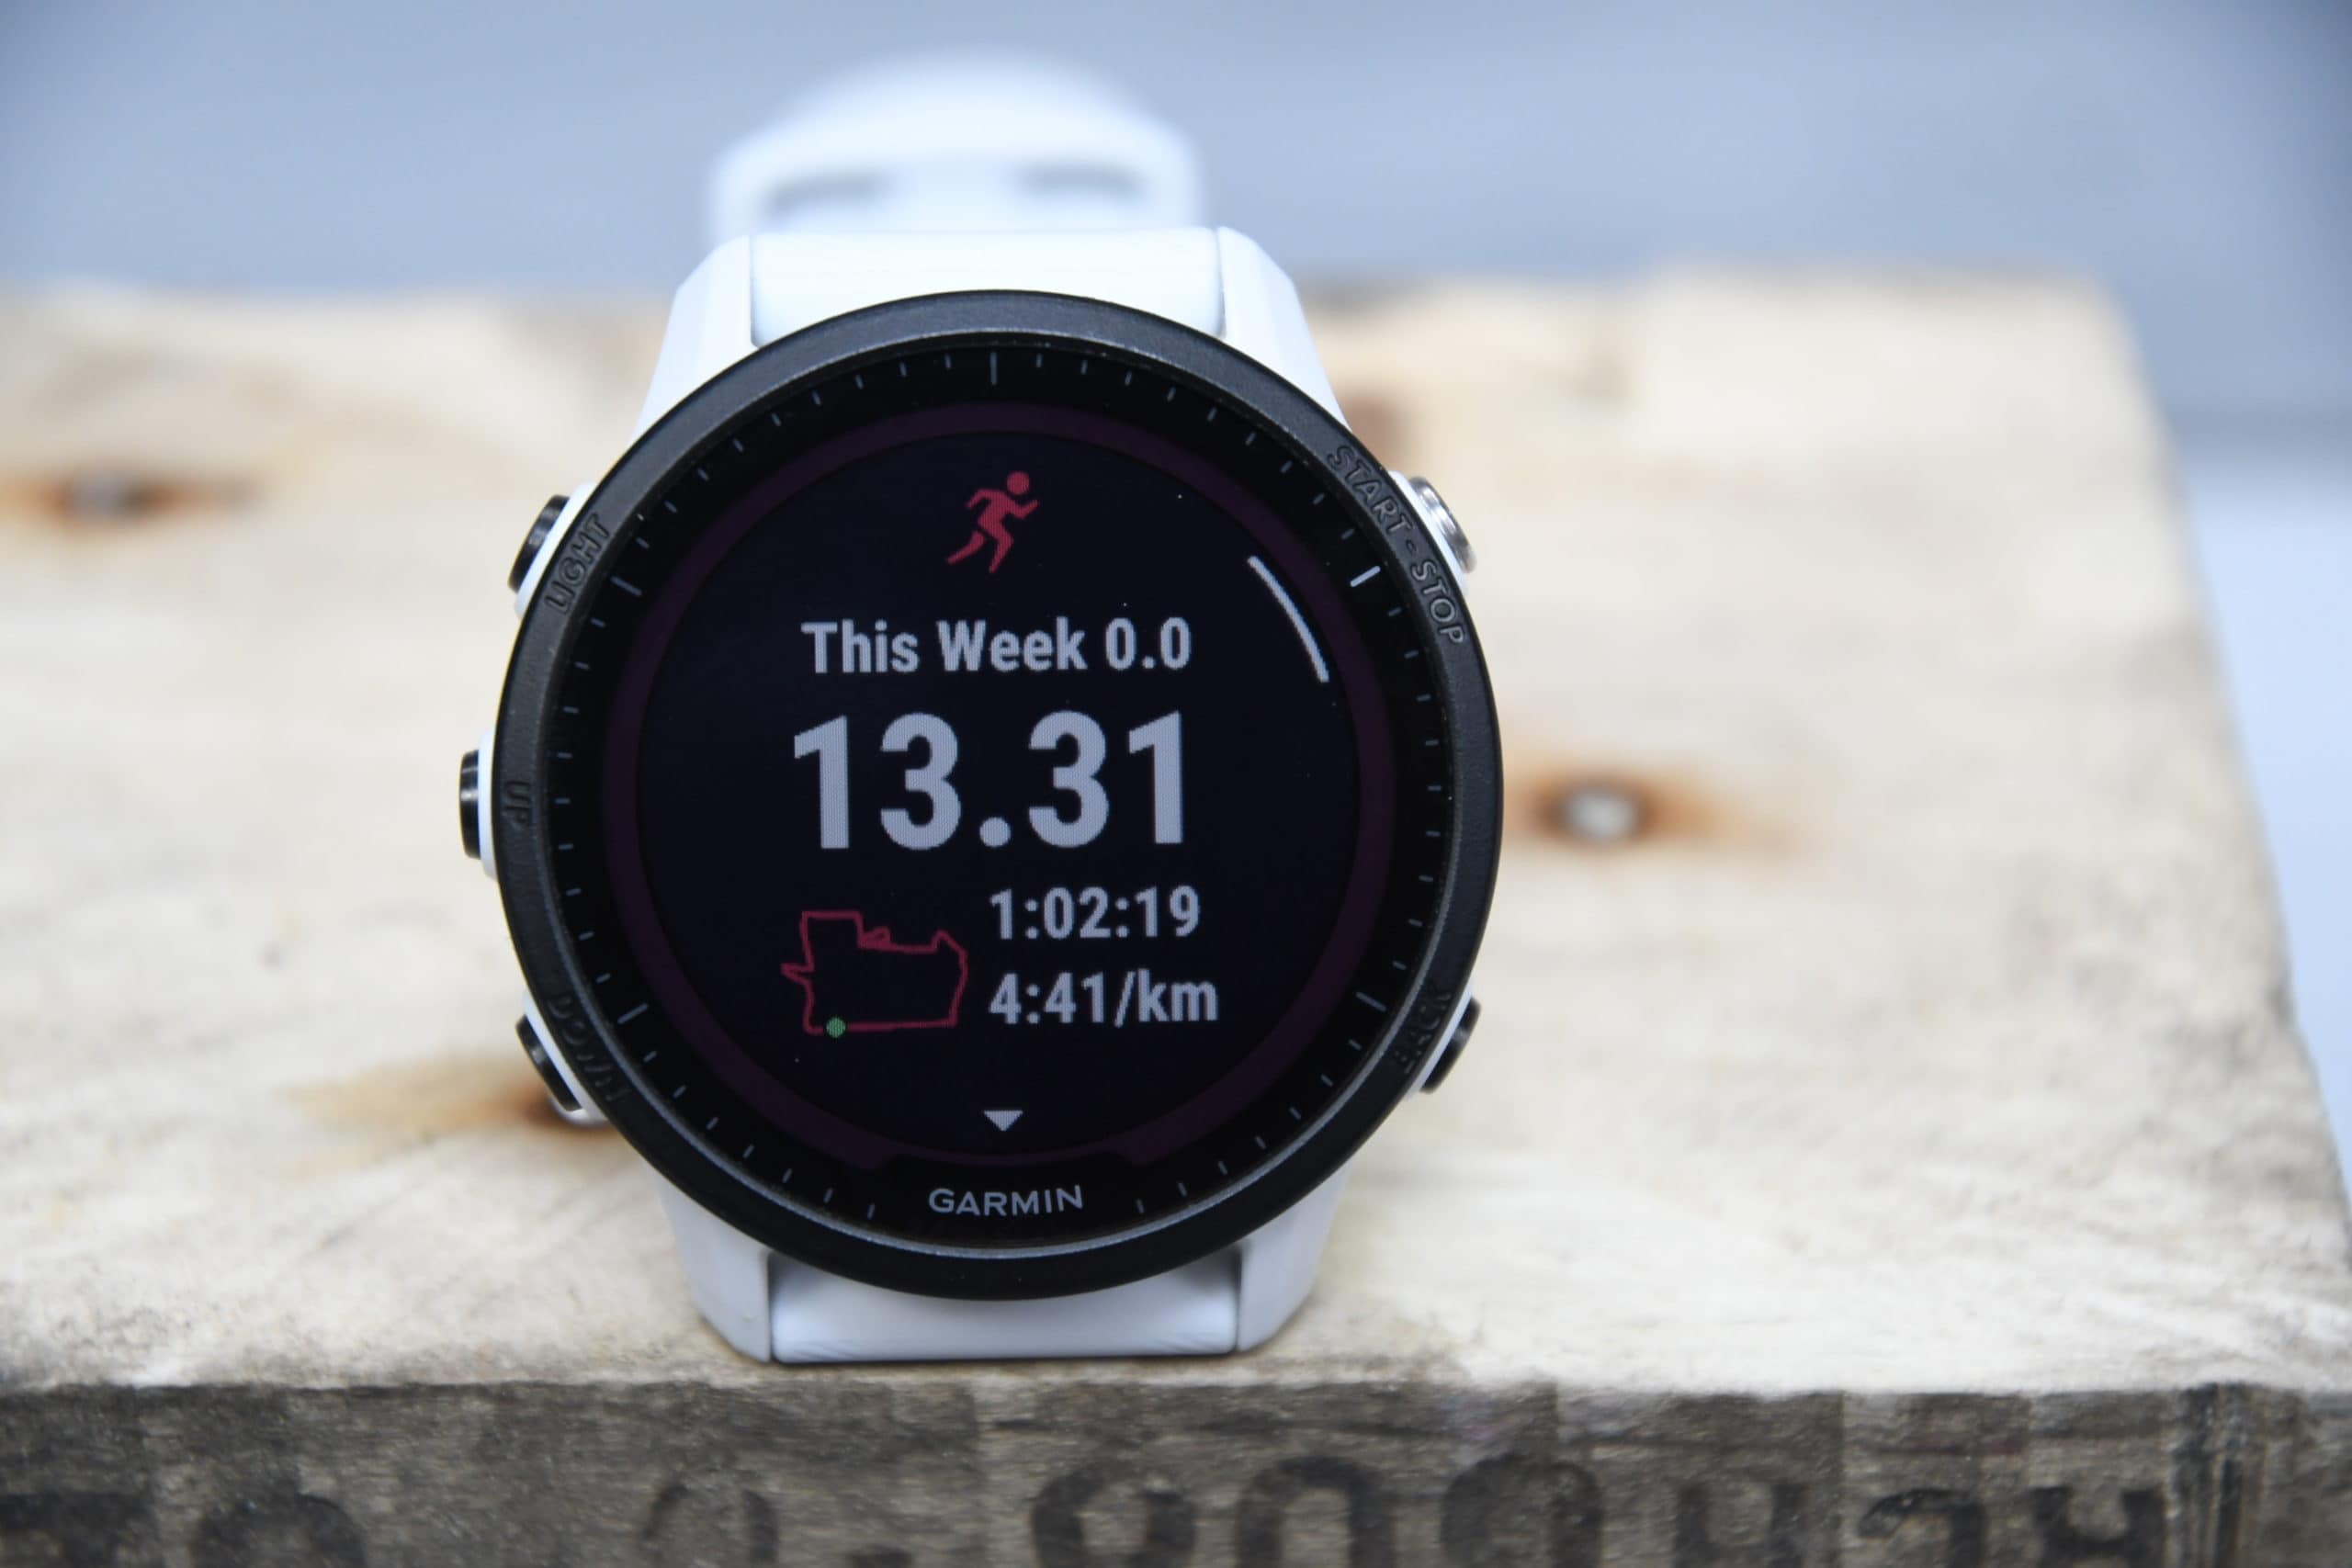
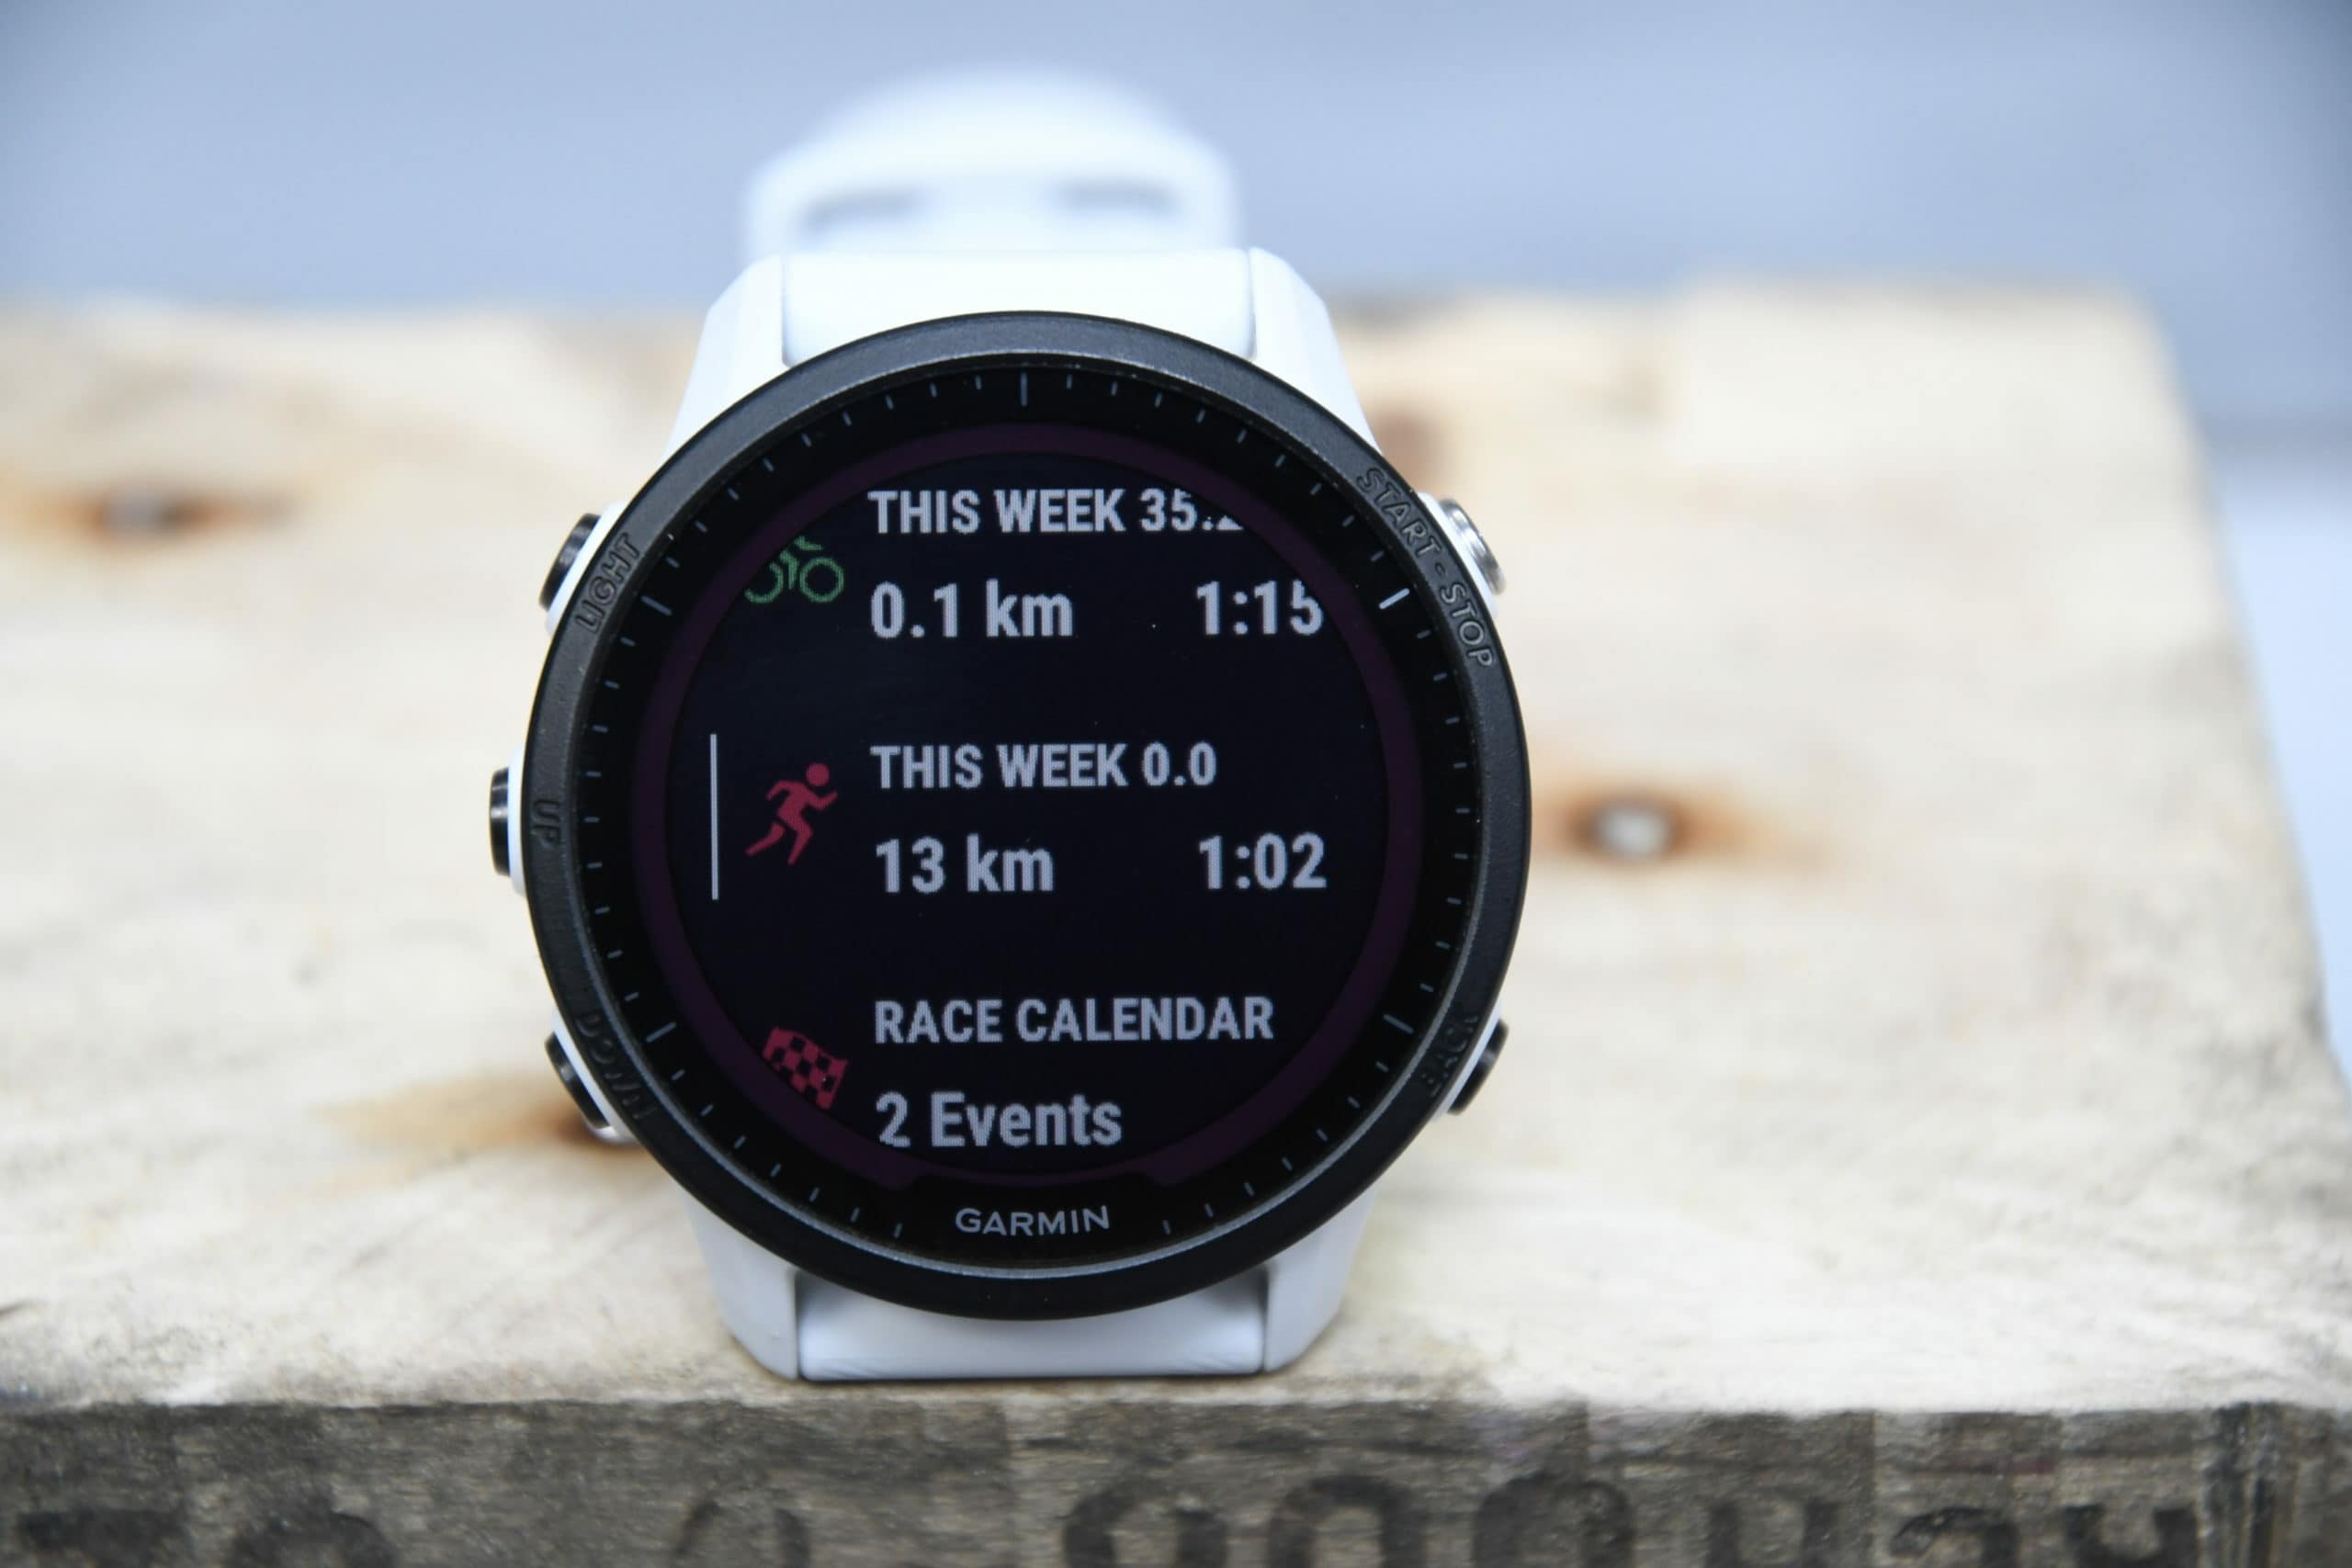
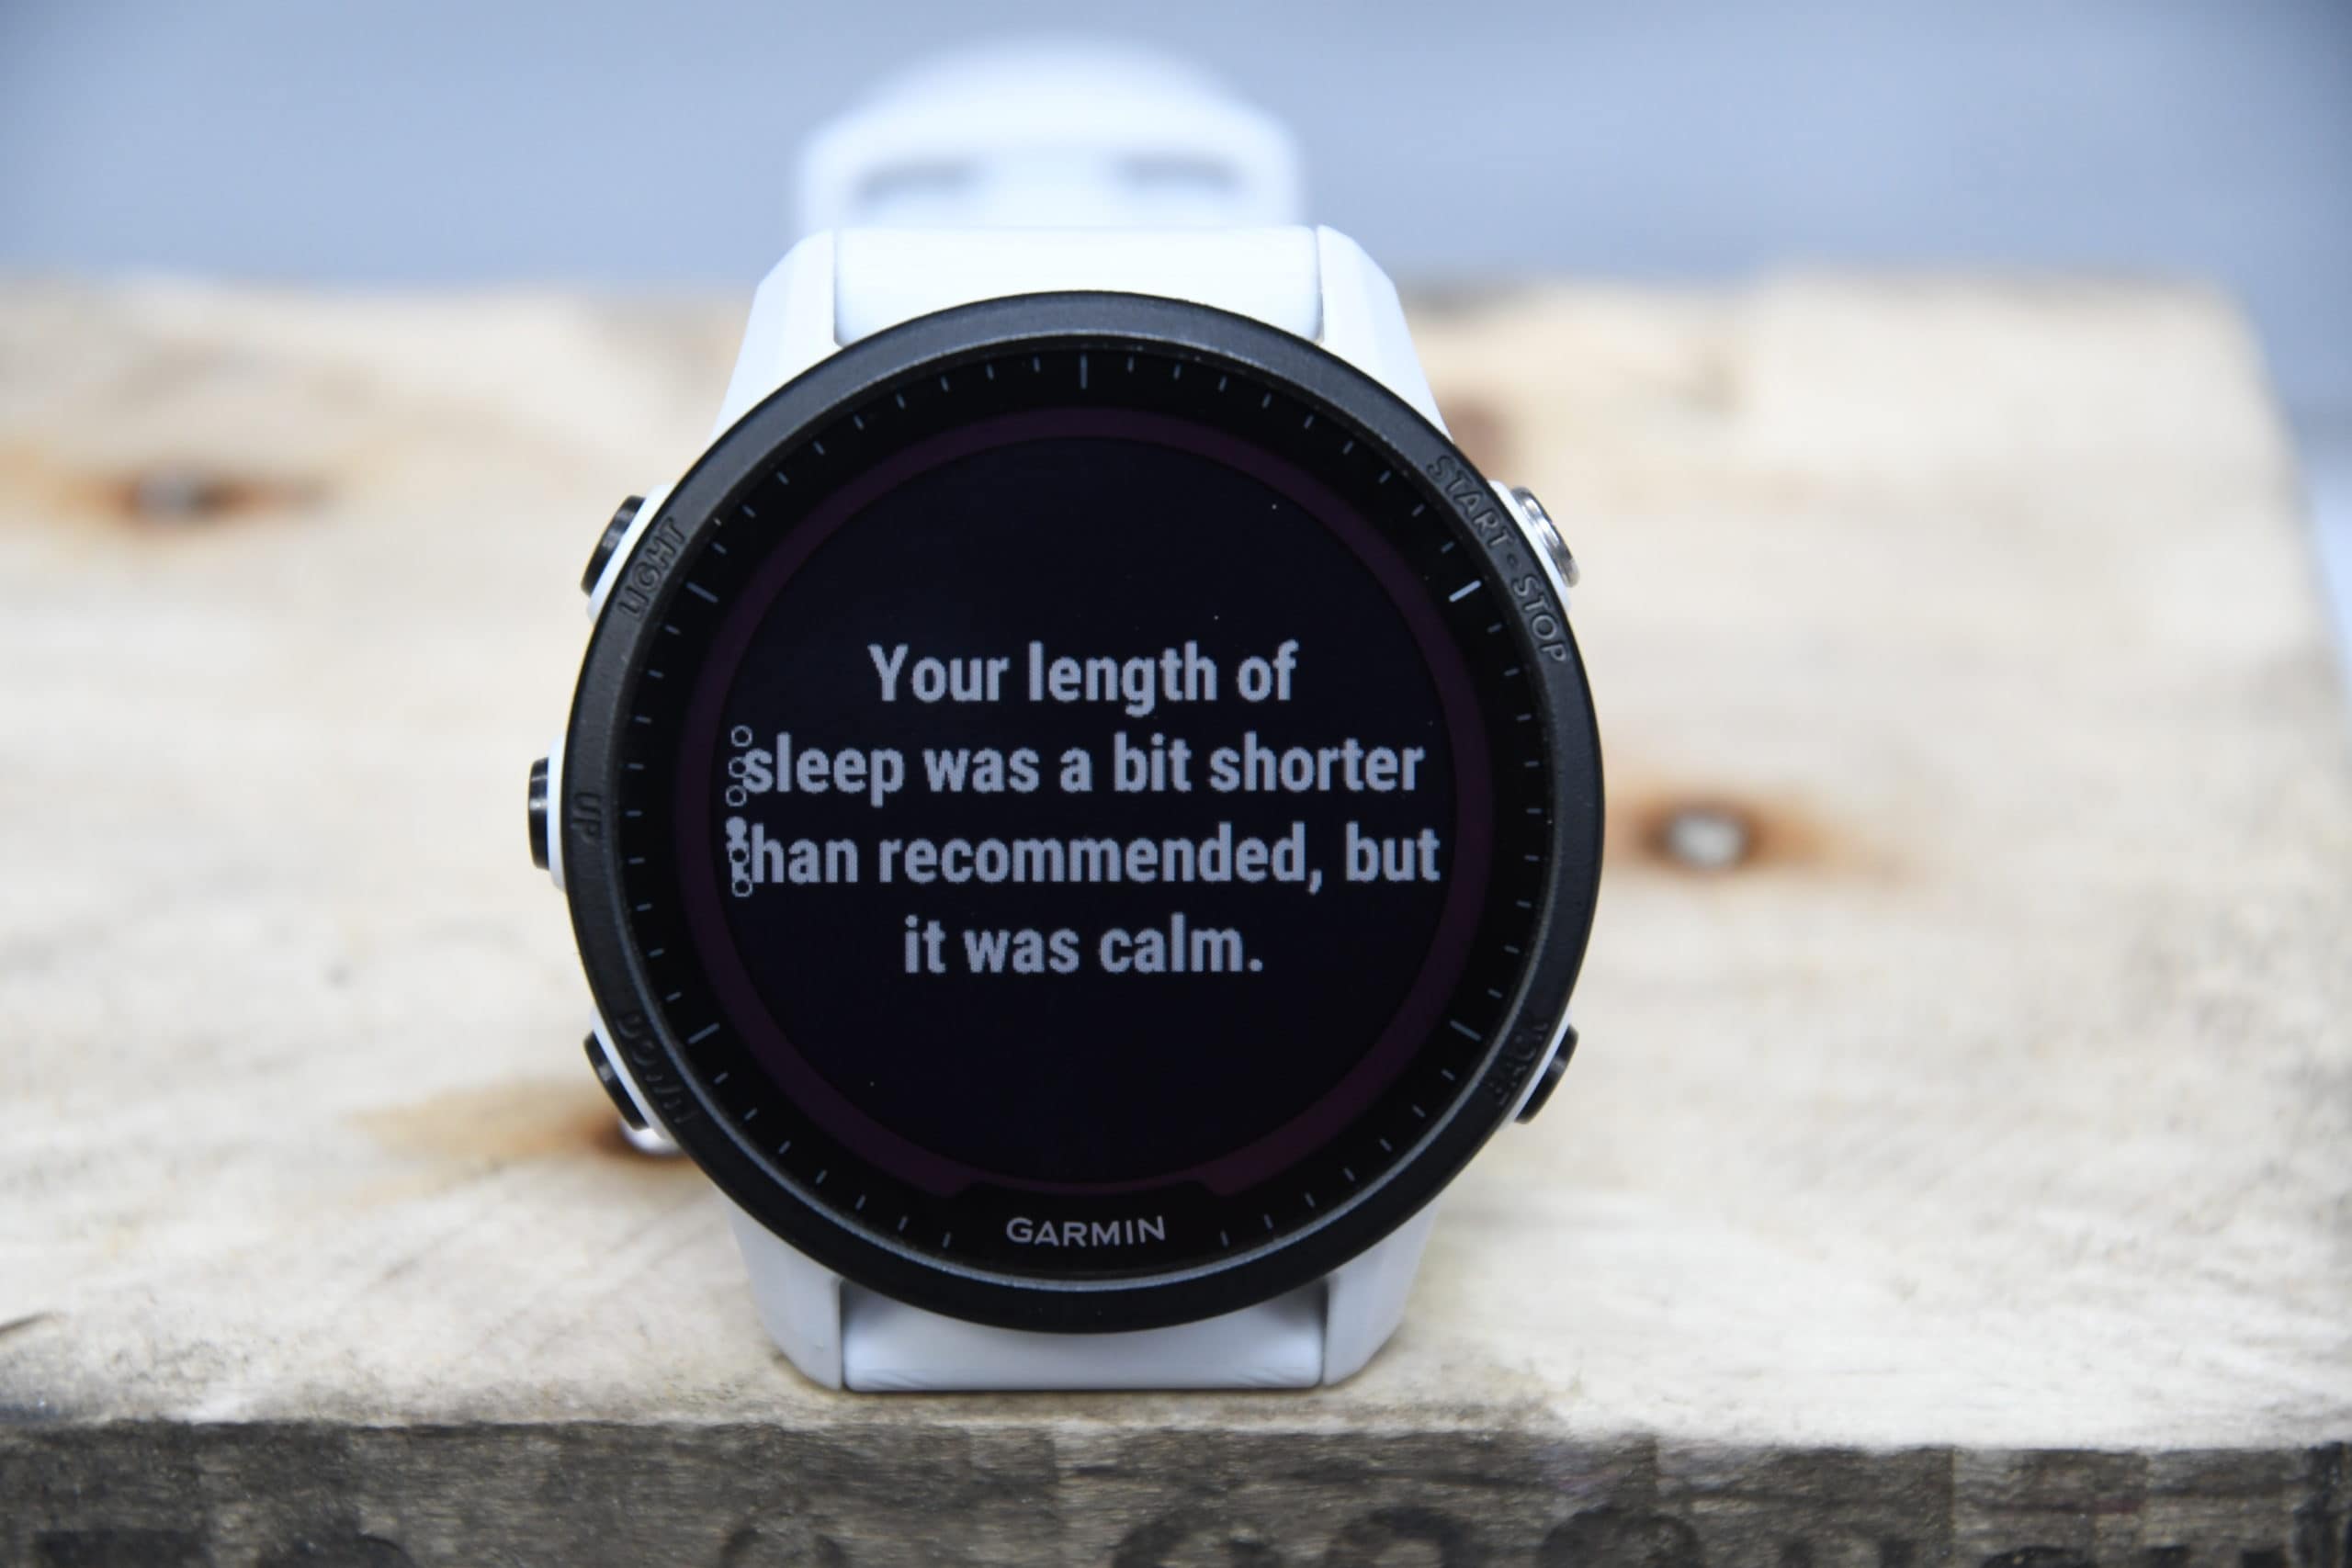
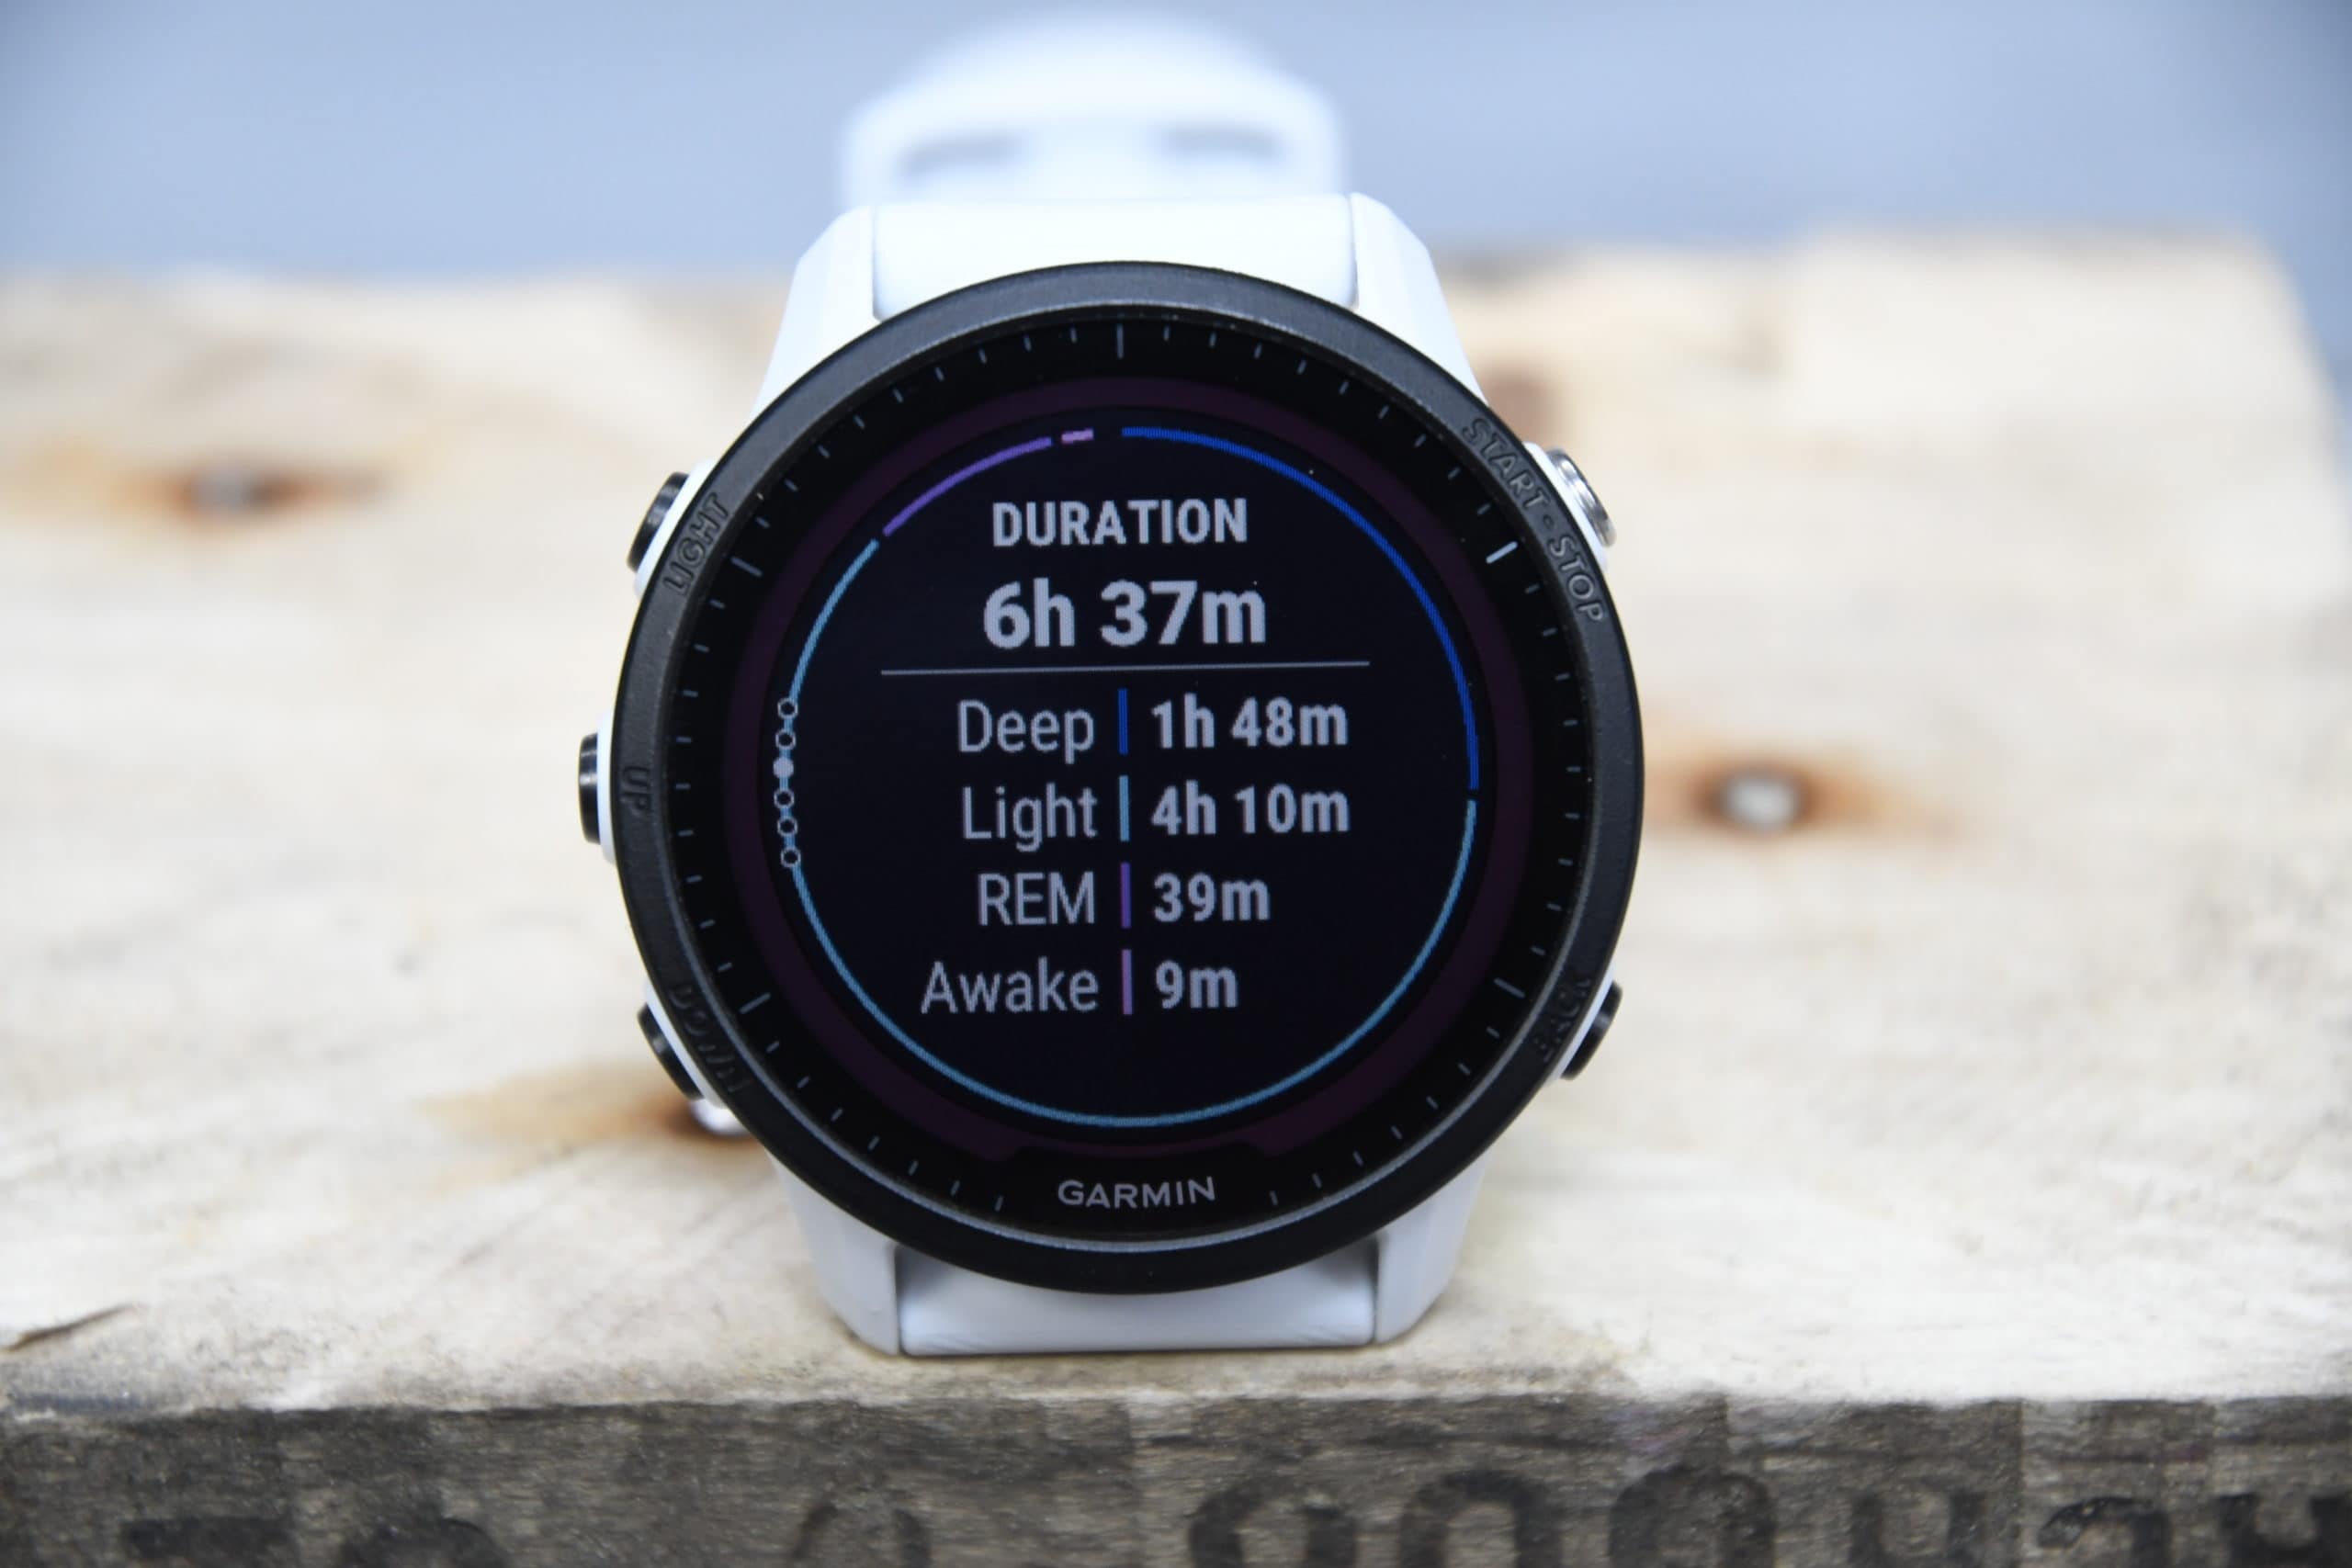
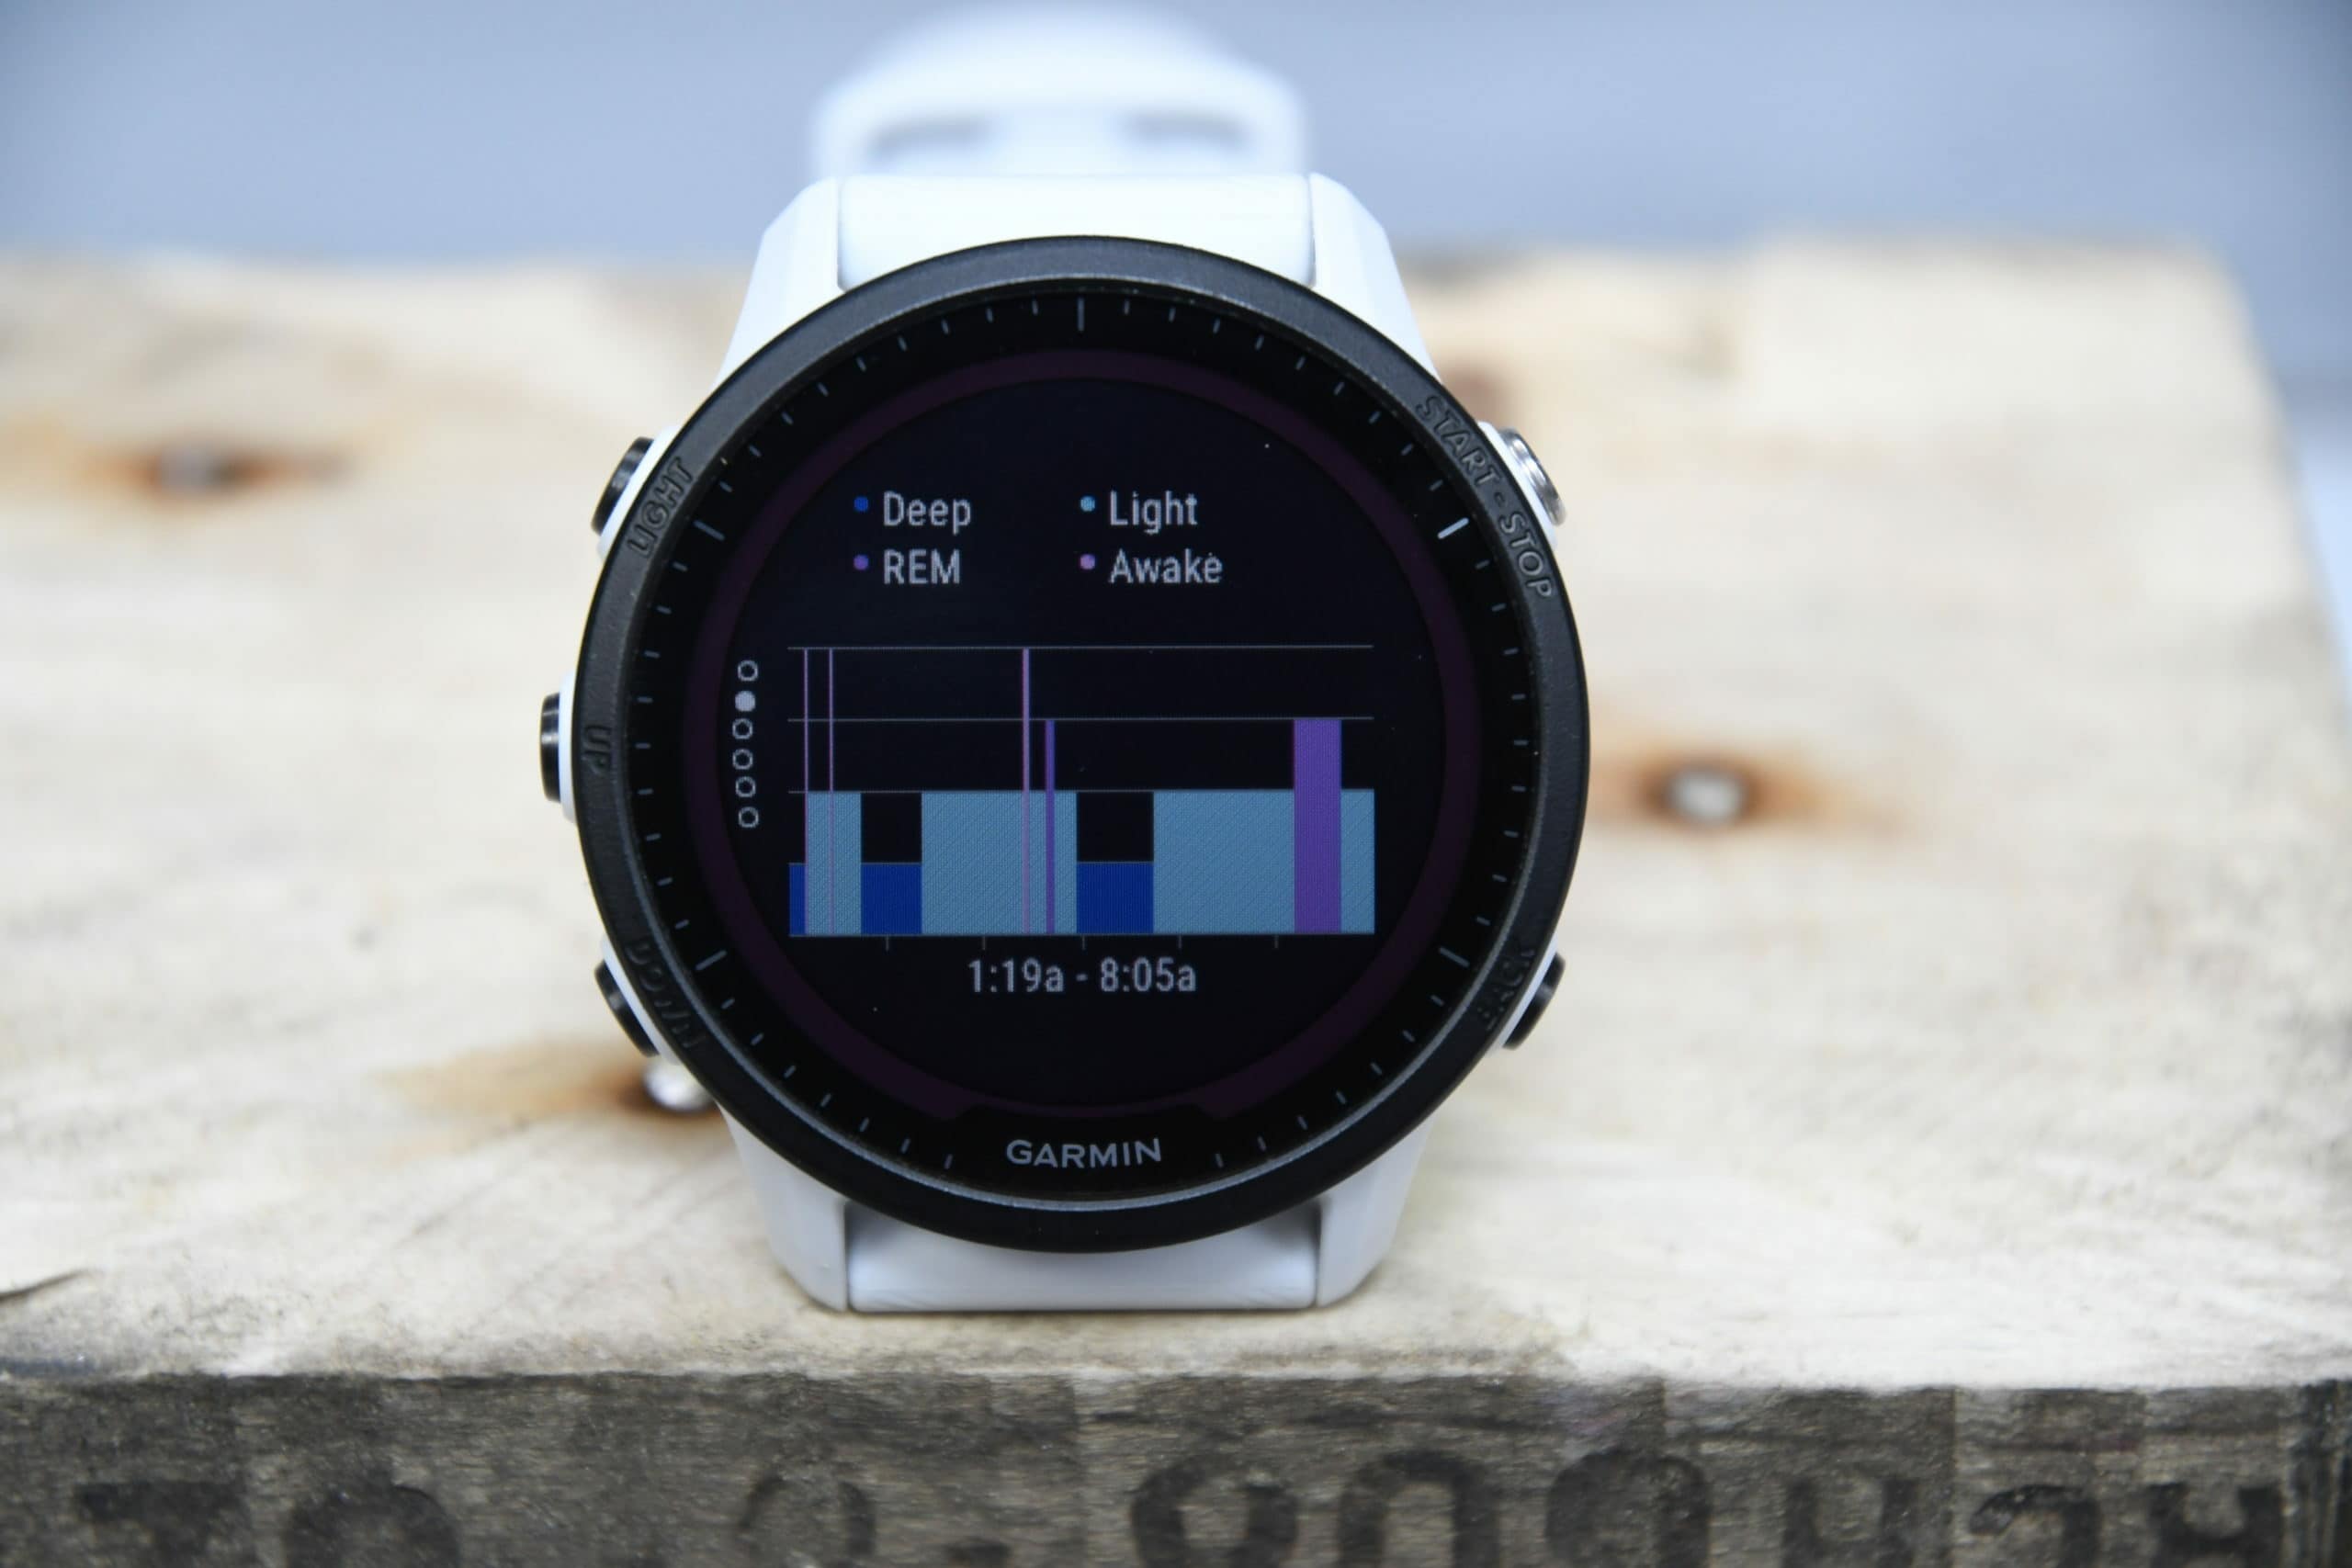
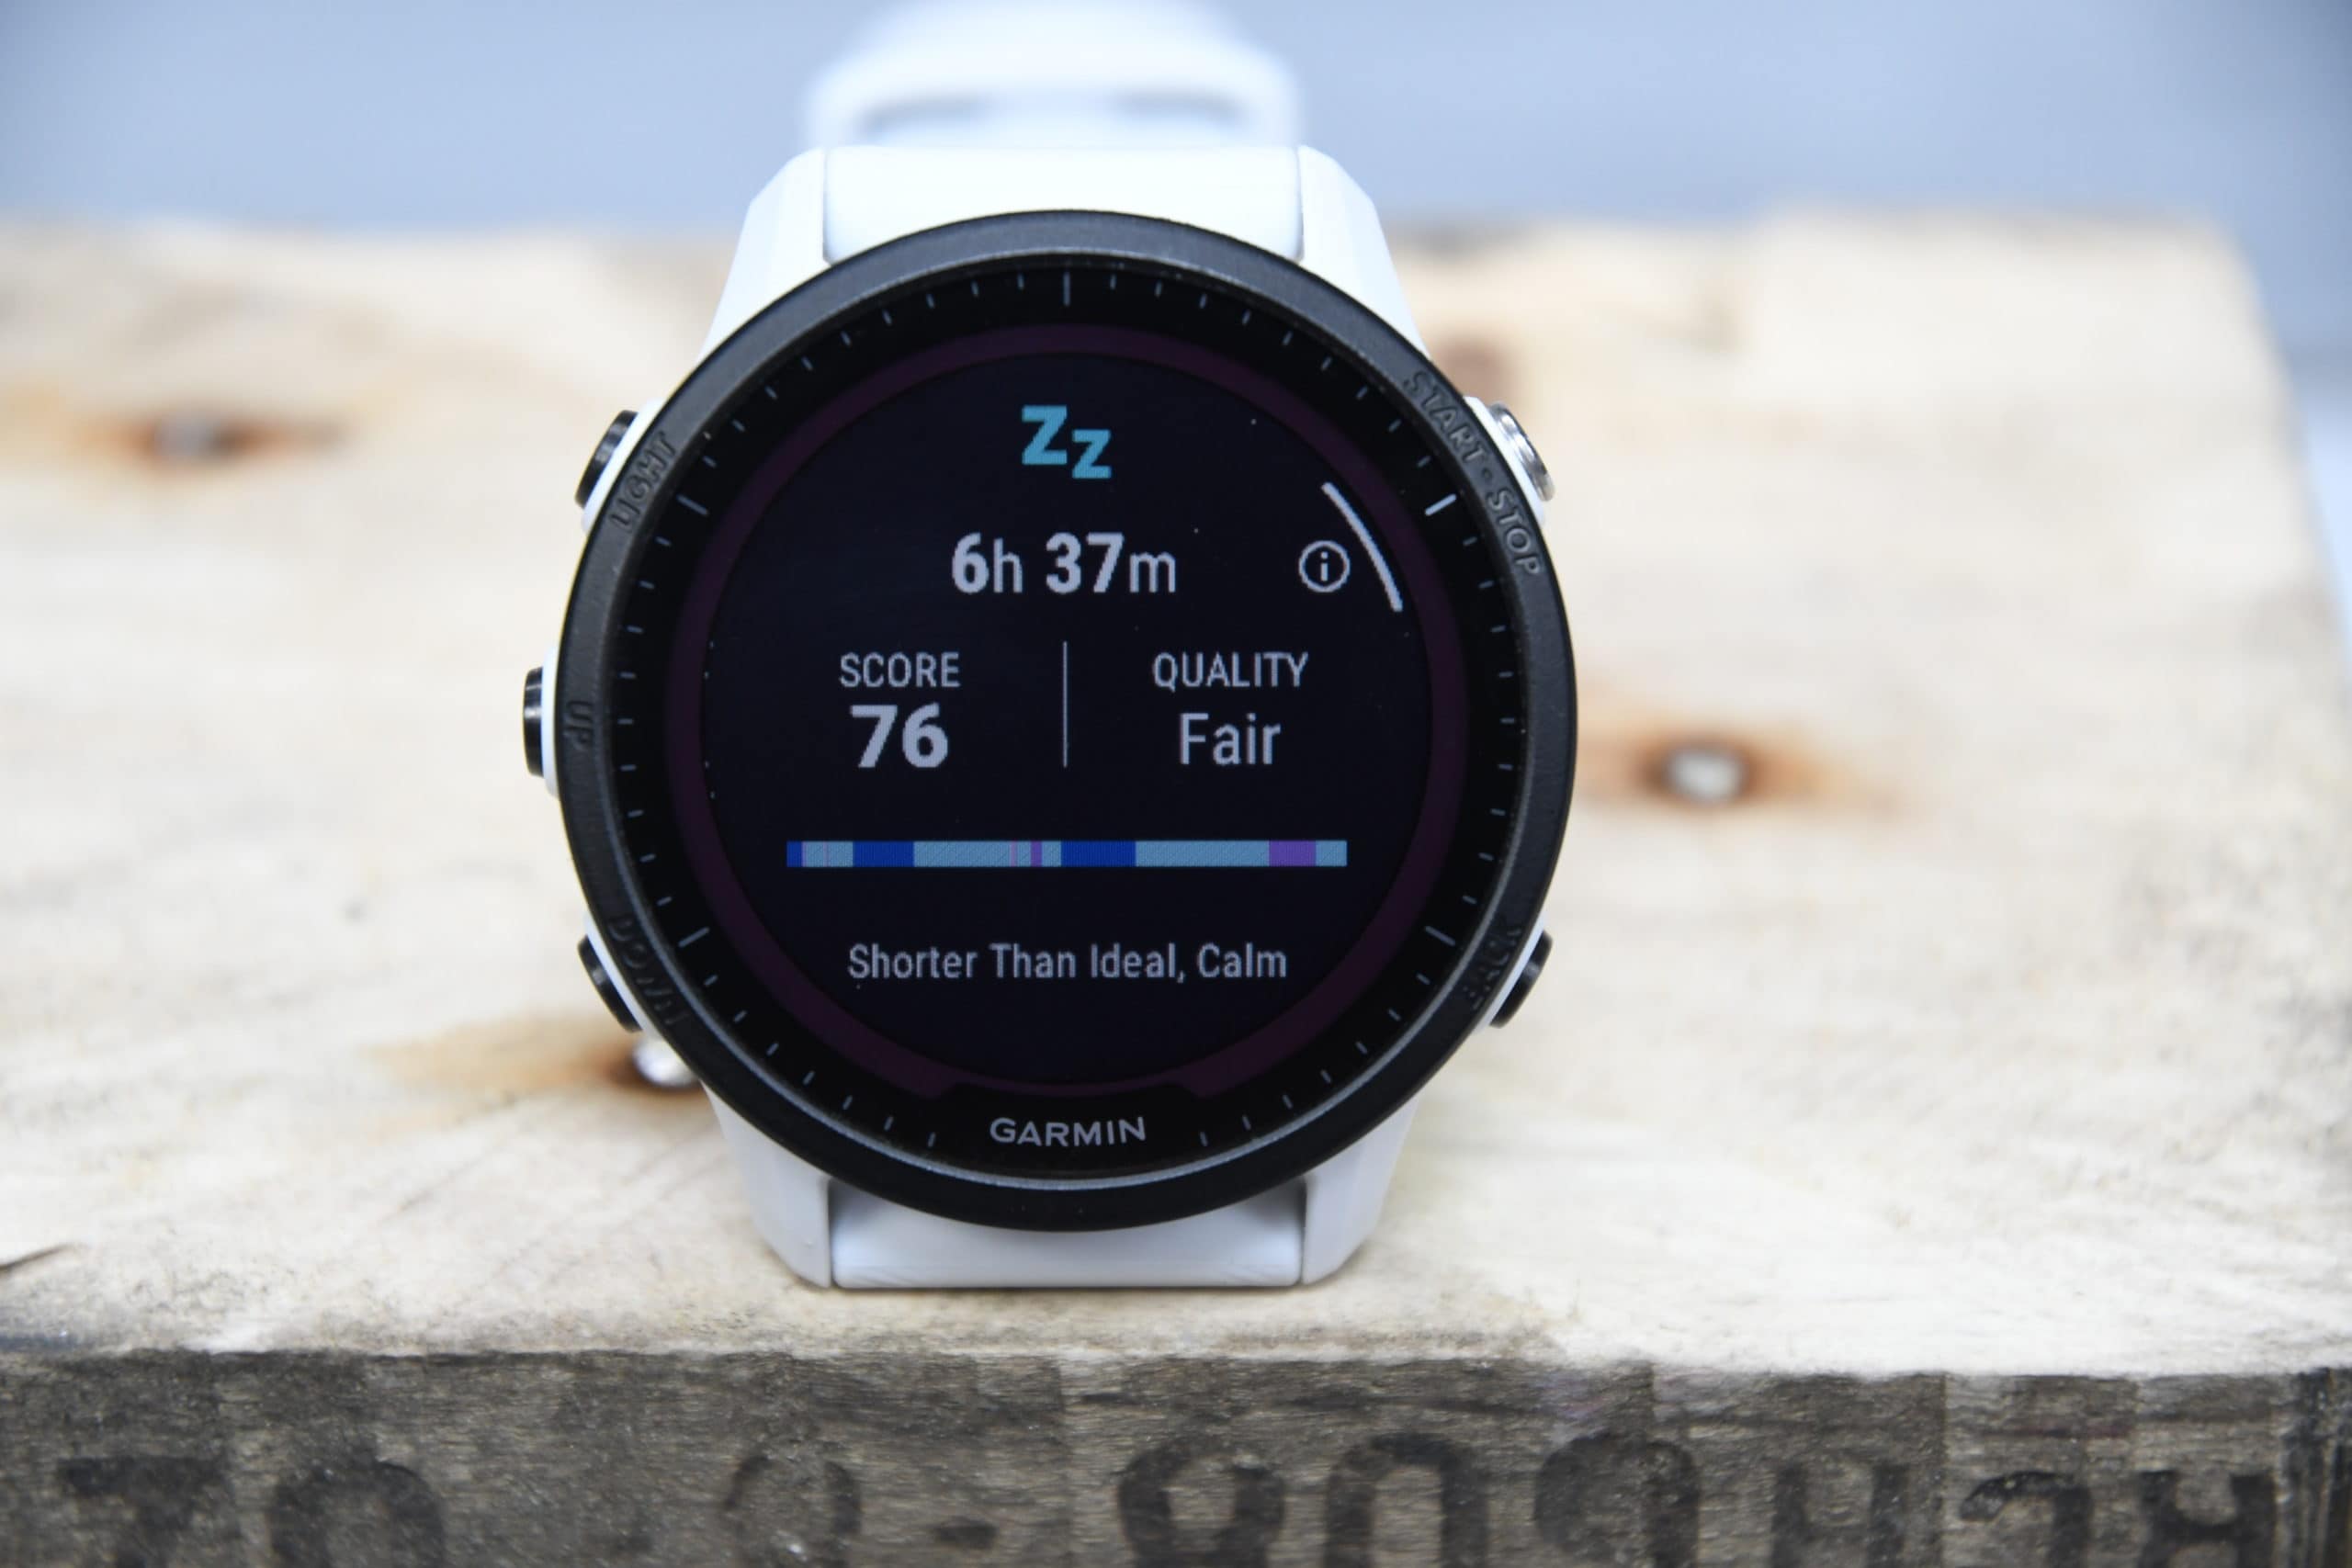
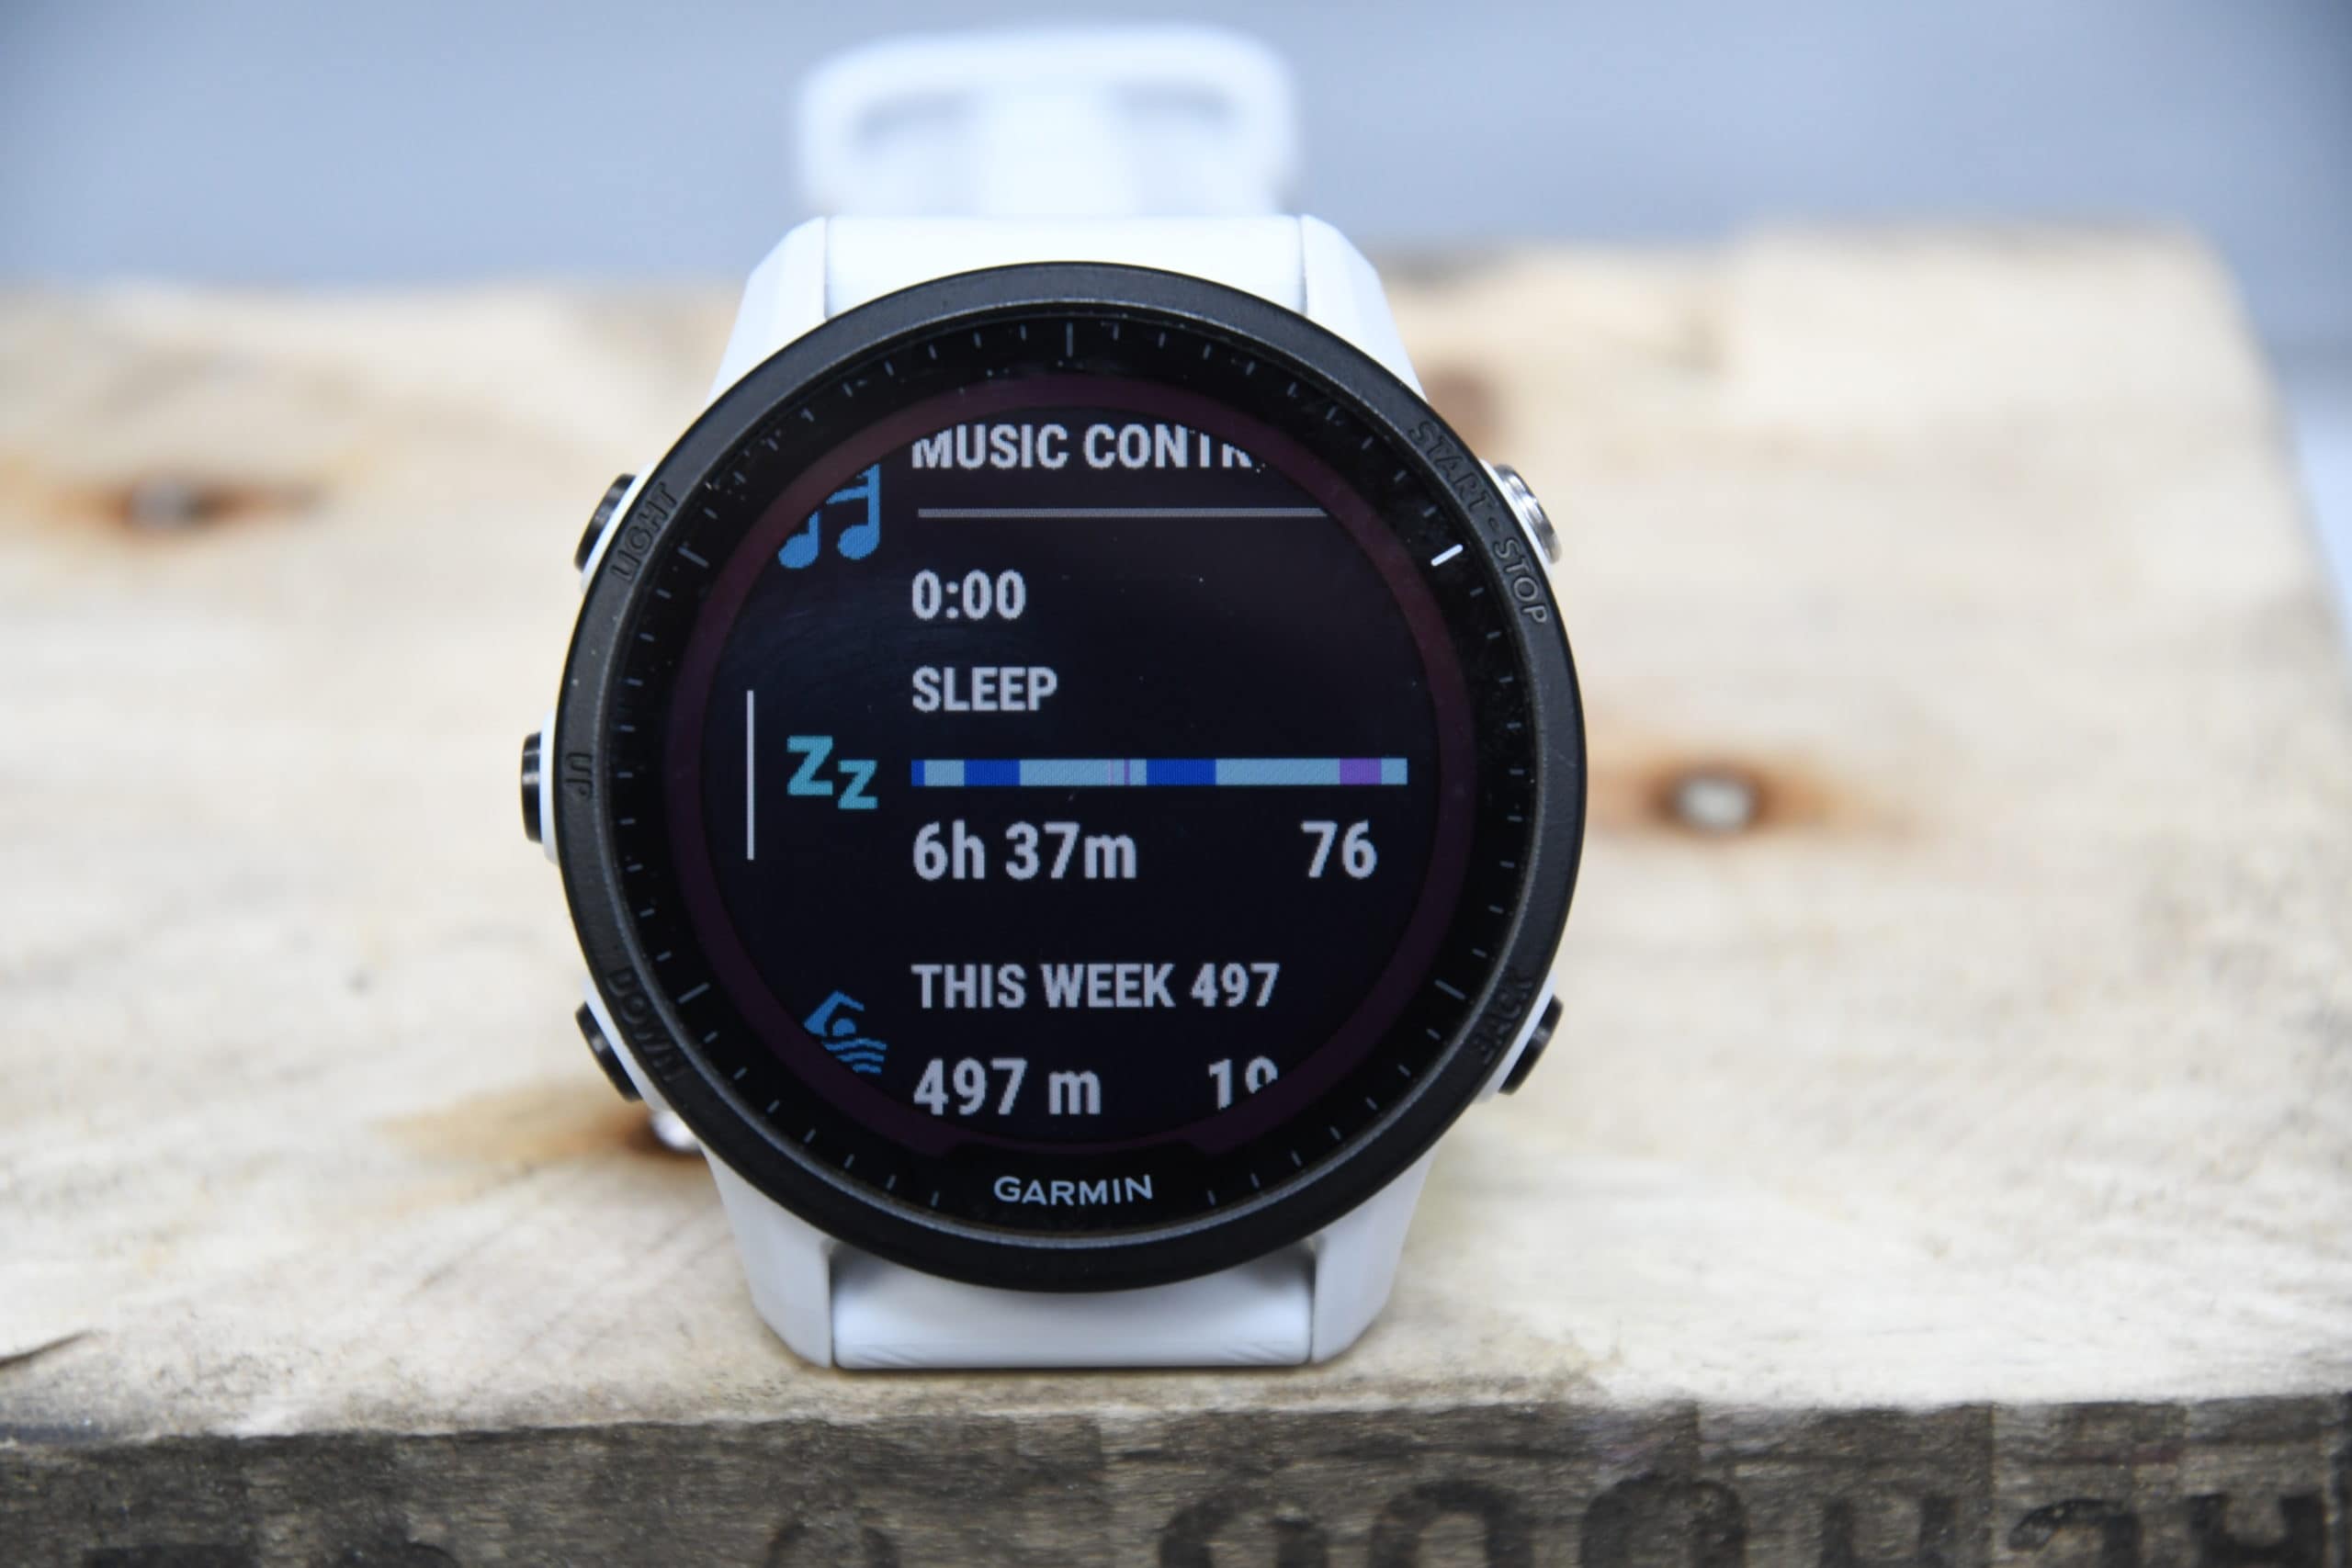
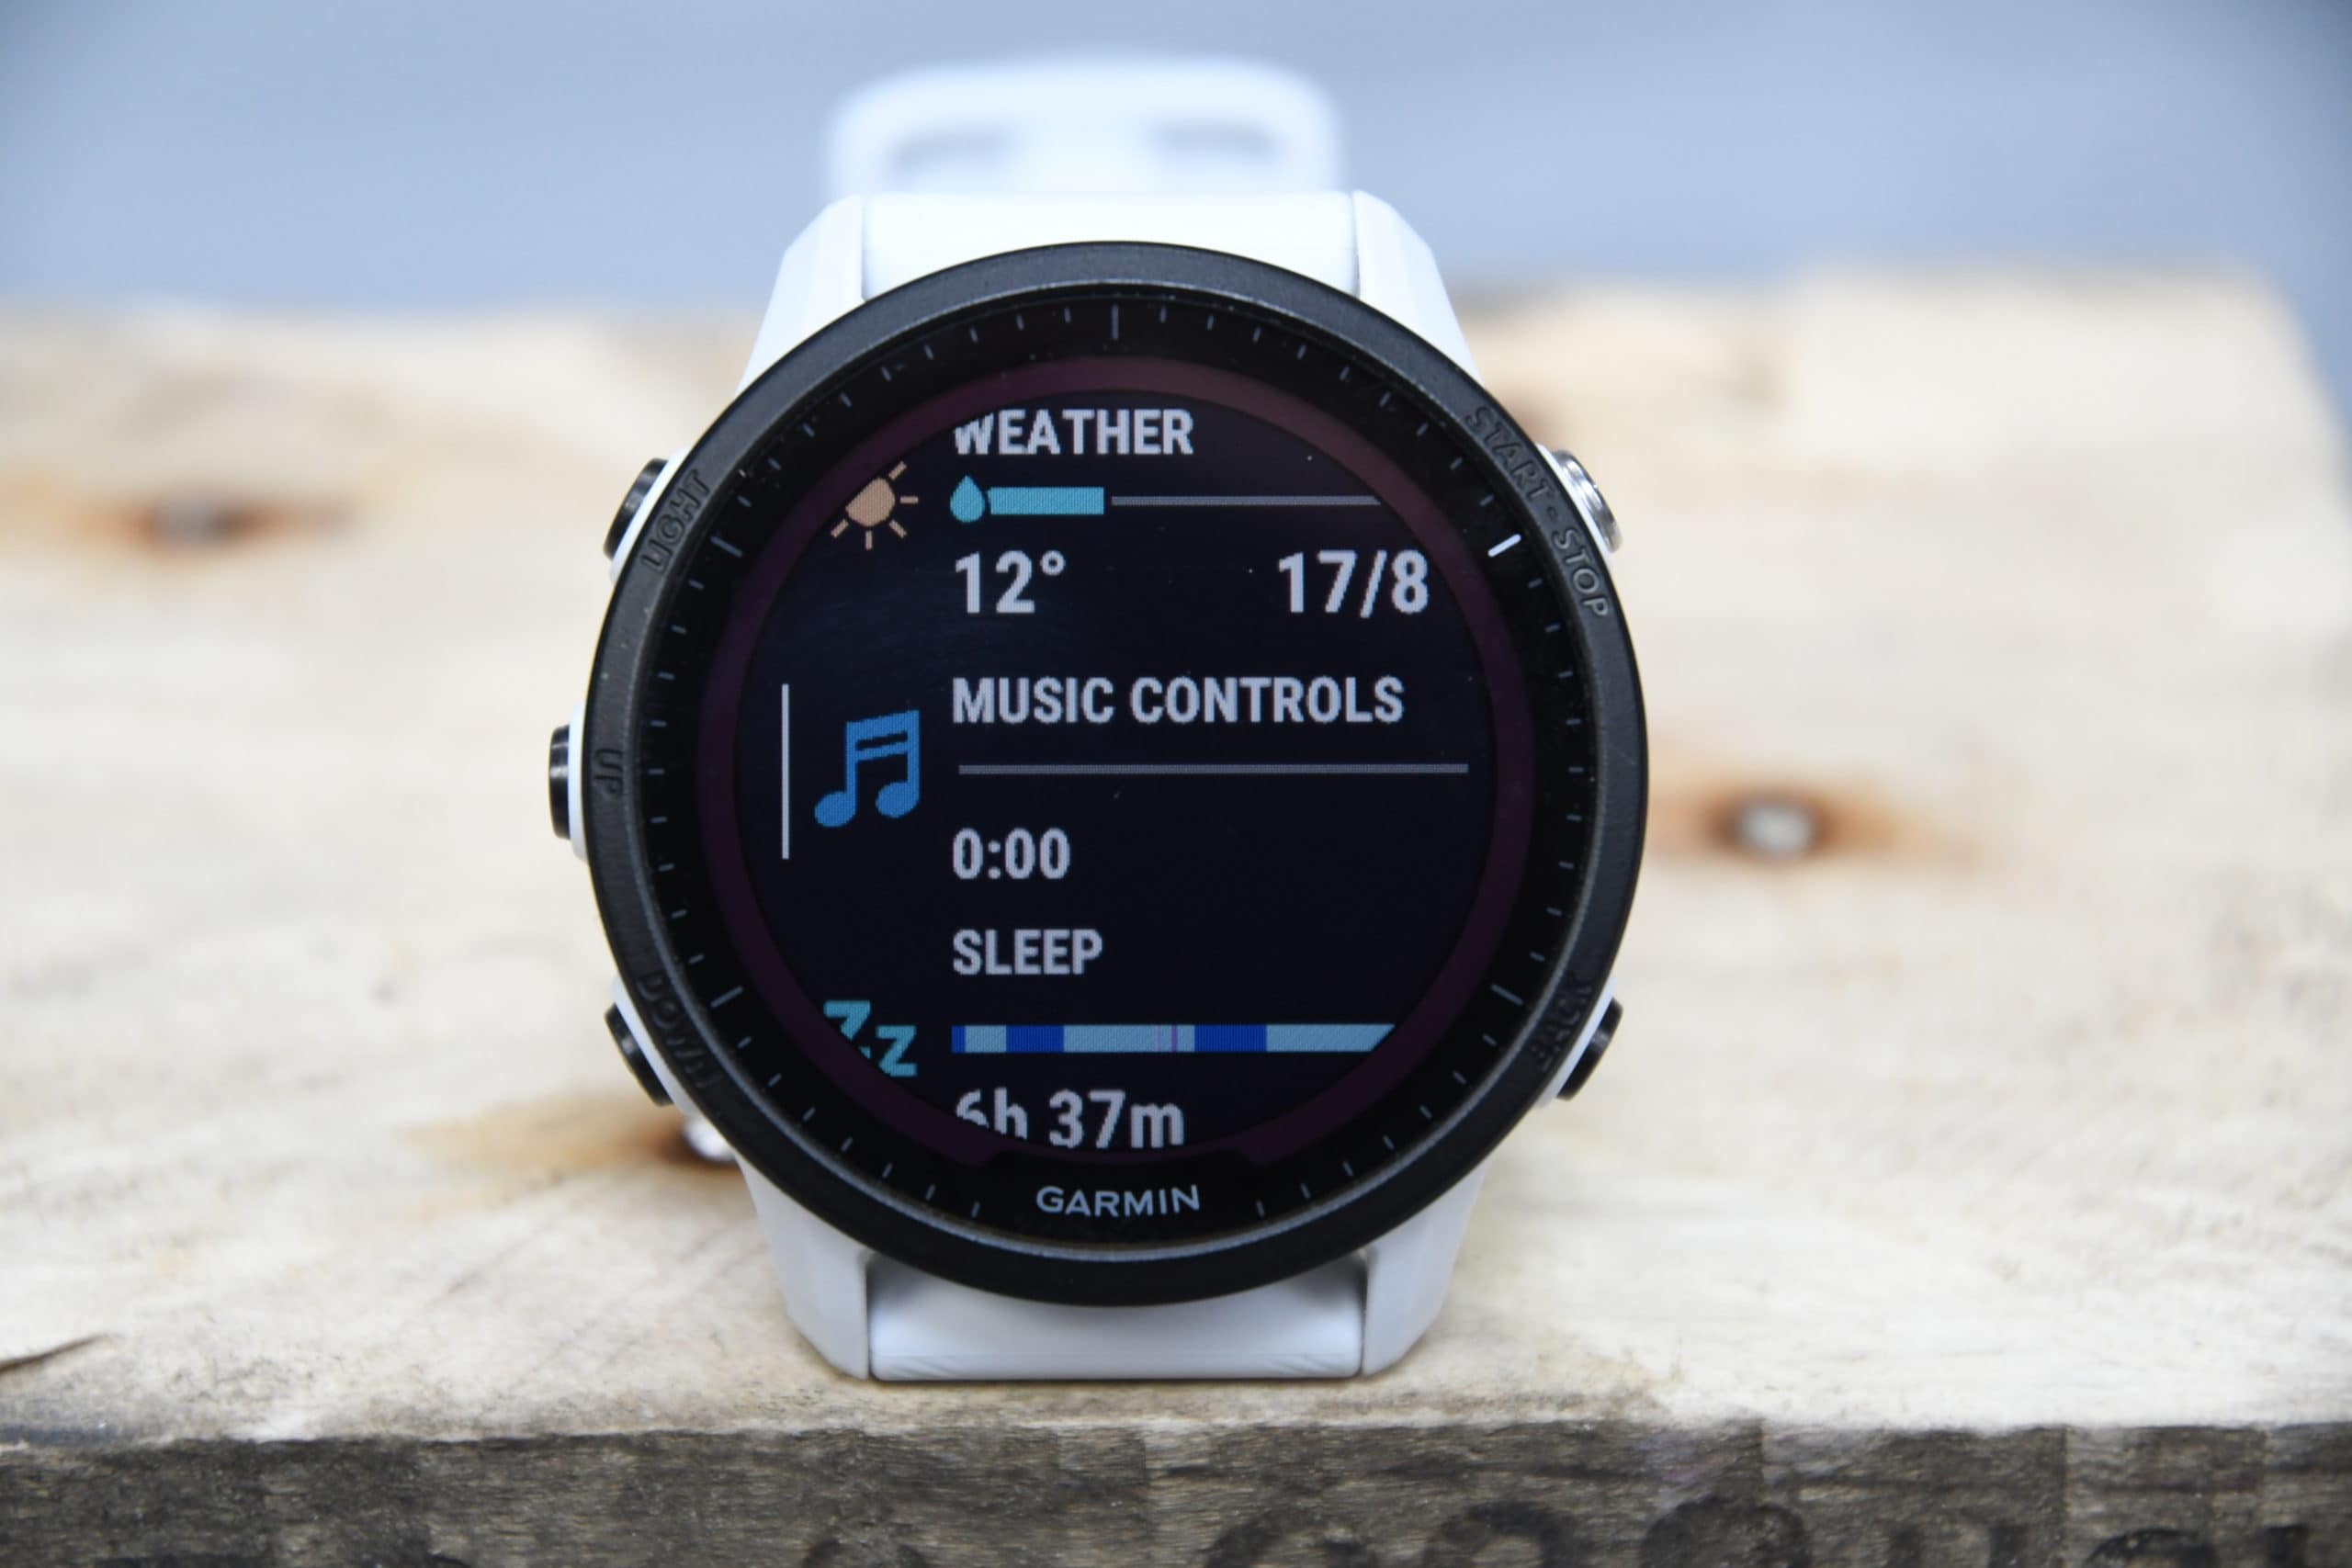
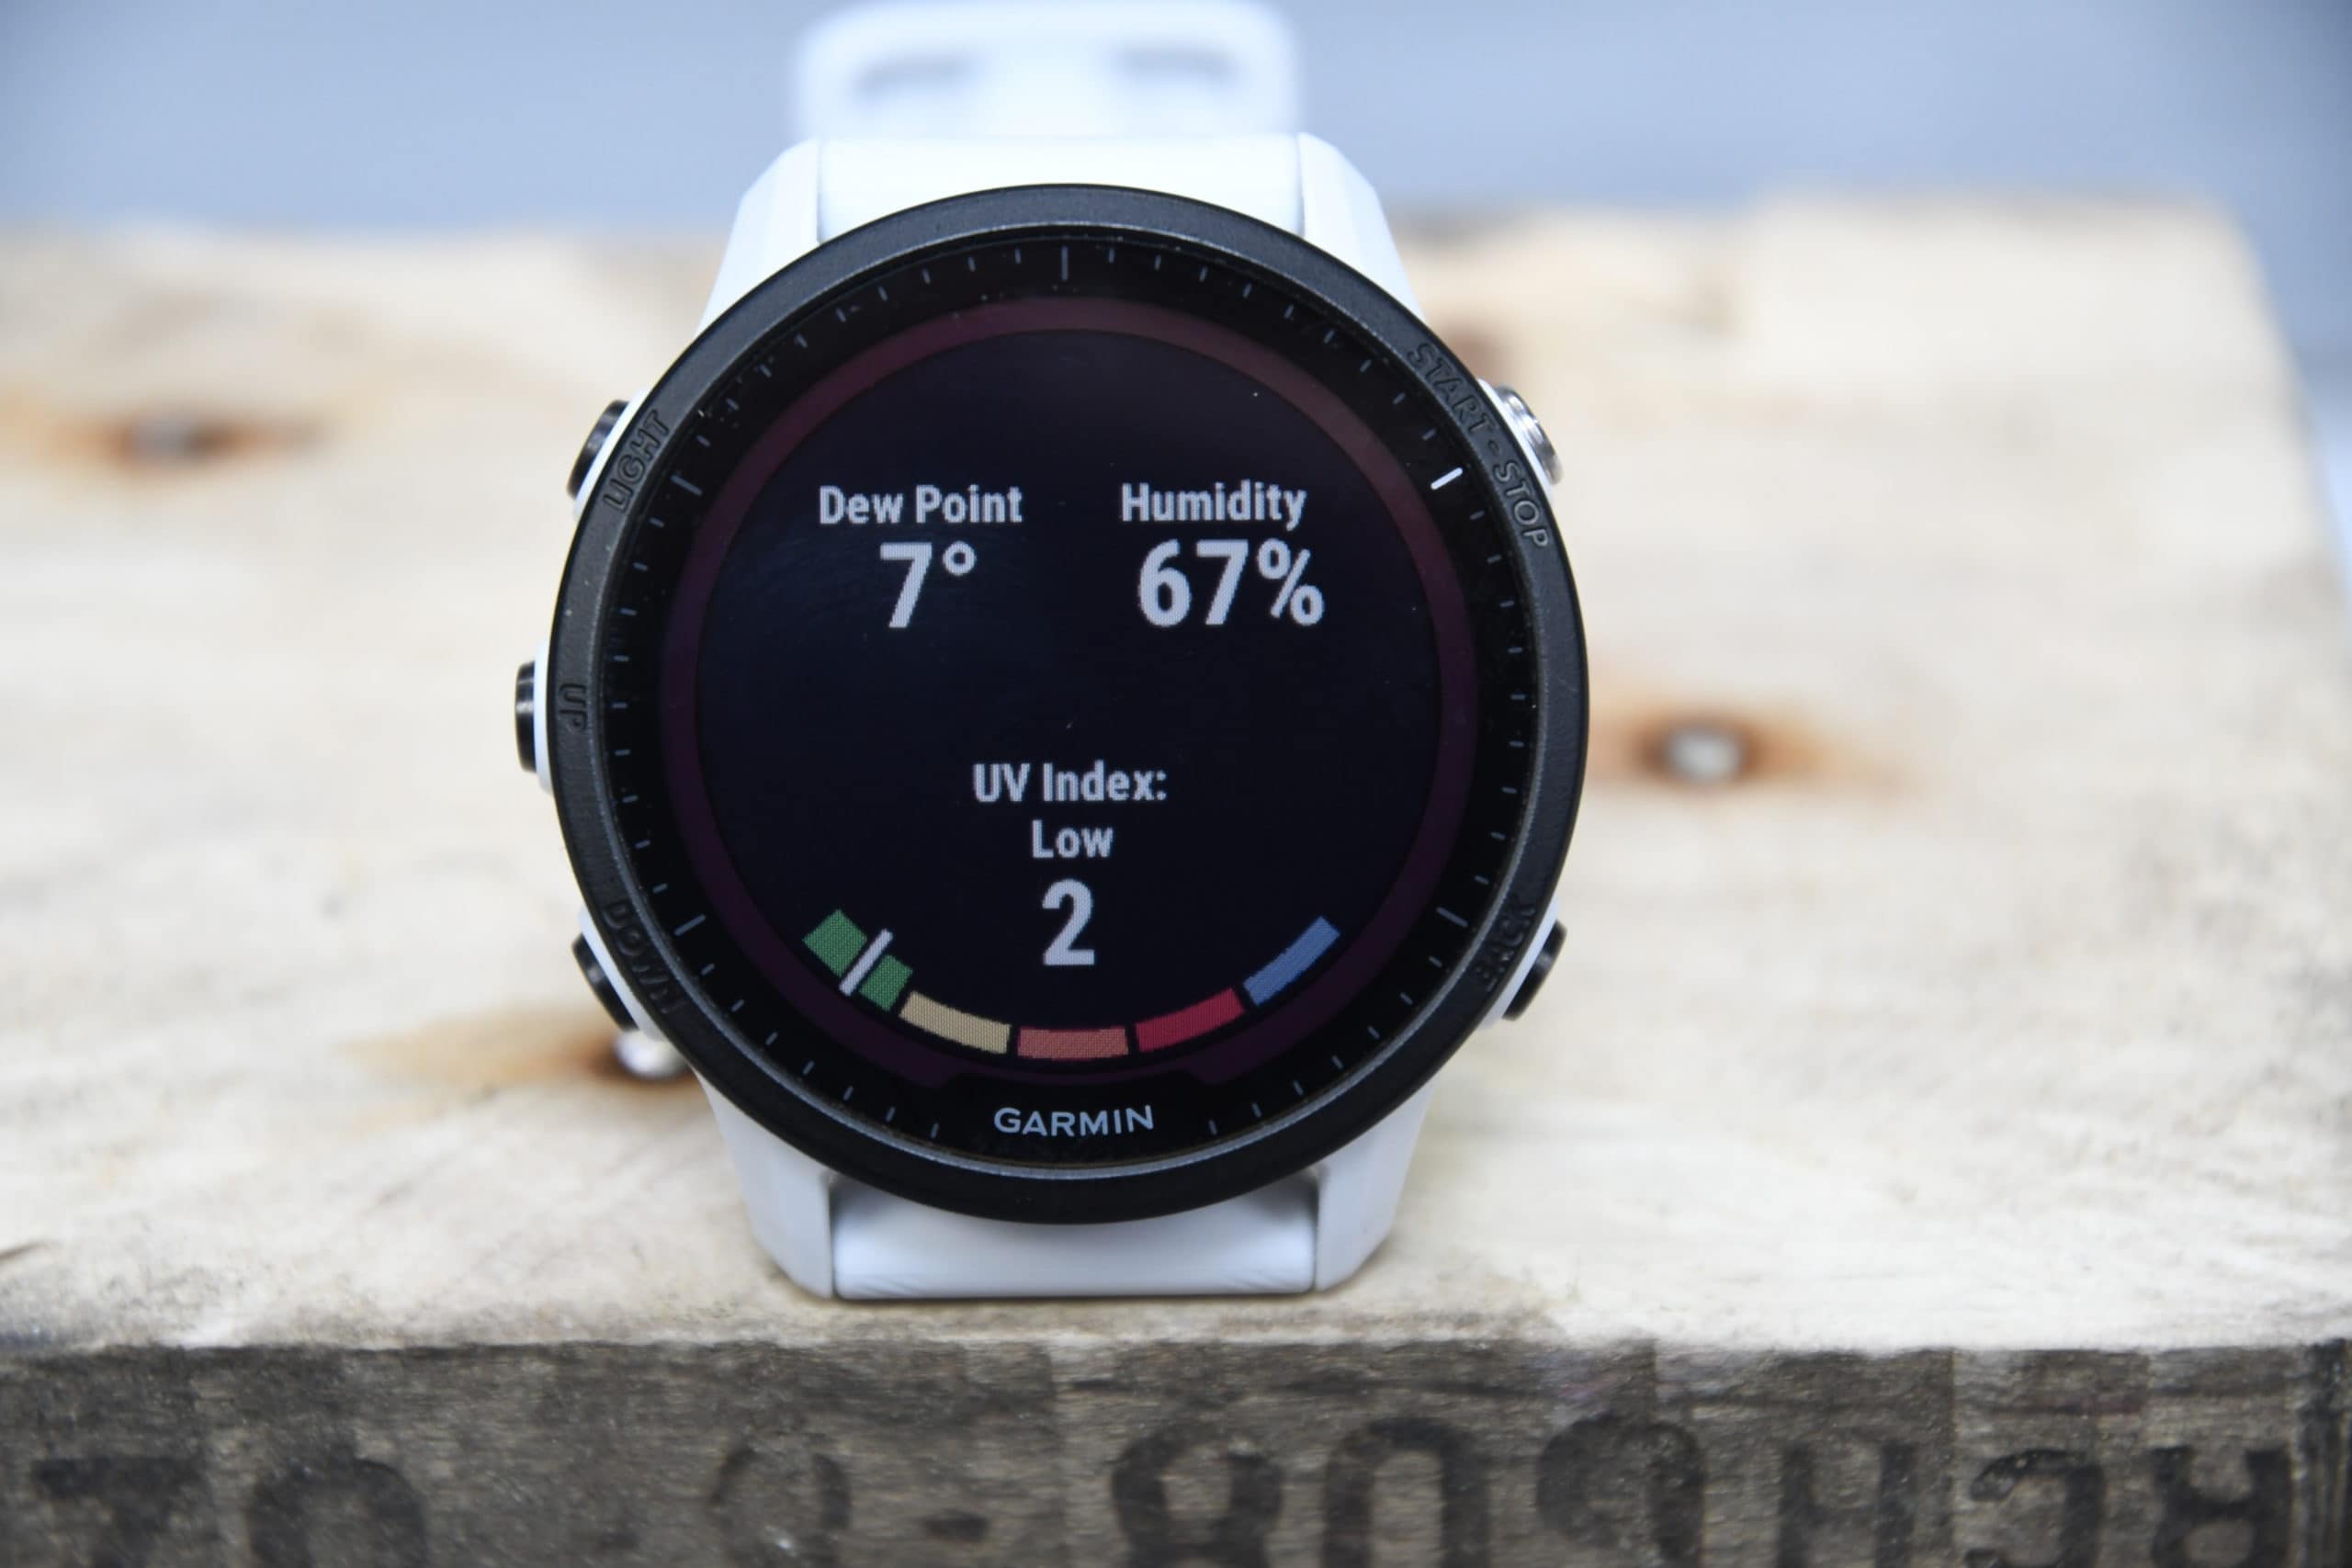
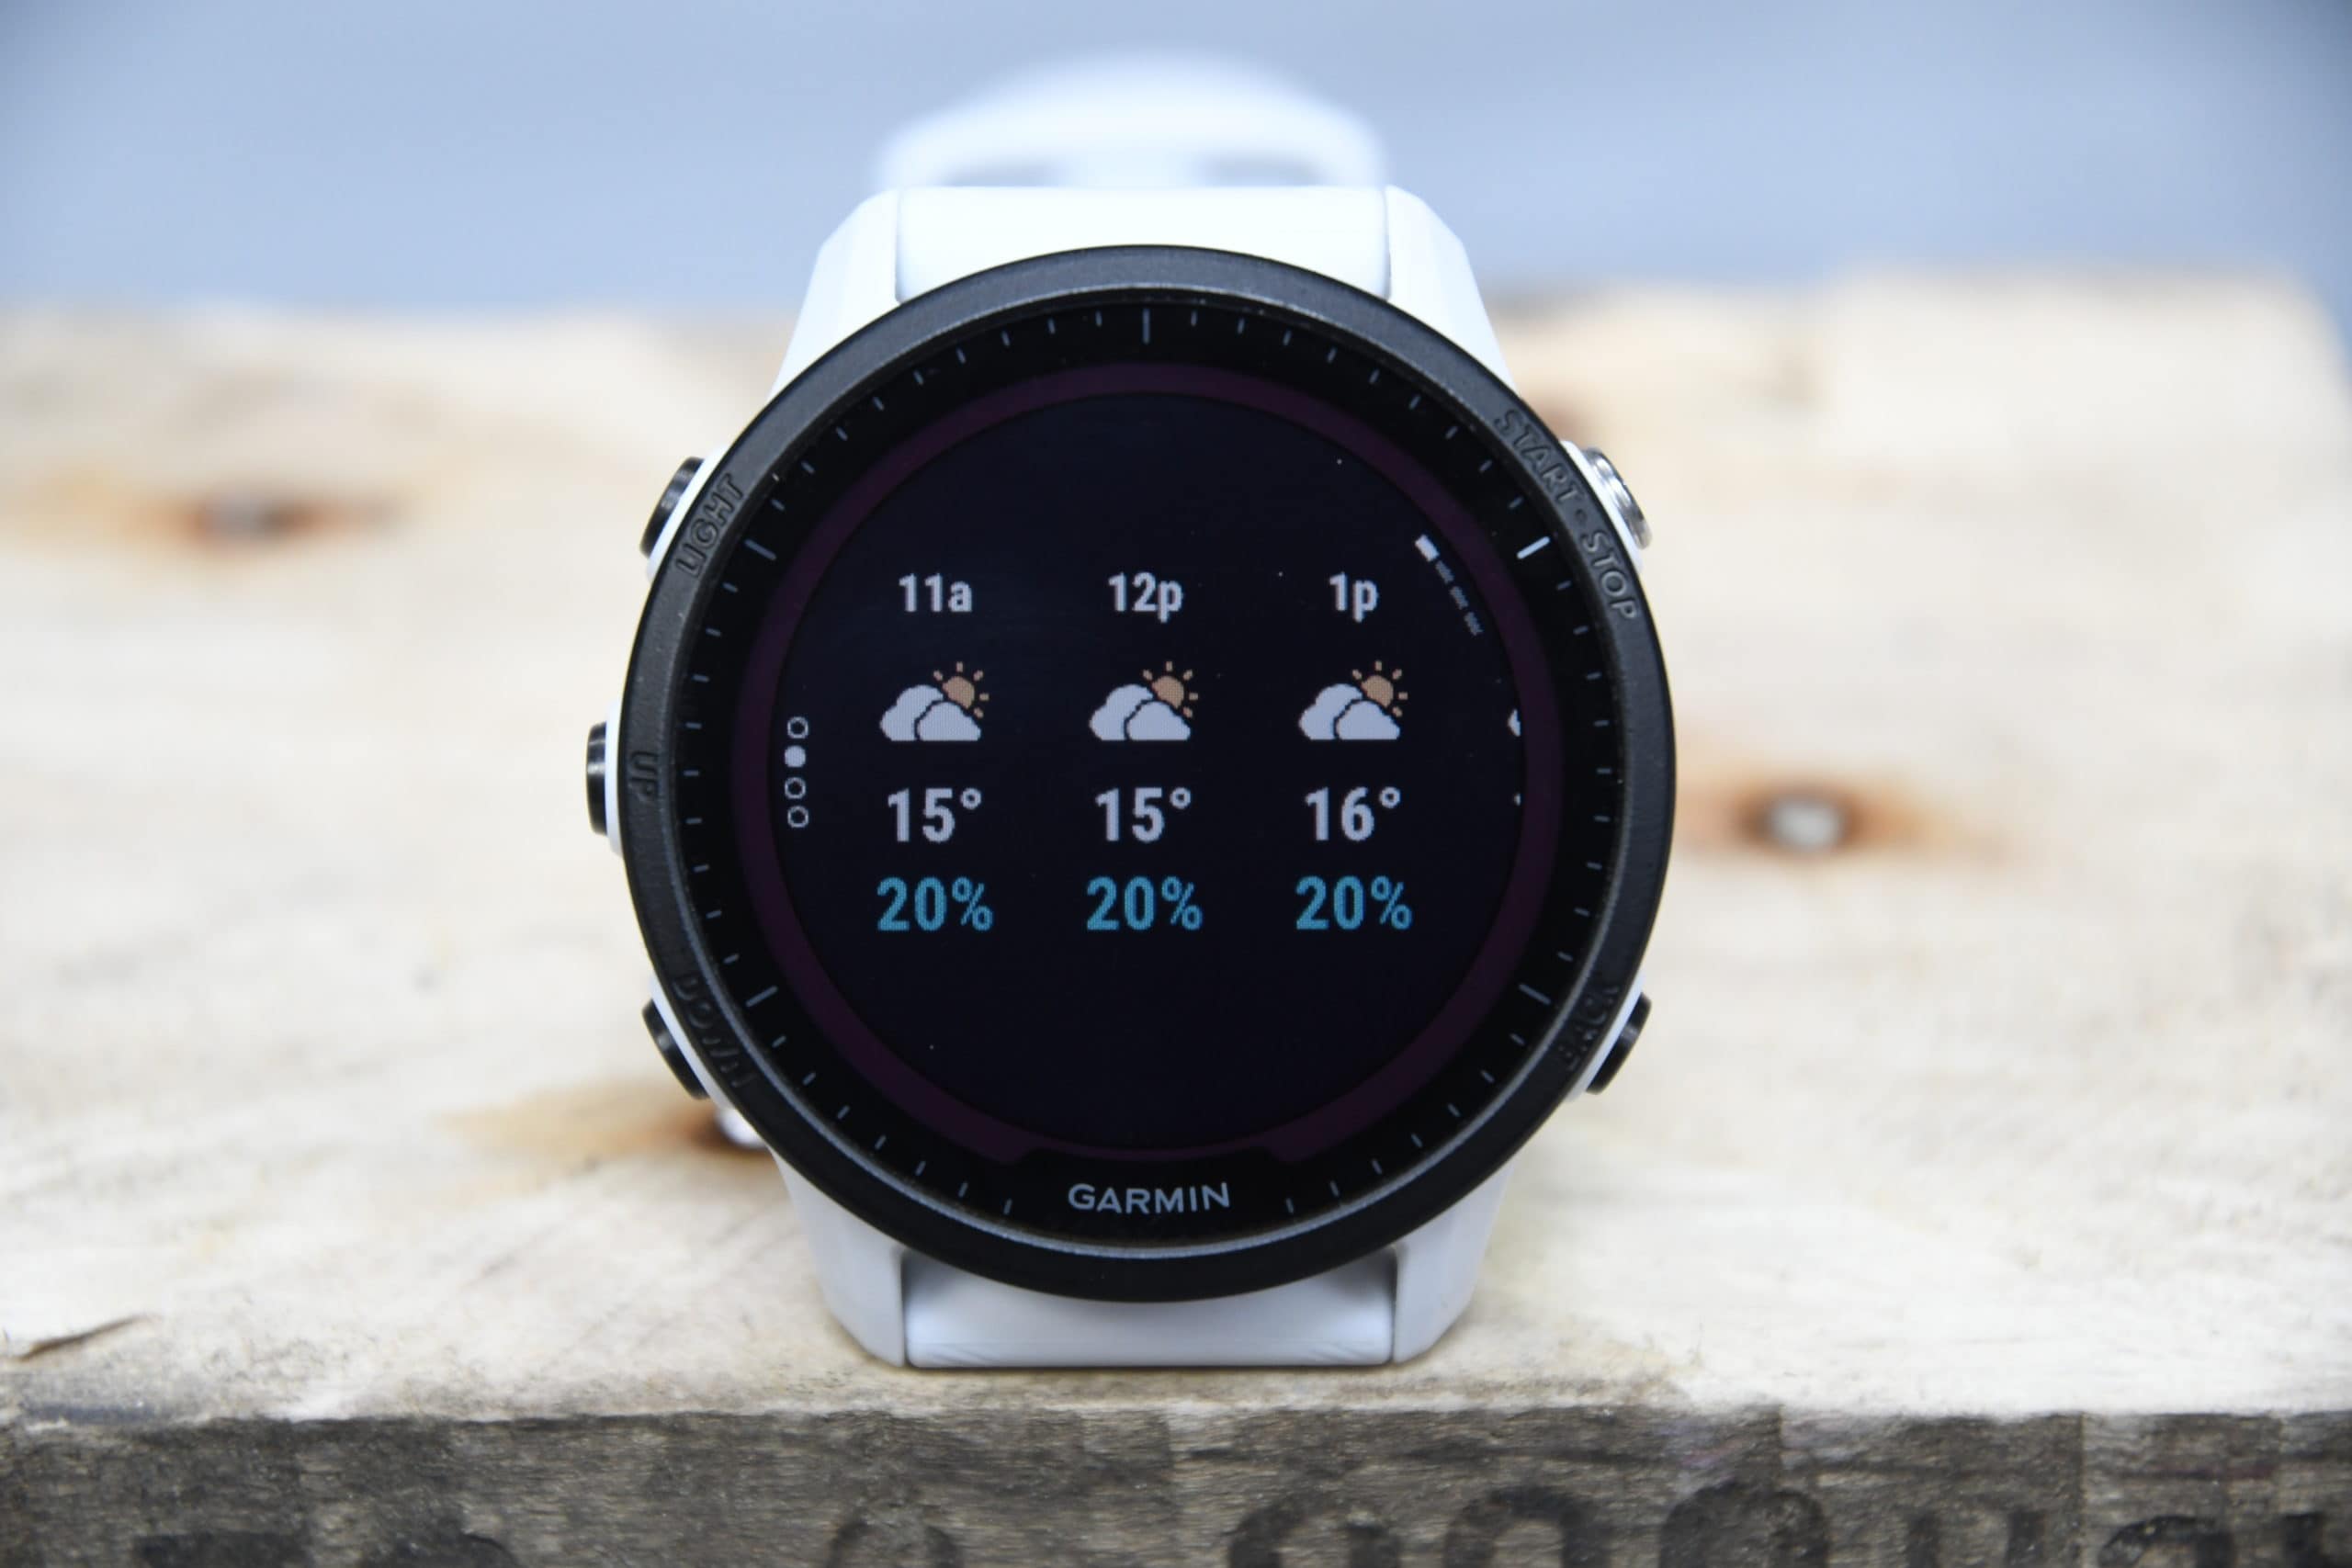
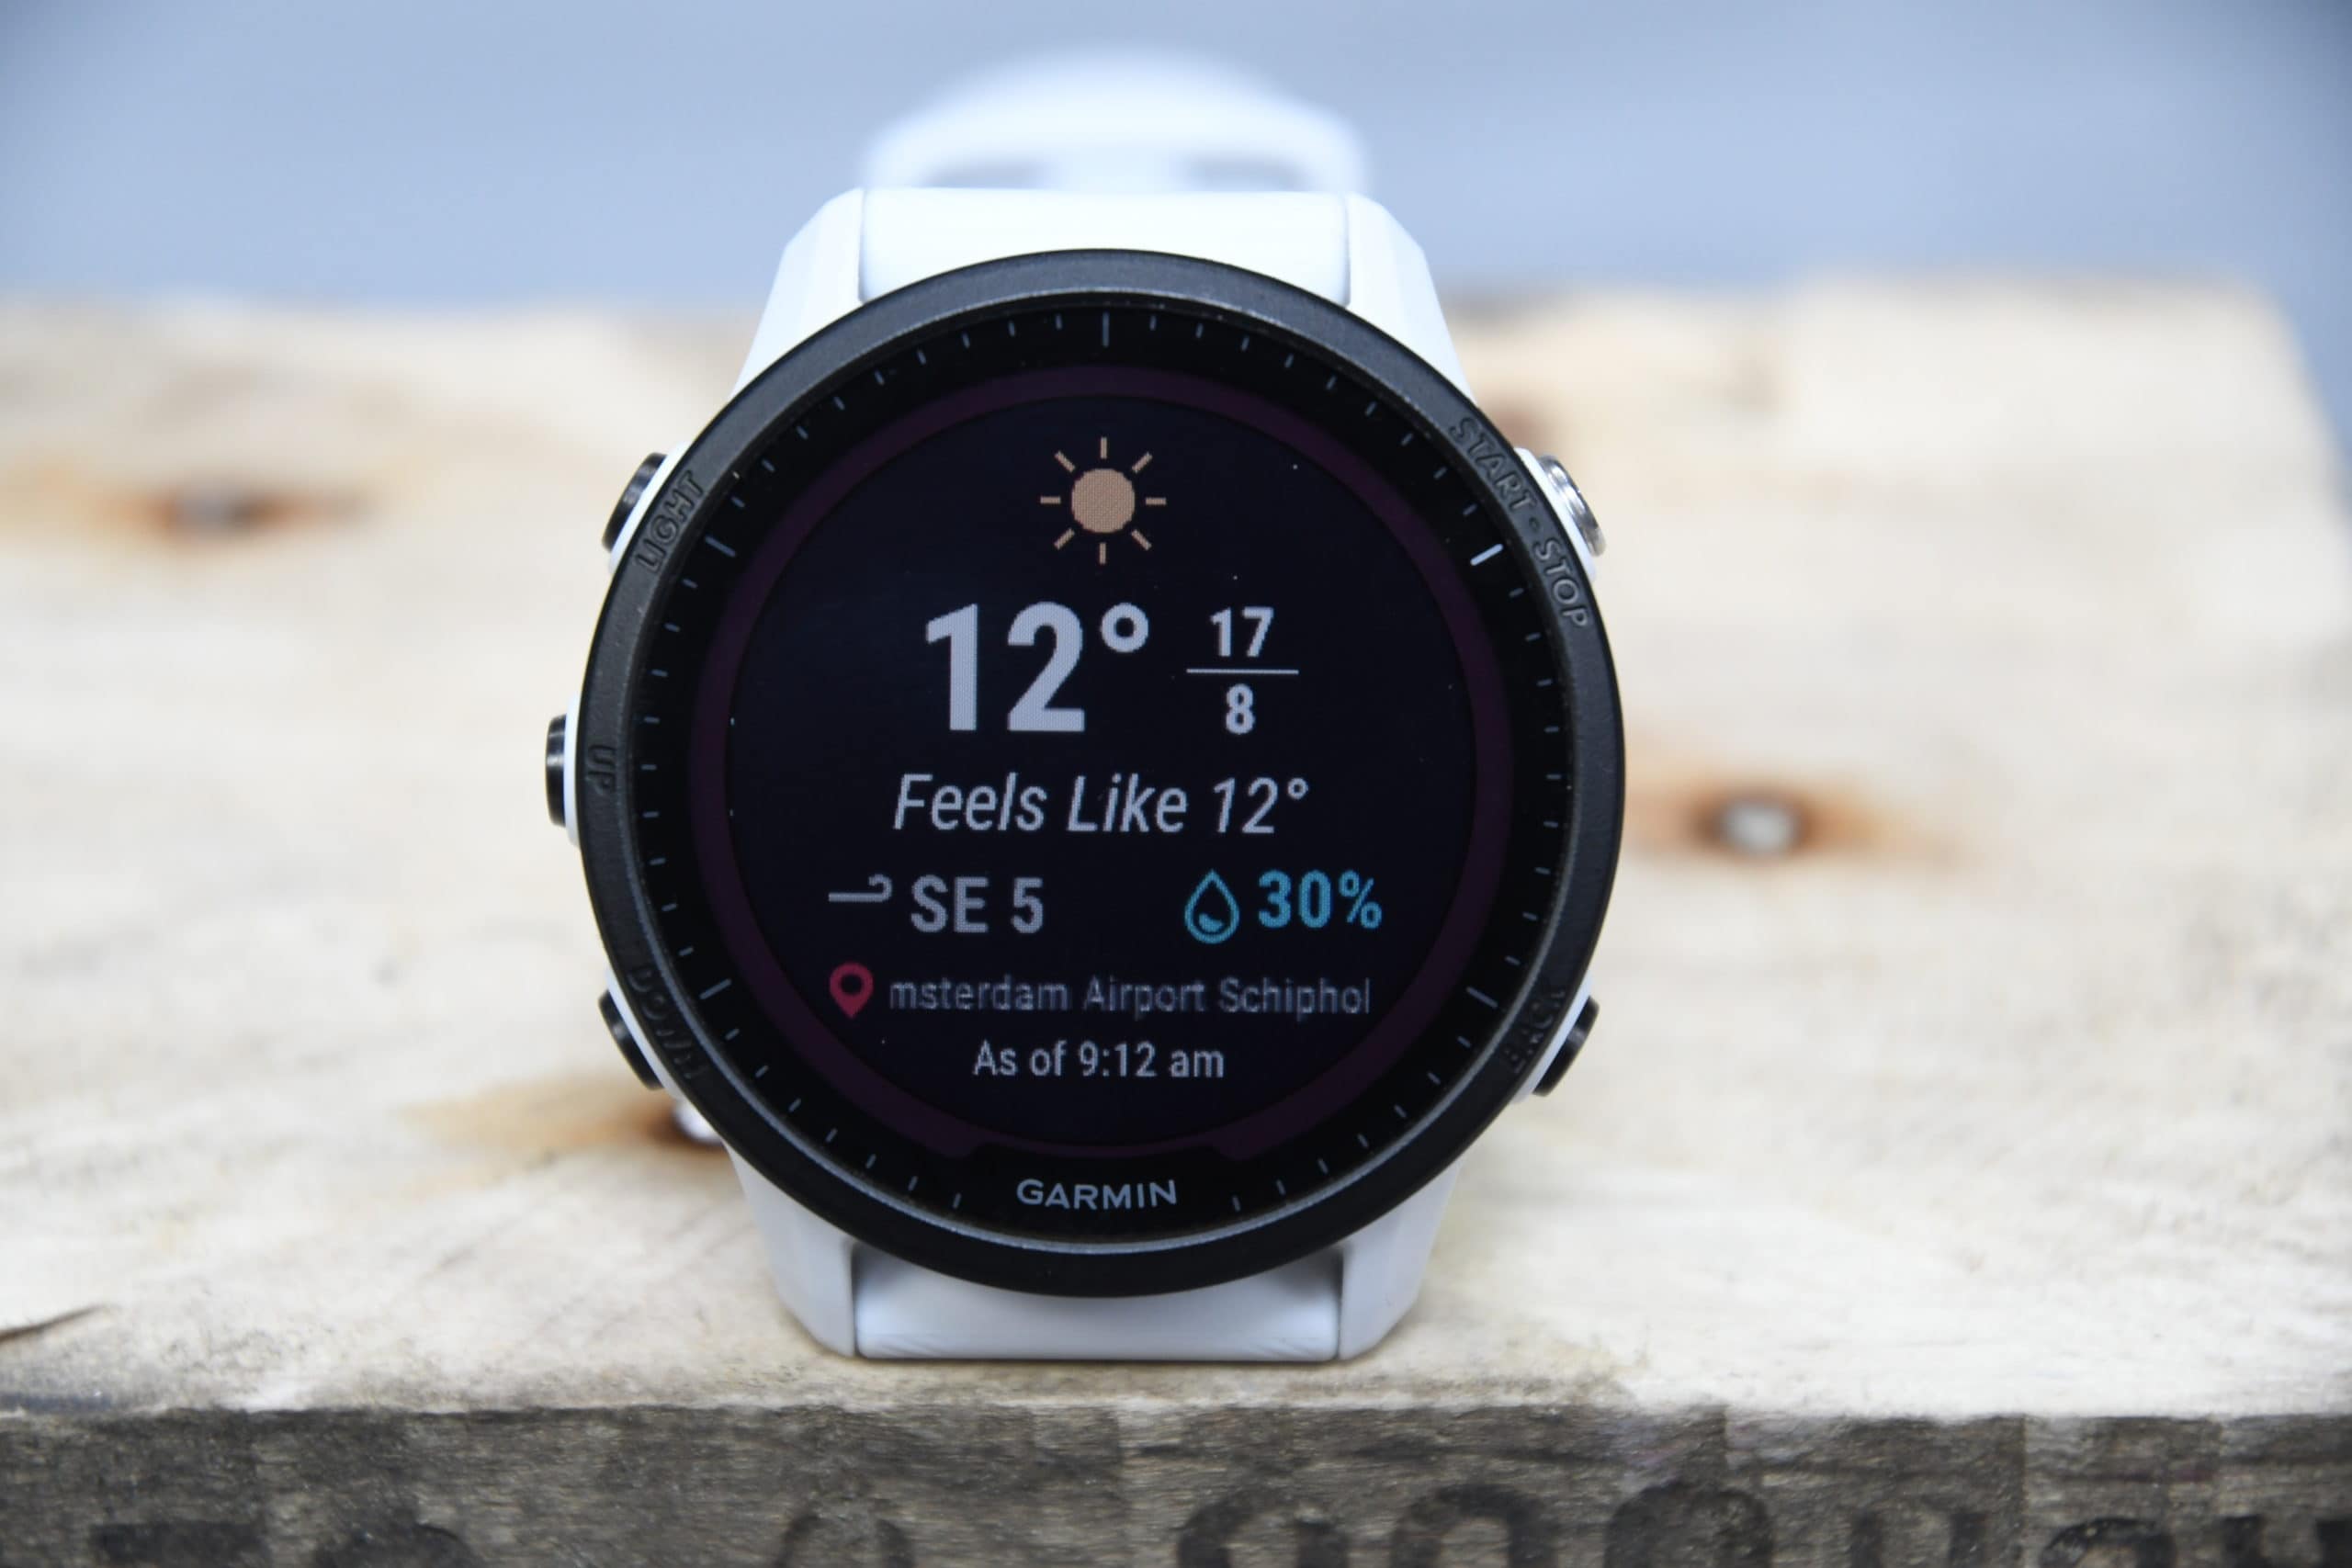

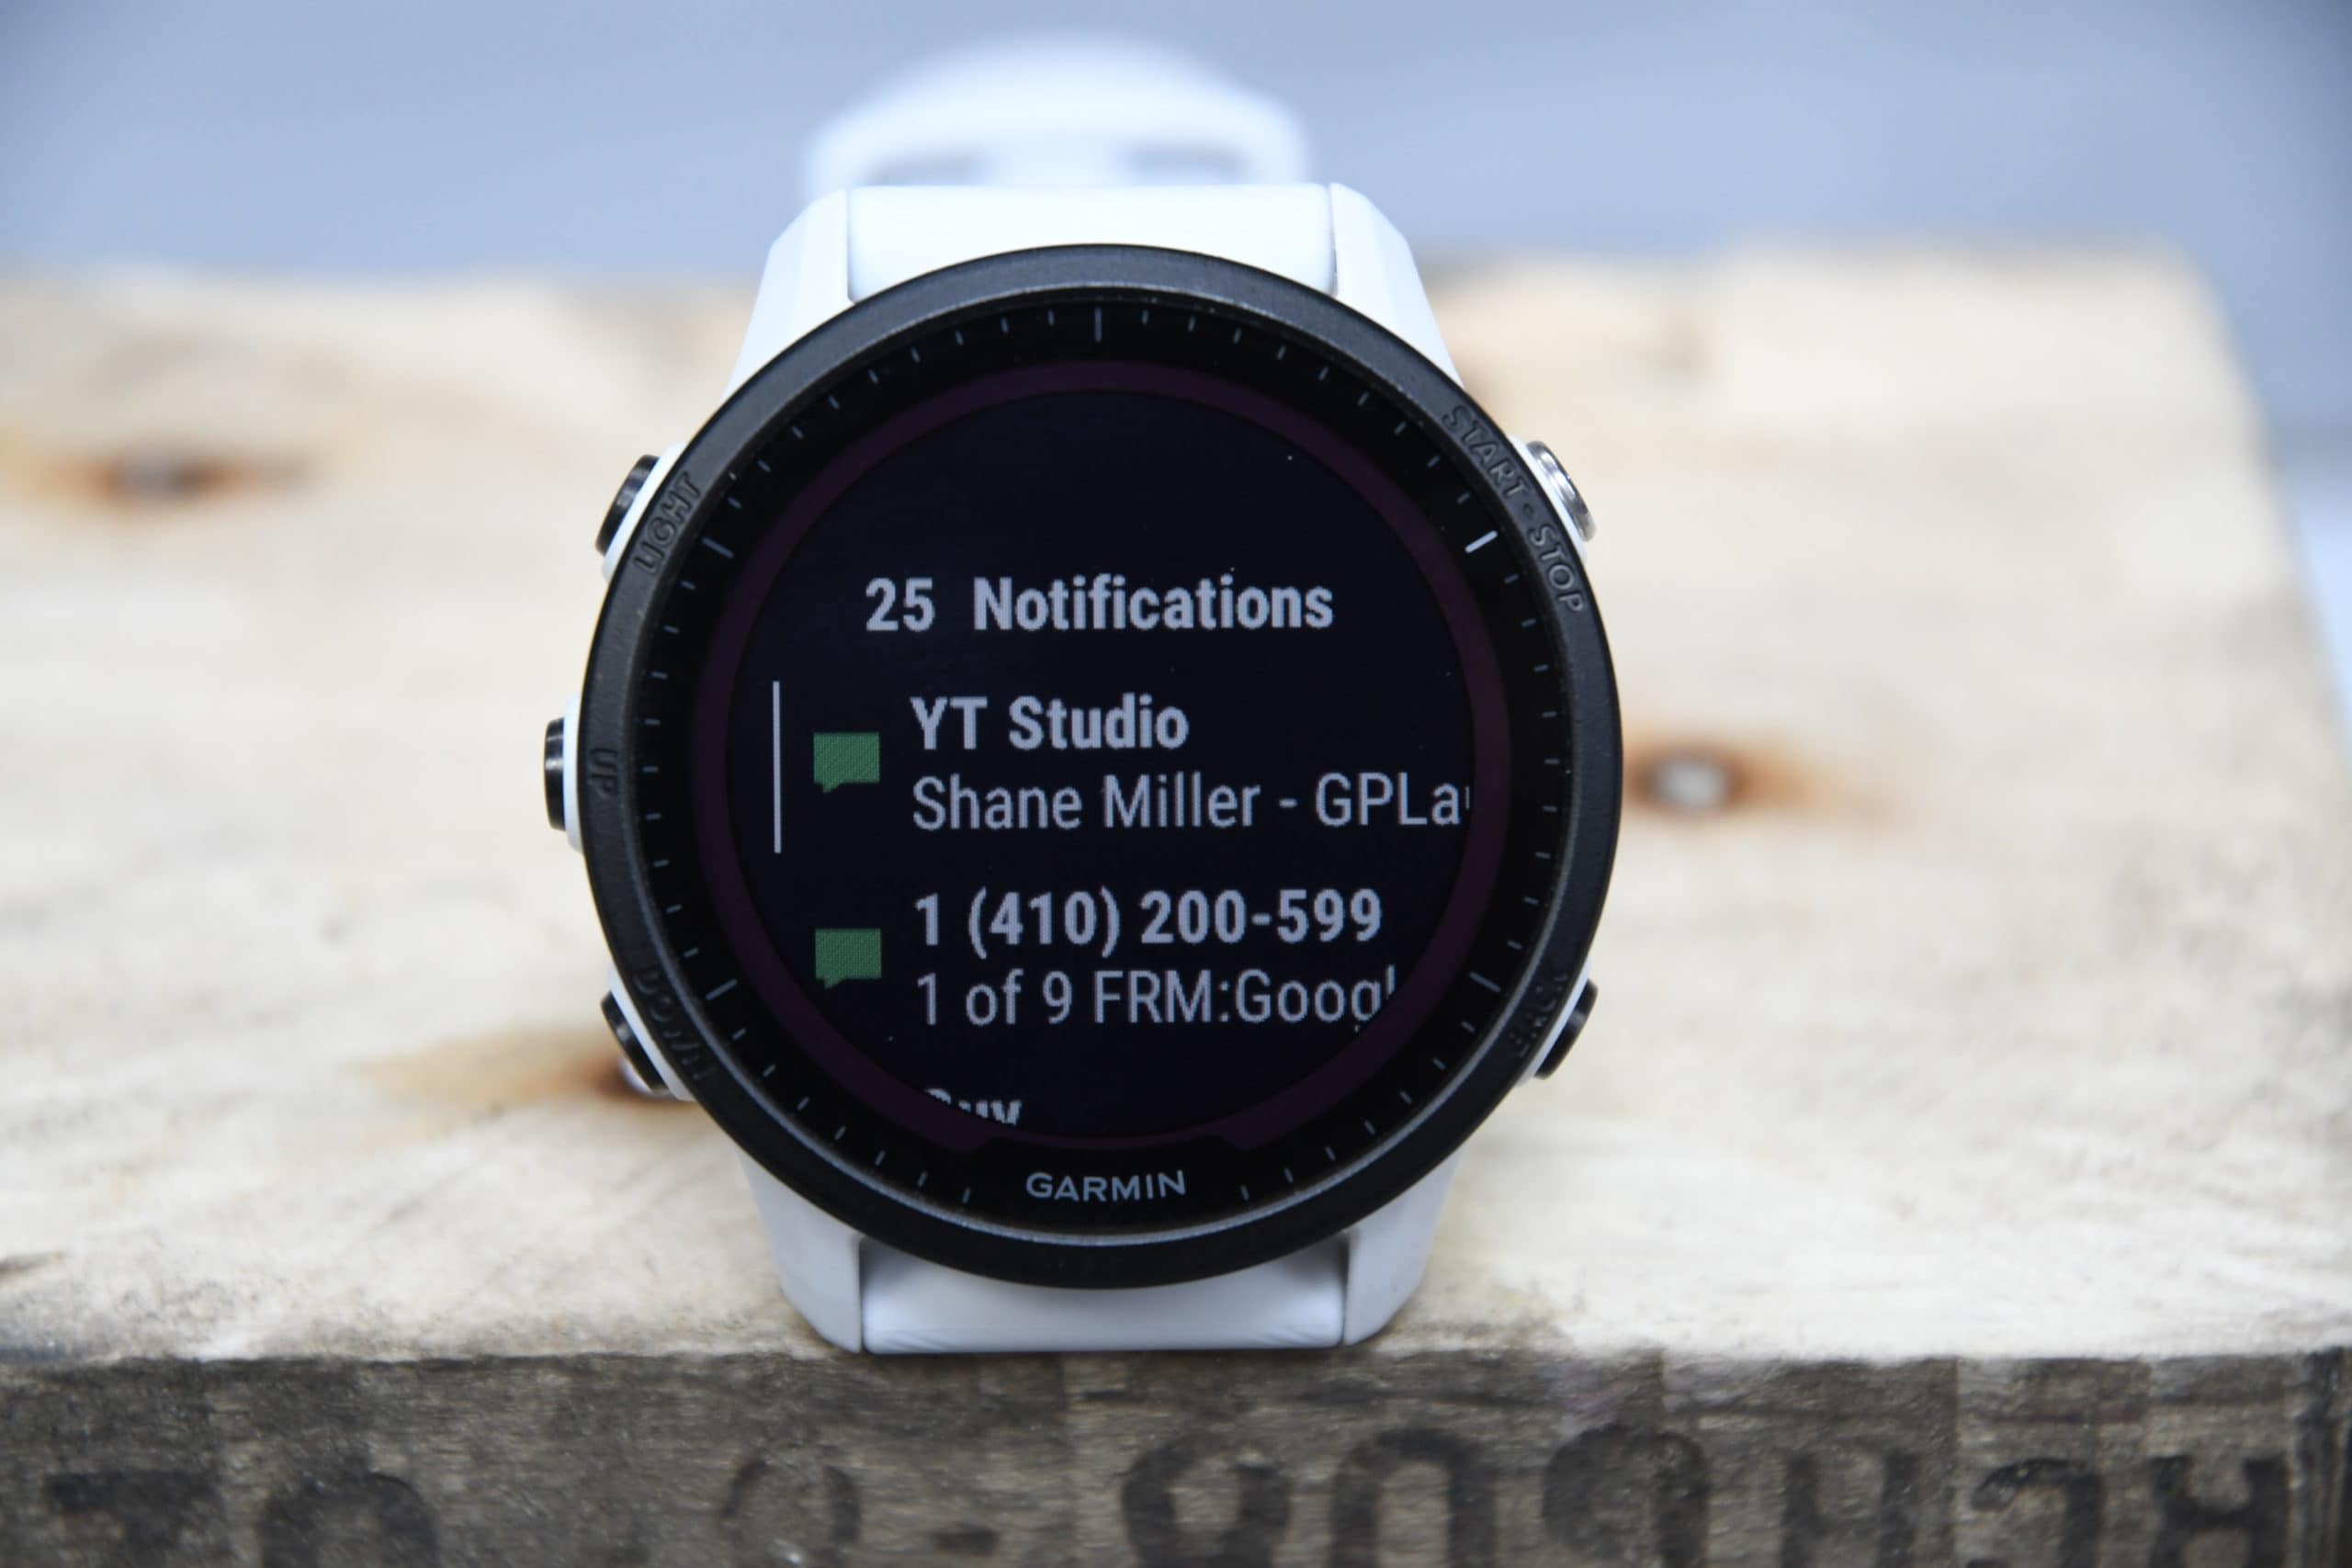
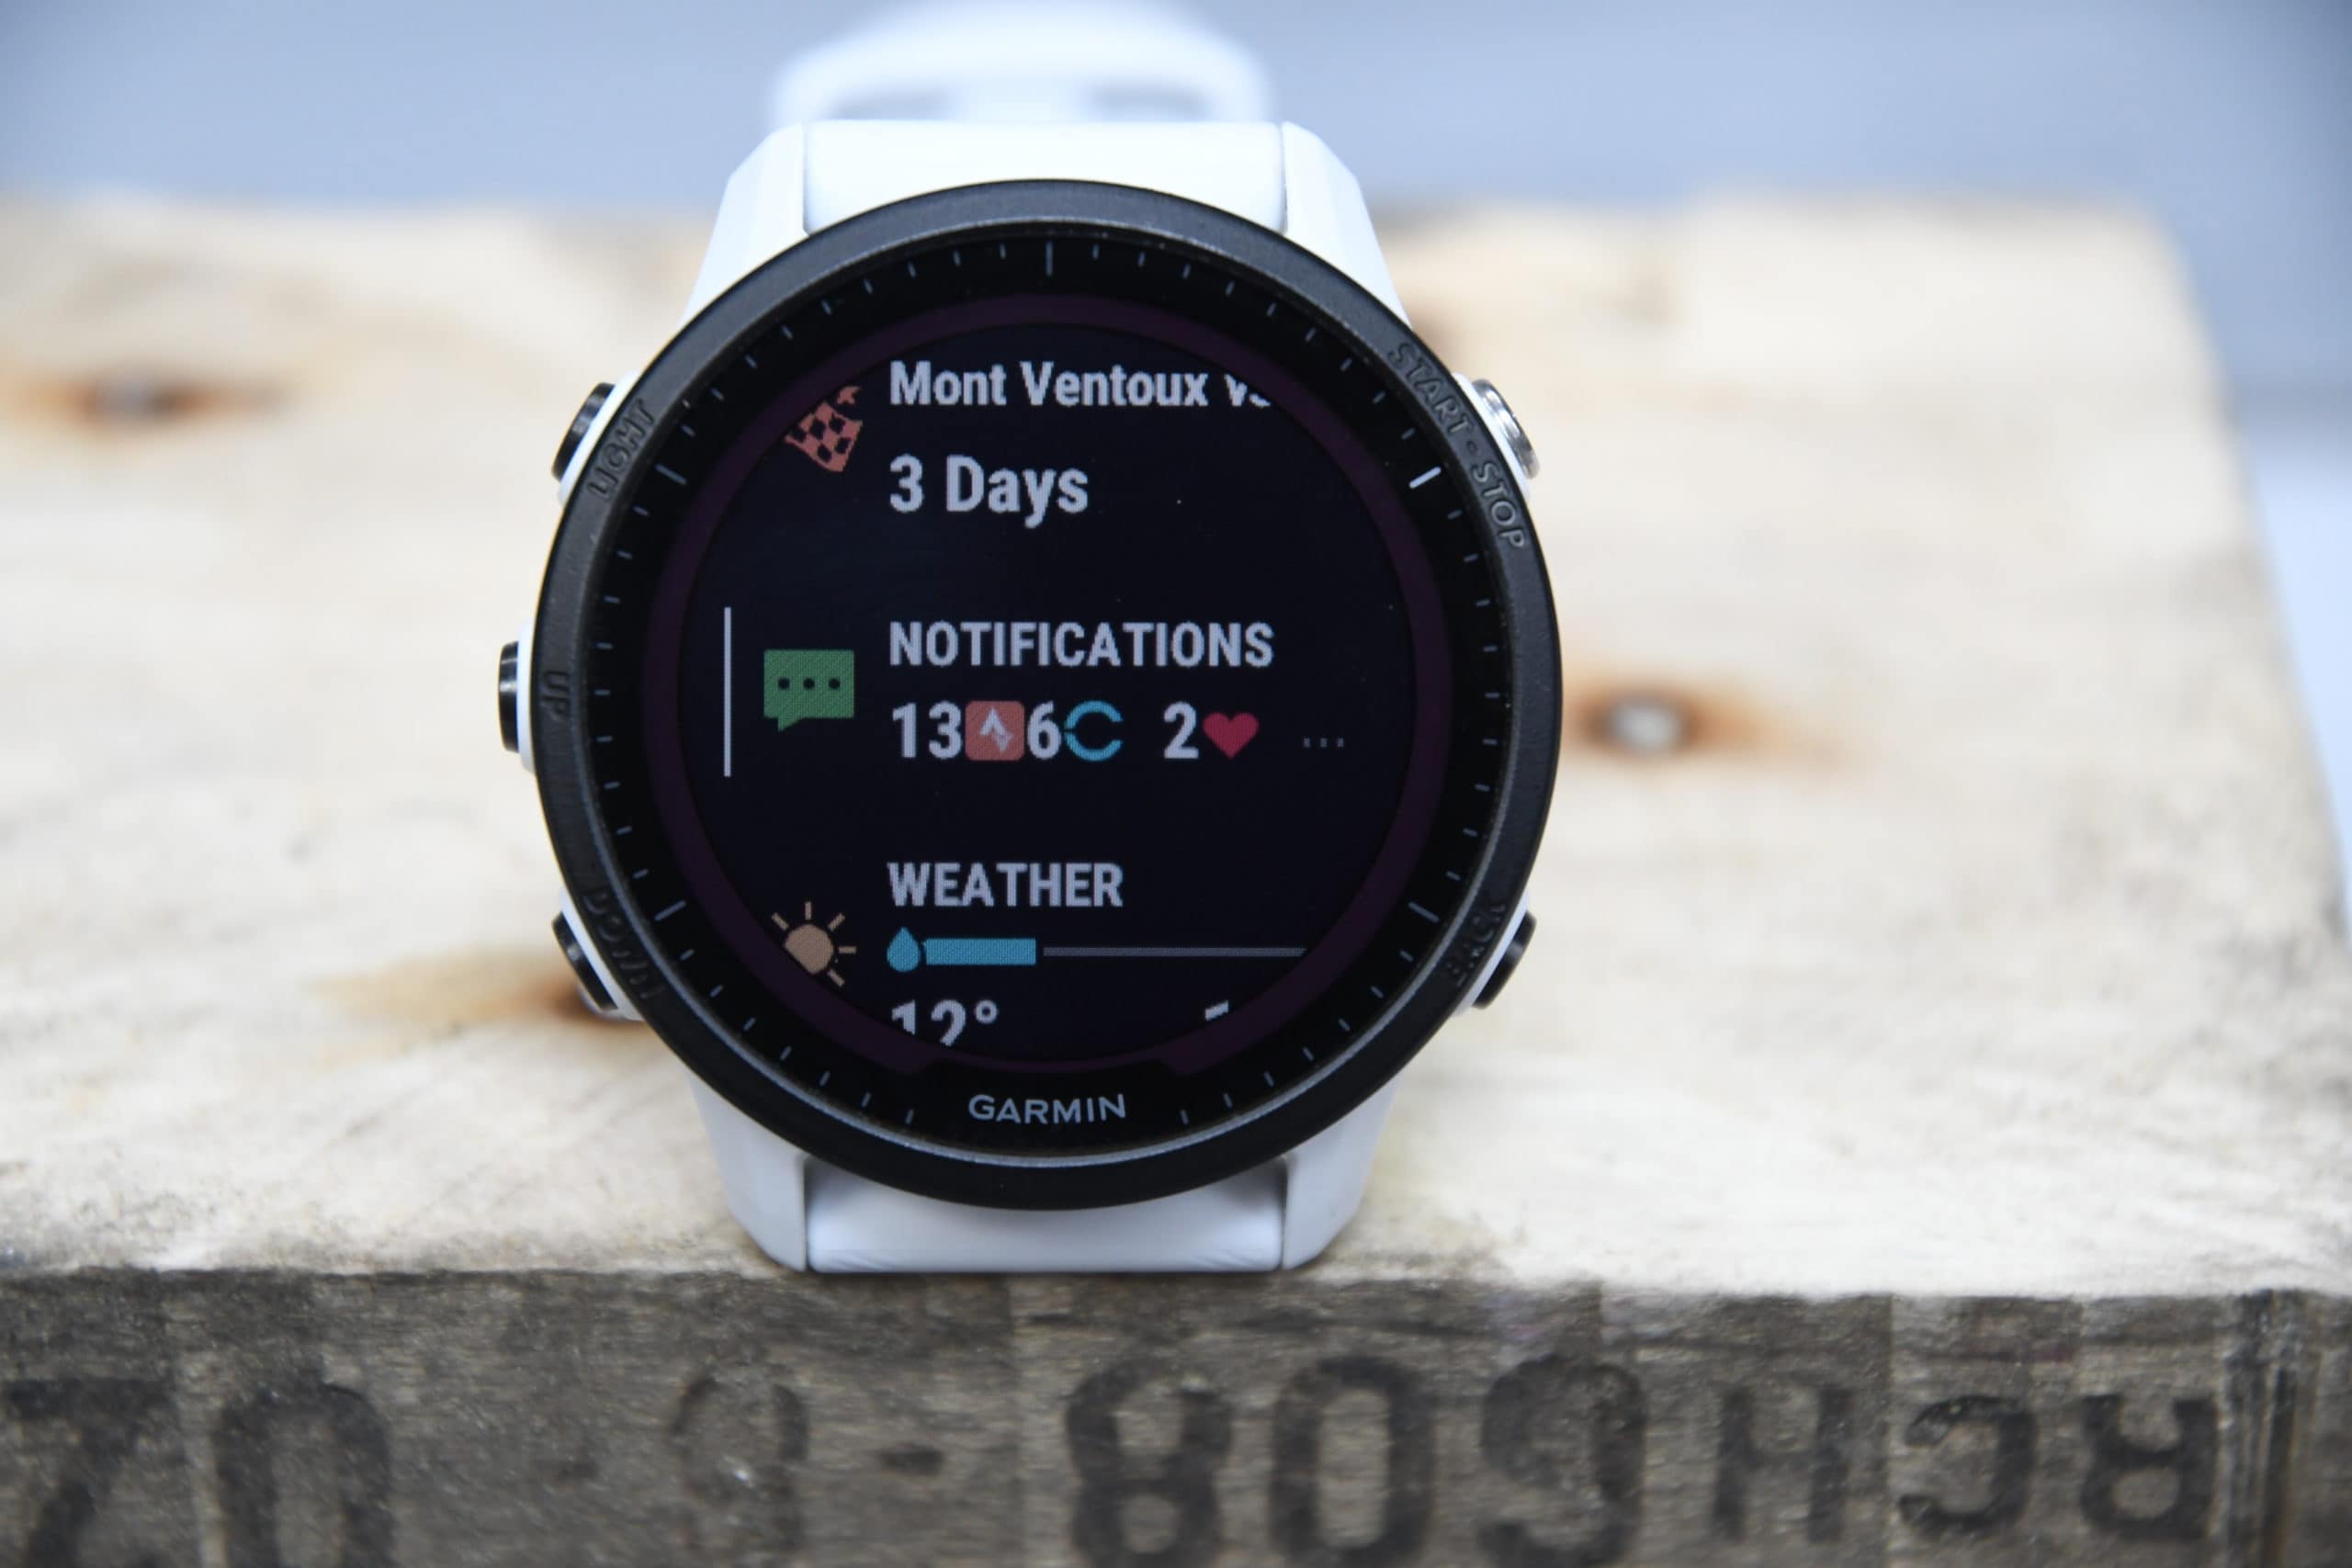
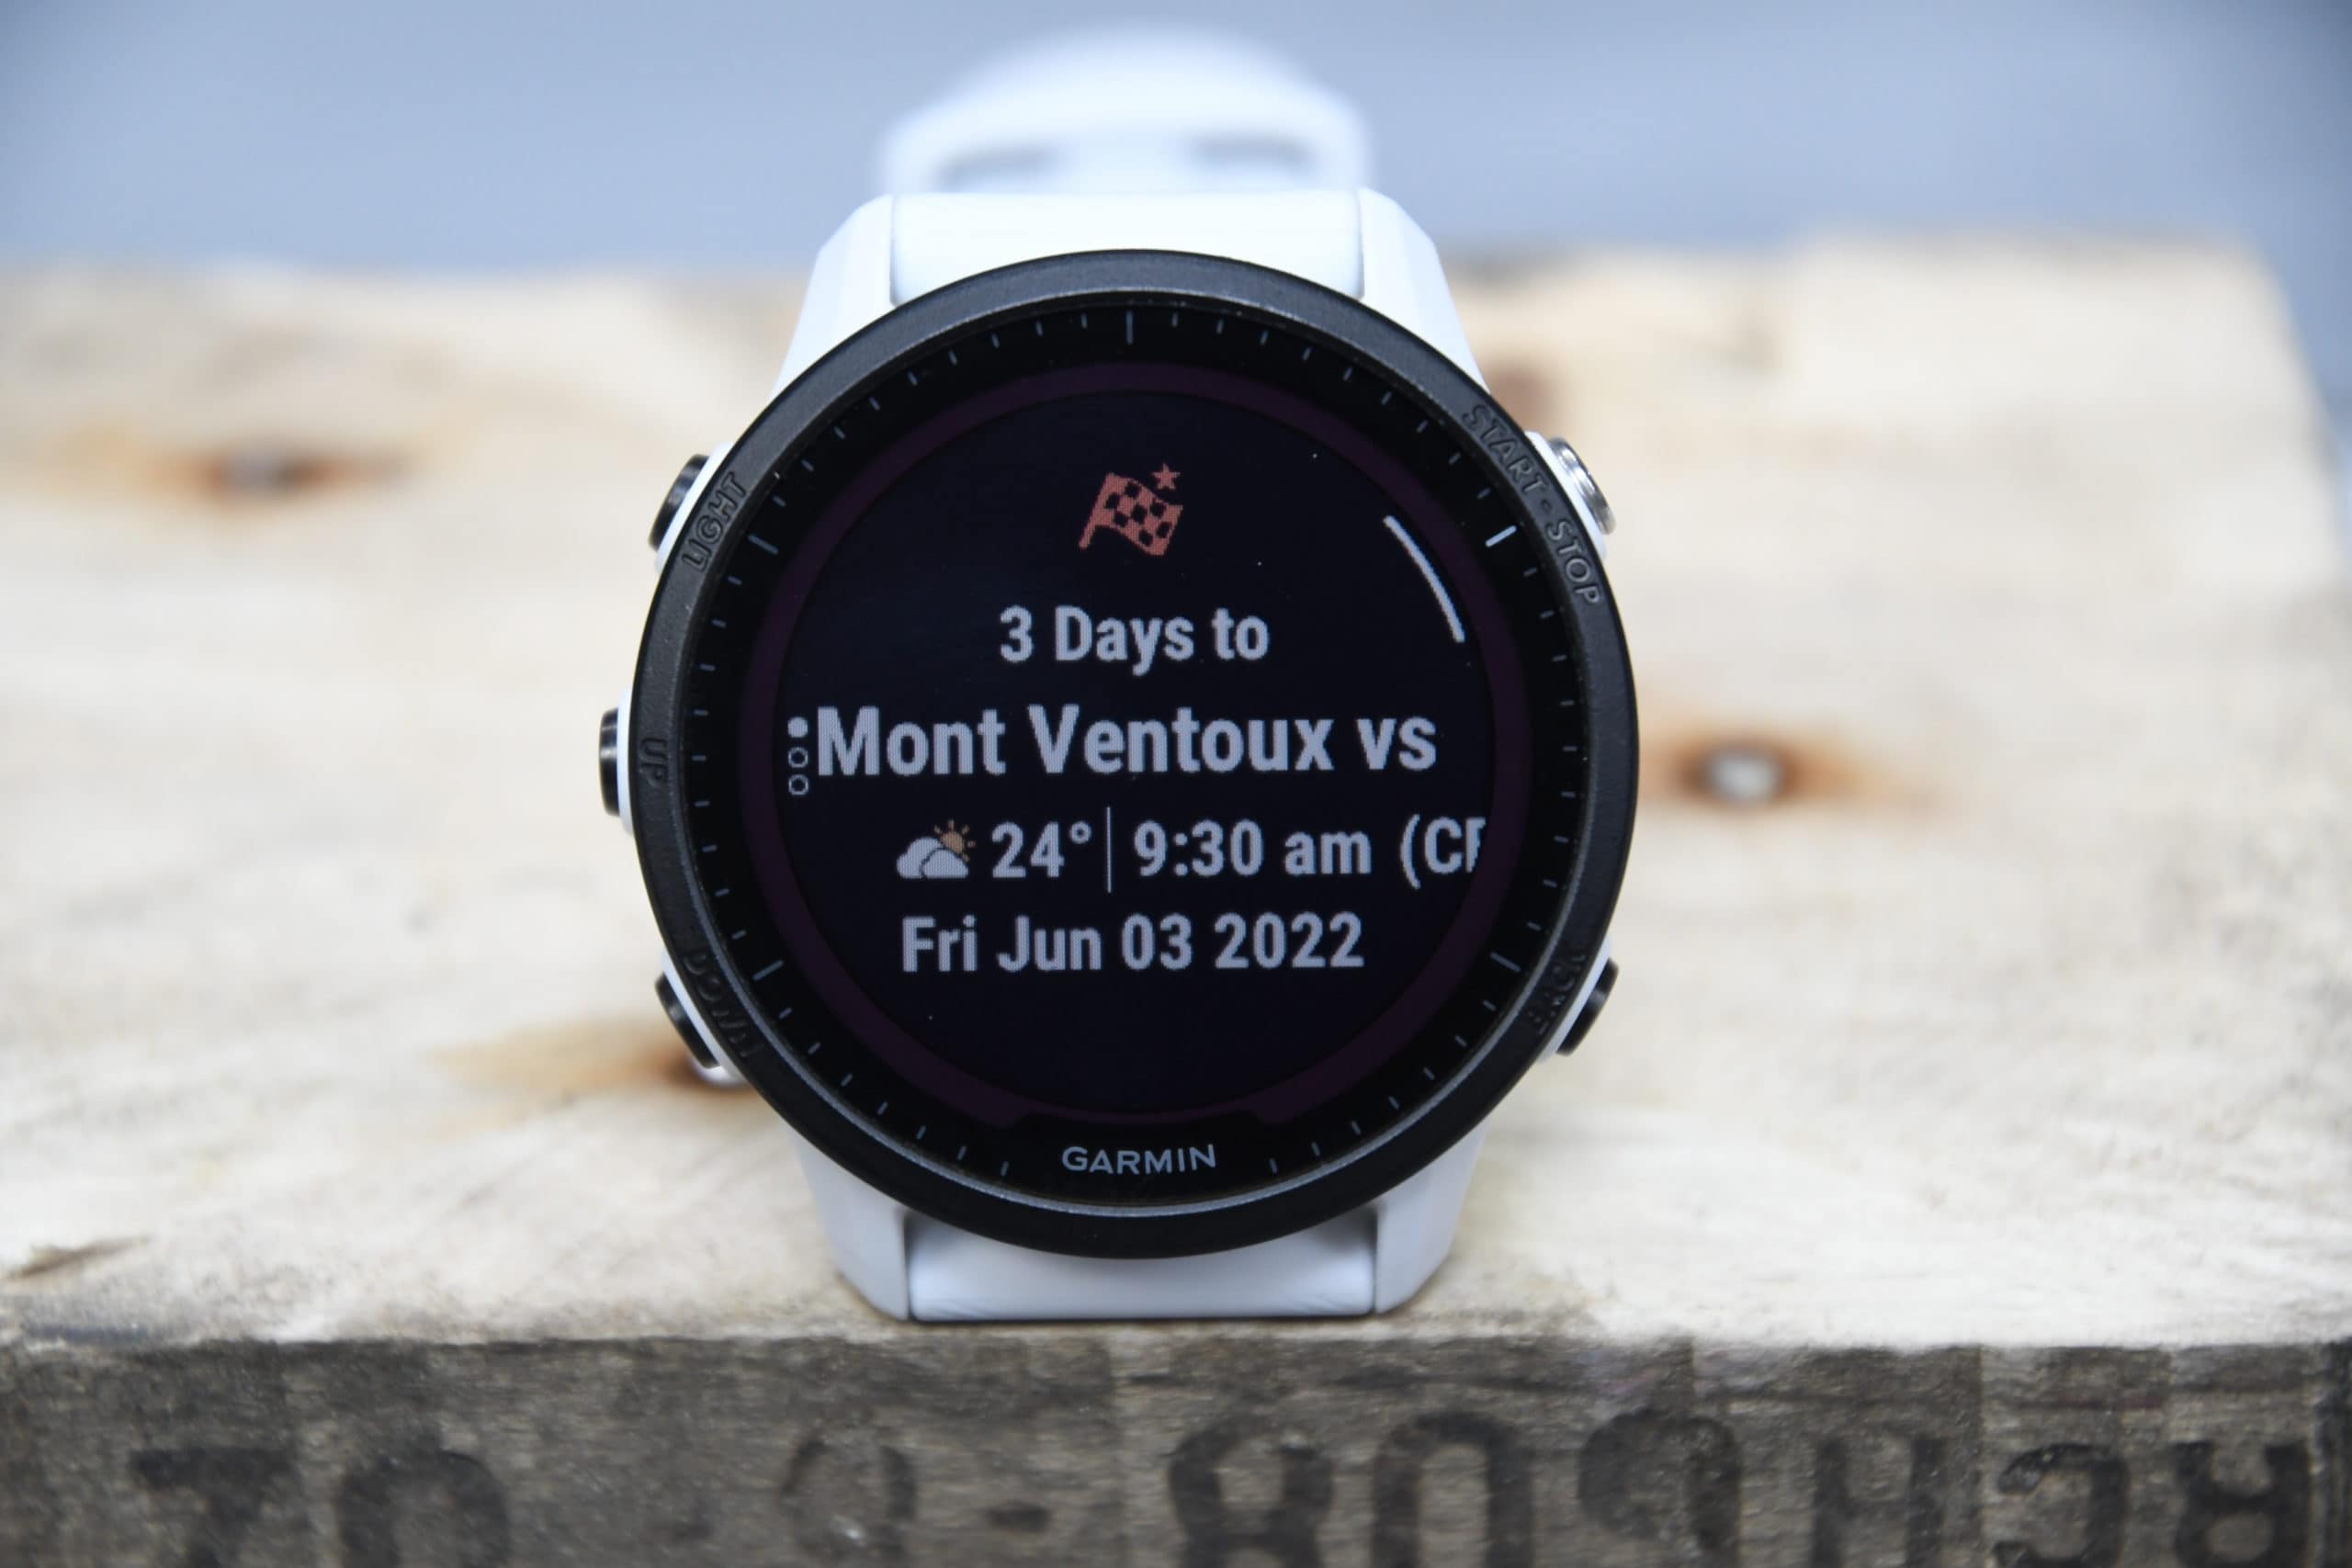
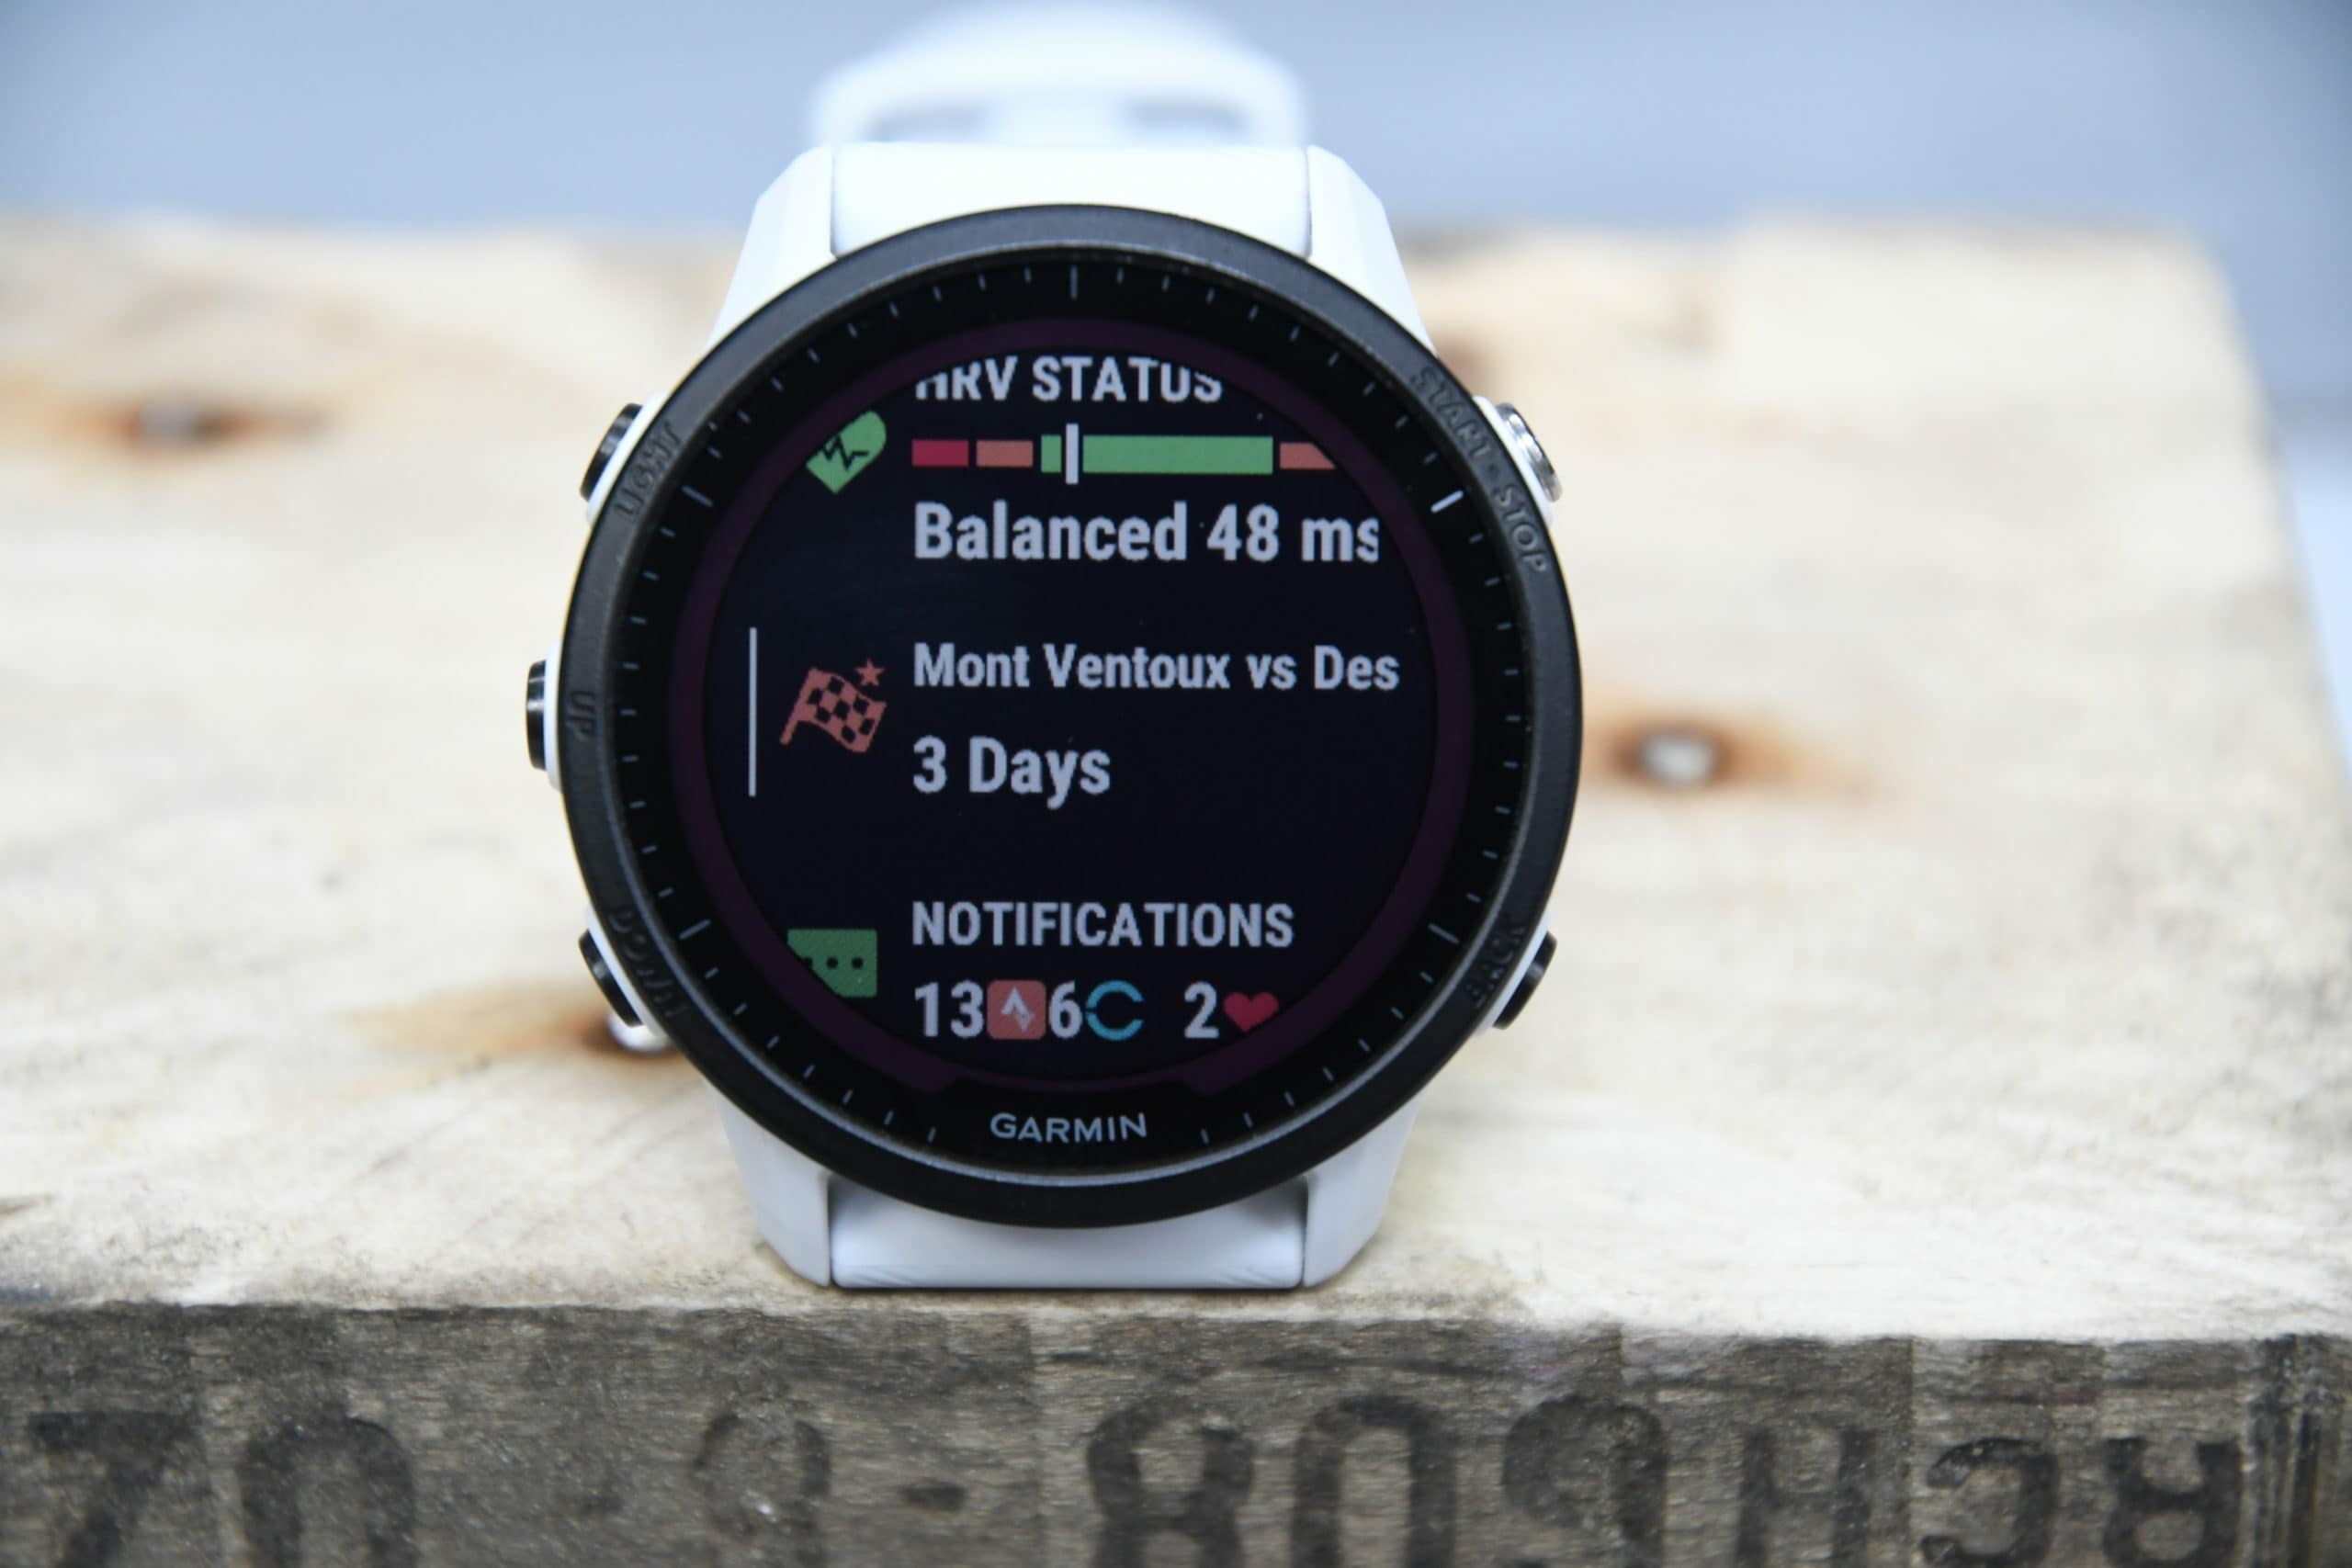

![clip_image001[1]](https://media.dcrainmaker.com/images/2022/06/clip_image0011.png "clip_image001[1]")
![clip_image001[3]](https://media.dcrainmaker.com/images/2022/06/clip_image0013.png "clip_image001[3]")
![clip_image001[5]](https://media.dcrainmaker.com/images/2022/06/clip_image0015.png "clip_image001[5]")


![clip_image001[7]](https://media.dcrainmaker.com/images/2022/06/clip_image0017.png "clip_image001[7]")
![clip_image001[9]](https://media.dcrainmaker.com/images/2022/06/clip_image0019.png "clip_image001[9]")
![clip_image001[11]](https://media.dcrainmaker.com/images/2022/06/clip_image00111-1.png "clip_image001[11]")
![clip_image001[13]](https://media.dcrainmaker.com/images/2022/06/clip_image00113-1.png "clip_image001[13]")
![clip_image001[15]](https://media.dcrainmaker.com/images/2022/06/clip_image00115-1.png "clip_image001[15]")
![clip_image001[17]](https://media.dcrainmaker.com/images/2022/06/clip_image00117.png "clip_image001[17]")
![clip_image001[19]](https://media.dcrainmaker.com/images/2022/06/clip_image00119.png "clip_image001[19]")

![clip_image001[6]](https://media.dcrainmaker.com/images/2022/06/clip_image0016.jpg "clip_image001[6]")


![clip_image001[35]](https://media.dcrainmaker.com/images/2022/06/clip_image00135.png "clip_image001[35]")
![clip_image001[31]](https://media.dcrainmaker.com/images/2022/06/clip_image00131.png "clip_image001[31]")
![clip_image001[15]](https://media.dcrainmaker.com/images/2022/01/clip_image00115.png "clip_image001[15]")


![clip_image001[21]](https://media.dcrainmaker.com/images/2022/06/clip_image00121.png "clip_image001[21]")
![clip_image001[23]](https://media.dcrainmaker.com/images/2022/06/clip_image00123.png "clip_image001[23]")
![clip_image001[25]](https://media.dcrainmaker.com/images/2022/06/clip_image00125.png "clip_image001[25]")
![clip_image001[27]](https://media.dcrainmaker.com/images/2022/06/clip_image00127.png "clip_image001[27]")
![clip_image001[29]](https://media.dcrainmaker.com/images/2022/06/clip_image00129.png "clip_image001[29]")


")


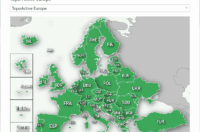
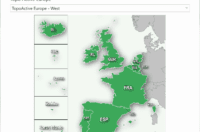

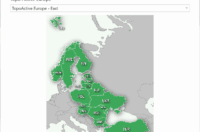


![clip_image001[8]](https://media.dcrainmaker.com/images/2022/06/clip_image0018.jpg "clip_image001[8]")