Welcome to the DCR Analyzer manual!
This page serves as a quick-start guide for the DCR Analyze tool, which I use for data comparisons between products. It’s how I create all of the graphs you see for power meter reviews, heart rate sensor reviews (i.e. optical HR sensors), and GPS tracks within GPS device reviews. It used to be that I used a combination of Excel and Golden Cheetah to normalize the data. But that process would take me 20-40 minutes per set to create/normalize/present all the data, which was an eternity when I wanted to share not just one ride – but perhaps a dozen sets or more. It simply wasn’t sustainable.
So about two years ago I started working with a developer to put together a complete suite to analyze data. During that time it’s largely been for my own use, though I have had a handful of folks use it in beta testing since then. Given I continued to get so many requests for access to the tool, I figured it was time to finally open things up. So here we are!
Finally note that the tool is NOT designed to replace or be a training log site (i.e. TrainingPeaks, Strava, Garmin Connect, SportTracks, etc…). It’s merely designed to analyze data from multiple devices at once.
Just wanna register and skip all the chatter? No worries: Registration link at the bottom.
How it works:

This tool is what I use to compare data from multiple devices at the same time. Right now it allows me to analyze the following types of data:
A) Heart rate data
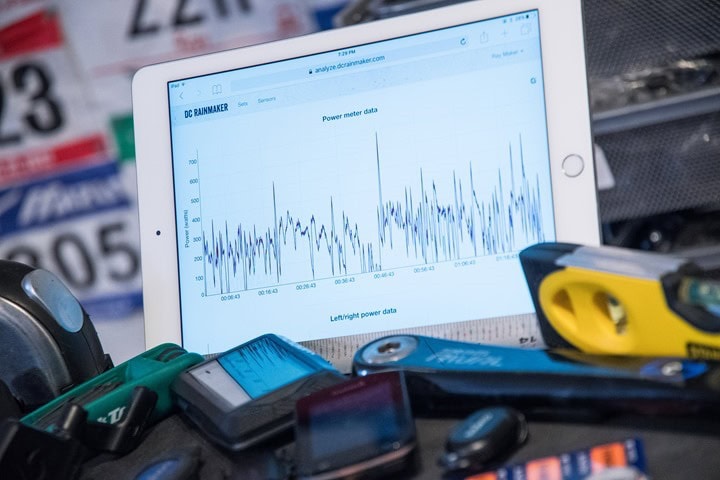
B) Power meter data
C) Cadence data
D) Elevation data
E) Distance data
F) GPS Tracks
G) .FIT File Developer Fields (e.g. Garmin Connect IQ Developer fields)
H) Running Power (with Polar/COROS/Garmin/Wahoo watches)
The tool can consume files from all major fitness devices types (Garmin, Sunuto, Polar, Timex, Apple Watch, etc…), using standard fitness file types (.FIT, .TCX, .GPX). All that is needed is for those files to record a specific date/time.
This gives significant flexibility in comparing products, as one can zoom in on various sections of a workout and dig into any inconsistencies. Additionally, one can apply smoothing dynamically on the fly to allow for easier understanding of data (such as a 30-seconds smoothed chart for noisy power meter data).
To begin, you’ll start by dragging in a pile of files from a given workout. So if you have three devices, you’ll drag all three files into the window at once (or select them using the file picker). You’ll do one ‘set’ at a time. Note that at present you cannot add files after the fact to a set – so be sure to add everything you want upfront.

***Please remember that the Analyzer is *NOT* designed to replace your training log. As such, please keep copies of all your data files.***
If you’ve already created sets, then when you first login you’ll see a simple listing of all existing sets. You can either edit/view a set, or delete a set. Renaming occurs by going into the edit/view option.

The analyzer works by comparing the recorded date/timestamps in the files and matching them up. This ensures that even if you don’t press start on the devices at the exact same second, it can still align them properly.
The tool is not designed for comparing workouts done at different times. Meaning, it’s not designed for comparing a Monday workout to a Tuesday workout on the same course. For that there are better tools as part of training logs.
The tool is primarily designed around a desktop experience, and thus at the moment may render a bit odd on some mobile devices. Once the page is opened you’ll see various sets of data from the public link that you clicked on. Here’s what an entire single page looks like (screenshoted below), or, you can just look at the exact same sample here live.

Each set of data set may have different metrics depending on what was recording. For example, if no heart rate data was recorded then the HR graph won’t show. There’s no concept of bike or run, rather, just data (since pace/speed isn’t displayed – only distance). On each graph you can hover over the section in the graph to look at the various data points. Those points will be shown in the upper right corner of the graph, next to the file names. This allows you to compare values at any given second. This value shown is *NOT* the average, but just that exact second in time.

You can zoom in on a specific section by highlighting a section with your mouse:

Which brings you to this:

To reset back to the full view, simply double click on the graph.
For power meter data, there are extended types of charts. This includes the ability to compare left/right power meters by left/right leg, as well as to compare against left-only power meters. This is useful if you want to compare a left-only power meter (i.e. Stages) to a full dual-sending power meter (i.e. Garmin Vector or PowerTap P1). It’ll properly plot Stages as a left-only power meter, showing just the left leg against just the left-leg data from a dual-sending unit. The same can be done for the right side, or against total power. Note that all left-only units on the market today simply double power.

You can enable/disable power meter from showing this at the bottom of the page in the ‘Files’ section, and then clicking on the ‘Edit’ icon. For example, I deselect the ‘Show Virtual Left Power’ on the PowerTap G3, since it’s non-relevant there. But if I were comparing a left-only Stages to a dual PowerTap P1 system, this allows me to show how the left-side only might compare.


Additionally you can compare the Mean/Max chart for power meters. This allows you to quickly visualize whether there are inconsistencies at certain power output ranges or over certain timeframes. Note that this isn’t a direct indication something is wrong with a power meter. In fact, this can simply mean there was an error in the recording device (such as if a unit stops recording for a period, or someone forgets to start recording after a coffee break).

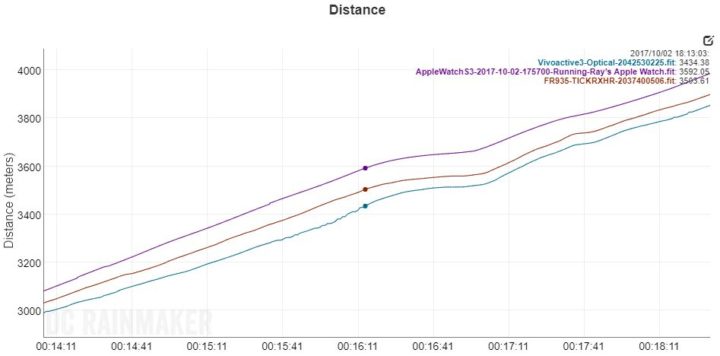
Similar to the mean max graph for power, there’s also a distance accumulation chart. This allows you to see the recorded total distance for a given device, plotted over time. This chart is useful because it allows you to easily spot where a given GPS device may have one awry. It also let’s you sort out issues where the total distance is the same, but the underlying tracks aren’t.
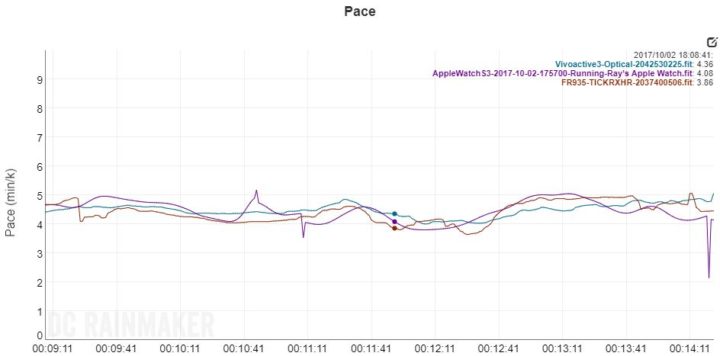
In addition, there’s a pace/speed graph. This graph will show ‘Pace’ for activities detected as running, and for everything else, speed (you can toggle the default in case it misdetects). Note that this will ONLY plot data from files that explicitly list the speed/pace values in the files. Virtually all .FIT files will, however very few .TCX or .GPX files tend to. The Analyzer will NOT attempt to ‘re-imagine’ the speeds based on GPS data points, staying true to the idea of only showing you what’s in the actual file.
Finally on the charts, note that the ‘DC RAINMAKER’ watermark is displayed for day pass and coupon users, but not for annual subscription members.
Next, for GPS based files (outdoors), you can compare GPS tracks. You can zoom into certain sections and analyze them in more depth. Note that in general for GPS track analysis you should always use satellite view and not map view. That’s because there are often inconsistencies on exact map alignment to real life, especially near bodies of water (i.e. lakes, rivers, streams, etc…), or in non-urban areas. Whereas satellite is much better for comparing tracks.


At the bottom you can see average/max/total comparisons for certain data types. This is quick ‘at a glance’ information, and shouldn’t be used as the definitive statement on whether a device is good or bad. Just because four devices have near-identical averages, doesn’t mean they showed anywhere near the same metrics during an activity. You can have one device value reading 125bpm the entire time, and then another device that reads 100bpm for half the time and 150bpm for the other half the time. Yet both would have an average of 125bpm.
In the case of power meters, remember that the max 1-second power value is highly dependent on a slew of recording interval events. Thus, I’m looking for these to be in the same ballpark (i.e. 870w, 910w, 930w). You should use the graphs to more closely dig into max values.

Simply use all of the average/max/total values as an ‘at a glance’ indicator of where else in the analysis tool you should dig deeper. That’s all.
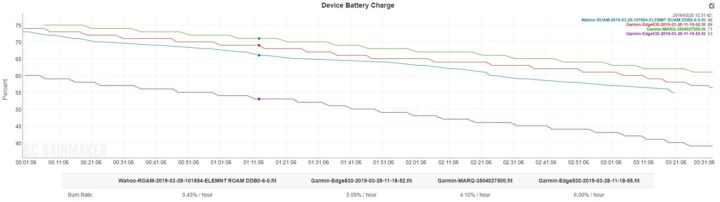
In addition to metrics like power and HR, we also now graph battery life. This data is graphed for devices that record such data to the file (Garmin, Wahoo, Stages, and Hammerhead currently, though we are happy to add others that do record it to the file as we find them. Note: Garmin Venu/Vivoactive devices do not record battery levels to the file). It will show you each time that device records a battery percentage value. For some devices that’s on a set time basis (e.g. every 10 minutes), whereas for other devices it’s each time the battery level changes (e.g. 52% to 51%). Either way, any points recorded we plot. Further, we’ll do a simple battery burn rate calculation at the bottom of the graph. Keep in mind factors like backlight/levels have a massive impact on battery life, as does GPS types (such as GLONASS & Galileo can burn 10-15% more battery).
The Analyzer gives you some control over what metrics are shown for which data graphs. For example you can disable showing the heart rate data from a given device, while still showing it for remaining devices. This is useful if you’ve got a device that’s simply giving wonky data and you don’t want it to ruin an otherwise perfectly usable chart. A specific example here is that if I’ve created a set with 4 different devices comparing power meters, and one of those power meters has a battery issue impacting transmission – this allows me to easily remove that power meter data from the chart, while still keeping other data like heart rate or elevation.

At the top of the above screen you’ll see a ‘Time Offset (sec)’ box. This allows you to shift a given file in case the charts don’t lineup. The DCR Analyzer uses the GPS timestamps in the file (or for indoor workouts, the computers timestamps). Thus it doesn’t matter when you press start, it takes care of it behind the scenes. This usually works perfectly, but in some cases there’s 1-3 seconds of difference due to time differences of the unit itself. You can enter a positive number – such as 3 – to shift it three seconds forward. Or a negative number – such as -3 – to slide it three seconds back. One pro tip if you find things are way off, is that it’s usually timezone related. For one hour, enter in 3600 (seconds), and so on. If I’m off by an hour+, I’ll start by doing multiples of the hour, and then refine from there.
Speaking of charts, you can rename those charts at the top of each section by clicking in the text box.
One particularly useful aspect of the platform is sensor management. This allows you to ‘save’ ANT+ sensors and assign them specific vendor names and ID’s. For example, you can save ANT+ ID 9196 as a Wahoo KICKR, or ANT+ ID 33382 as a Garmin HRM-TRI strap. These ID’s are private to your account, and are not global. Common device types are populated within the system for you.

Once you’ve assigned an ANT+ ID to a given device, it’ll save it for all future uploads to the Analyzer platform. It’ll also replace the name of the file in any charts, with the ‘pretty’ sensor name instead (i.e. Wahoo KICKR2).

Note that non-ANT+ devices cannot be saved, since other platforms don’t actually save the ANT+ ID in the file like a Garmin .FIT file does. Meaning, Polar, Apple, and so on devices don’t have any mechanism of saving that data within their file types. Whereas Garmin and Wahoo devices do save the ANT+ ID’s within them.
Next, you can make your set public. This allows others to look at the set via a public link. This does not allow anyone to modify the set, but only gives them ‘view’ access. You’ll click the ‘Public’ option at the bottom of the page to enable this, and then copy/paste that link with the /public/ in it. If you copy/paste the link at the top of your browser, it’s not the public link.
Also, it’s here that you can change the smoothing of the graphs, based on seconds. Typically I’ll create graphs within a review for a power meter (for example) at both 1s and 15-30s, depending on the length of the ride. For anything more than 2 or so hours, you’ll likely want to use a 30s smoothing factor to find issues.

Finally, you can download the original files as part of the set. This allows you to further analyze the files using your own tools/apps/etc.
Tutorial Video!
Holy cow, I even managed to put together a full tutorial video on how I use the DCR Analyzer and some pro tips on getting the most from it!
Frequently Asked Questions:

Here’s some common questions I get on how the tool works, as well as a few tips for using it.
Time Alignment issues: As discussed above, the tool uses GPS timestamps for aligning files. However, I’ve seen cases where if a device was used indoors for weeks without getting GPS (or changed timezones without re-acquiring GPS), you can have an offset. In the case of some devices, it may only be a second or two. Whereas if you forgot to reset the time after changing timezones, it could be hours. You can resolve this by using an ‘offset’, which is applied on a per file level. Meaning, each file you have can have a different offset. Simply go to the ‘Files’ section and click the ‘Edit’ button next to a file to give it an offset in seconds. You can use a positive number (i.e. 5) to slide it forward 5 seconds. Or a negative number (i.e. -5) to slide it backwards 5 seconds. All times are in seconds.
Pro Tip – File names: As a best practice, I rename/add a prefix to all files before I upload them. So a default Garmin .FIT file might be 726G4445.FIT – but I’ll instead rename it “Garmin-Fenix5-726G4445.FIT”. Sometimes if I’m trying to remember something specific about the file, I’ll add more details, like “Fenix5-Quarq-DZero-726G4445.FIT”, meaning that I’m using a Fenix5 with a Quarq D Zero power meter. This is just helpful, especially for non-Garmin files, as it’ll be what people see in the graphs as the file name.
Pro Tip – Missing data points: Having trouble where on a graph you can’t seem to get all your files to show a data point for a given second? That’s because some of your files may not be 1-second recording. Instead, they could be either smart recording, or recorded at a lesser interval (i.e. every other second). By default almost all Garmin devices record in ‘Smart Recording’, but luckily you can change that to ‘Every second’. The DCR Analyzer will only show a data point if a point exists for that second. It does not interpolate data points, as that starts to get into the territory of ‘faking data’. The goal here is always to show the original/raw data. Note there are some quirks I’ve found in other formats. For example, when exporting the .TCX files from Suunto’s site, it seems to reduce the recording rate. Unfortunately, their .FIT file exports don’t quite follow the standards – thus causing additional issues for the Analyzer.
Public links: All data sets are private by default, meaning, they are not publicly accessible. In order to make them accessible to someone else, you need to check the ‘Public Link’ checkbox at the bottom of that specific set, then press Save. It’ll give you a new public link that you can e-mail/share.
Adding new files to existing sets: At this time the tool does not have the ability to add another file to an existing set. It’s easiest instead to just re-create the sets with the new files. The tool can support up to 20 concurrent files per set (meaning, you could somehow have 20 different devices per ride). If you have a ‘Day pass’ plan, then the tool doesn’t allow creating more than the three sets – so it’s important to add those files upfront.
Who can use the platform? Anyone that wants to. Whether you’re just wanting to compare a few files quickly as a regular consumer, or you’re a company looking to see how your products stack up, or perhaps a journalist trying to do a comparison – I welcome anyone who wants to use it.
Aren’t there other options? While there are a couple (one?) 3rd party platforms out there for comparing files, I’ve found many issues with them. For example, some don’t support the new .FIT file formats used by virtually all Garmin devices and Garmin firmware versions in the last year or two. Second, they sometimes resample the GPS track data, which means that you aren’t seeing the actual data. The DCR Analyzer doesn’t do any resampling – it’s only showing you native data.
What if I find a bug? Great (well, not exactly) – but we’d love to get them fixed ASAP! Simply hit up the ‘Contact’ button up above and I’ll get things sorted as quick as possible.
Wanna Register?

Looking to create an account? No problem, there’s two options today for creating sets on the platform. They are as follows:
Premium
The Premium option is a $29/year subscription. You can create an unlimited number of sets. Your subscription automatically renews after a year. You can cancel at any time. No watermarks are displayed on Premium/Annual users.
Day Pass
A one day pass is a single $5 charge. You can create three sets within 24 hours. After 24 hours you can still login and view your existing sets but can not create new sets. You can purchase another one day pass or upgrade to the Premium subscription.
Ready to get started? Simply head over to this link to create an account. After you’ve validated your account via the e-mail confirmation, it’ll send you off to pick your plan.
Enjoy!