Last week the founder and key engineering team members of Watteam flew over to Paris to allow me to install, ride, and analyze their previously announced PowerBeat $499 power meter. You’ll remember it hit the interwebs exactly one year ago ago today, and I did subsequent posts at both Eurobike and Interbike last year on the product.
Now however, they’re nearing sales and shipping and gave me a first look into what consumers will see when they get the units this fall. The PowerBeat is appealing to many because of the low $500 all-in price tag, but more importantly for a system that has full and independent left/right measurement. It’s also not tied to any specific pedal type – a core challenge of many separate left/right systems today.
But before we get too far ahead of ourselves, let’s get it all unboxed. Note that this isn’t a review, in-depth or otherwise. In fact, I titled it with the rare (if ever used) ‘Preview’ moniker. That’s because while it’s a near-final unit, it’s not final-final. And thus things can and will change (I’ll discuss some of those items in the post). Additionally, since I only had it on my bike for a week, that’s not as long as I’d normally spend on a power meter testing cycle (which usually range from 4-6 weeks and upwards).
Unboxing & Components:

First up would be their packaging. It’s definitely a bit smaller than most other power meters, in large part because most other power meters are shipping with larger pieces attached. For example a crank, a wheel, or chainrings. Obviously, when you remove those large clunky bike components it allows you to ship in much smaller boxes.

In any case, here’s the inside of the box:

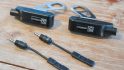
Next, all the components laid out on the desk.

A run through of what’s shown above around the box:
– 2x Pods (aka Comp Nodes)
– 2x Sensors
– 2x Wire Stickers (in plastic bag)
– 4x Washers (in other plastic bag)
– 1x Battery Charger with USB connection
– 4x Cleaning wipes
– 2x Sand paper
– 1x Glue (not shown)
– 1x Water Bag (not shown)
– 1x Installation Tool
– 1x Desk
I’ll discuss all of these within the installation piece. Note that both the glue and water bag weren’t in the box, but I’ll cover those later in the installation phase. That’s simply because the bag used during this installation isn’t quite the final version (branding/etc…) and thus hasn’t been included in the packaging yet.
Installation:

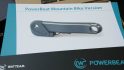
The installation of the PowerBeat may appear somewhat complex, but in reality it’s actually silly easy. It’s one of those things that I initially looked at the tool they created and thought to myself: “Great, another wonky-ass installation tool.” But as I’d come to find out, it’s probably one of the most ingenious little tools I’ve seen. I’m reasonably certain it’s (almost) impossible to hose up.

Core to the premise of PowerBeat’s pricing is that you do it yourself. Regular readers know that I very rarely use quotes from people in my posts, but they made one comment that I thought was interesting enough to worth noting. When discussing the installation routine, founder Ofir Galon mentioned:
“The price drops to $500 because we’re turning the living room into a factory for 24 hours.”
And to a large degree he’s right. You’re exchanging some of your time and living room in exchange for saving $500+ on a left/right capable power meter. For what I suspect will be the majority of consumers out there, that’s probably a fair exchange. After all, the installation takes less than 15-20 minutes to complete, and last I checked I didn’t get paid $1,500-$2,000 an hour – so, I’ll take the savings.
Of course, just because it’s cheaper doesn’t mean it’s better or even equal to a factory approach. There are certainly risks with this approach, which I’ll outline later. They also noted they don’t see much value in having a program for bike shops to install the units, since in their experience a bike shop is just as likely to correctly or not correctly install the unit as an end consumer. Something that has proven incredibly true with power meters such as Garmin Vector. No doubt they want to be in bike shops eventually, but having a plan where they subsidize the bike shop to install it doesn’t make much sense for them at this time.
In any case, to begin we’ll start by cracking open their dedicated installation app. This app walks you through each step of the process – complete with little YouTube videos embedded in it (all of which are viewable here). It’s best to watch each video segment first, and then do it yourself on your bike as you go through them. As they noted, spending 3 minutes to watch a video is much better than spending days having to wait for new parts.


At the same time, they also plan to offer an installation helper service. For this you’ll simply schedule a time – just like an appointment service – and then will live video chat with one of their support members. So effectively you’ll be able to Skype or FaceTime with their support team and they can see your bike and walk you through all the steps one by one. Fairly smart concept – and something I’m not aware of any other power meter companies doing today.

Before we begin, I’ll note that they brought a standard Shimano 105 crank set with them, for the mere reason that when we validated details of all the crank sets I had on-hand in the DCR Cave, I was away on vacation and wasn’t 100% certain I had an aluminum crank set available in the cave to test with.
With all the parts laid out in front of me, it was time to begin. First was inserting the little tool into my crank arm. This goes where your pedal would normally screw in:

From there, you’ll rotate the tool’s arm back onto the crank arm, effectively ensuring it lines up parallel to the crank arm. Any two year old can do this successfully – it’s basically like Erector toys for adults.

Then, you’ll simply tighten the additional locks on the tool, which keeps it in place nice and snug. Next, you’ll grab the sensor (with wire) and lightly sand the bottom silver portion of it. This gives it a bit of texture for the glue. It only takes a few seconds:

Then, you’ll go ahead and use the included cleaning wipes to clean off both the crank arm area where you’ll be attaching, as well as the bottom of the sensor you just sanded. One wipe for each sensor and crank arm.
Next you’ll place the sensor inside the installation tool (upside-down). You’ll also just flip it over and validate that it still lines up properly when rested onto the crank arm. Finally, it’s time to add a smidge of glue to the sensor. Once that’s done, flip it over onto the crank arm and press down for 30 seconds.

Upon completion of the 30 seconds, remove your hand and let it sit for 5 minutes.


Finally, remove the tool, leaving just the sensor there.
At this juncture you’ll repeat the process for the other side of the bike. The only place you could possibly screw this up is if you put the crank arm in the wrong position (thus mounting it upside-down). But the instructions are abundantly clear about this, so if you do this, well…it’s probably totally on you.


Once you’ve completed the second side you now wait 24 hours for the glue to set. Thus, we did that too. They came in on Sunday, and it wasn’t until Monday evening that I got my first ride in.
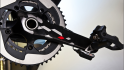
With the 24 hours having elapsed, it’s now time to install the pods. These comp pods connect to the sensors and ultimately transmit the information onwards to your head unit. The installation is pretty straight forward in that you’ll screw the pedals in through them (using included washers if required).

And then simply screw in the pedals as normal:

Then you’ll just plug the unit into the pods (Note: The extra band you see there is for a cadence sensor I installed to check data on cadence):


Then we’ll add these little sticker thingies that keep the pod’s wires cleanly secured:

Finally, we’ve gotta get things all calibrated. The app walks us through this as well. We’ll need one additional piece here – which is a weight of a known and precise value. For companies, shipping such a weight would be incredibly expensive. So Watteam got around that by using these specially designed scientific water bags that will always equal a precise weight.

You’ll simply fill it up to the very tippy-top:


Then, we’ll bring them back to the bike. Here the app will guide you through two pieces, first is to align the crank arm in a specific horizontal position, and then to place the water bag on it. By holding the brakes on the bike, the pedal won’t fall to the floor.

The entire process takes a few seconds per side, at which point your installation is complete and you’re ready to ride.
The Basics:

The PowerBeat system in many ways acts like any other power meter out there from a usage standpoint. It can transmit via both ANT+ and Bluetooth Smart, allowing you to select which device you’re going to use it with. For Garmin users, it’d be ANT+, whereas for Polar & Suunto users it’d be Bluetooth Smart. Right now you select one or the other modes to save battery, though I recommended to them they simply enable dual transmission as it’s a much more common way of doing things and generally preferred.

Once paired to a head unit, it’ll display total power, cadence, and left/right power. If you’d like to look at one of my activities as recorded by the Garmin Edge 1000, you can click around here.

The unit allows you to do a calibration (technically a zero offset) anytime you’d like, via either a standard command on an ANT+/Bluetooth Smart head unit, or from the app itself. I had some troubles doing this mid-ride at one point, as they had some timeout values specified to minimize accidental offsets. But after the ride we talked through the logic and it sounds like they’ll change things slightly so that I wouldn’t run into that in the future (basically just removing the block, which served no real purpose).

Because the unit sits in between the pedals and the crank arm, you’re free to use any pedal choice you’d like – a change from most other units that independently measure left/right.
There are some limitations on crank materials though, which I’ll cover in a later section:

The unit has rechargeable batteries, which means there are no coin cell batteries here. Instead, it’s like your phone – you just need to recharge it every once in a while. In the case of PowerBeat, that’s every 80 hours of usage. To do so you’ll just use the included recharging connectors, which plug into your bike:


The unit also features temperature compensation and adjustment. This is standard on most power meters, which typically need to track changes in temperature to understand how materials react at different values. If a product doesn’t have either active or passive temperature compensation, you’ll see issues.
In the case of the PowerBeat, it does indeed have this sensor and compensation, but as I saw within my rides – it was acting a bit slow. This meant that when I was making large temperature shifts (as in from inside the cool DCR Cave to outside on a hot day), it was taking longer than desired to display accurate power numbers.
In my discussions with them about this topic they noted that it was essentially a simple smoothing question – and one they’re working at finding the right balance between reacting too fast (and getting false positives) and reacting too slow and it taking 10-15 minutes to stabilize (as I saw). I’m not at all worried about this, since it’s really just a very easy decision on what that delay should look like and then setting that software value to it. I think they’d agree that it needs to be shortened at this point to minimize issues.
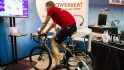
As for riding – there’s really nothing else you need to do…except ride. And that I did. Every day, 1-2 times a day for the four days they were here.
Accuracy:

As is usually the case, I attempt to judge accuracy of units by comparing a given power meter to a multitude of other power meters on the bike at the same time. I find that by comparing to 2-3 other power meters concurrently you can usually identify the outlier in a group. I typically try and do this with units that I’ve got history in proving that they are accurate and reliable.
In the case of these tests, I had the unit mounted to my Cervelo P3C bike. That bike also had on it a PowerTap G3 hub, as well as PowerTap P1 pedals, thus giving me three trusted power meters to work with. I collected data in two ways here. The first was wholesale collection of all ANT+ data into the NPE WASP device, and the second was through a small fleet of Garmin devices (Edge 810, Edge 1000, and Epix). All of those raw files are available here for you to download and analyze as you see fit.
While I normally analyze 3-4 specific rides in my power meter posts, I’m actually going to do things slightly differently this time. Partly because it’s a preview and partly because I just want to change it up. Instead I’m going to focus on specific areas of the files where things went well…and where they struggled. I’ll note for each case which ride it was from and the time, as well as my thoughts.
Overall though, if I look at all four of these rides with a simple 30-second smoothing applied to make it easier to see, they tend to track really well:


Next, let’s look at a few random sections on different files. I’m going to mostly focus on sections after the 30-minute markers on each file, and I’ll explain why in a minute.
Starting here with an increasing wattage section on the July 27th ride. You can see that all three units track quite nicely against each other, and in most cases have a total wattage spread of roughly 10w (on 200-300w). I’d say that generally the PowerBeat was the lowest of the numbers, but not always. It’s also possible there’s a bit of settling in time, since this was the first ride. Typically you’d expect the PowerTap G3 hub to be the lowest.

On that same ride, I did a short burst of a sprint, if we look first at the 30-second smoothed values, you’ll see the peak values are all very close – ranging between 601 and 619w.

But remember, those were the 30-second averaged versions to make it easier to see. What if I took it back to 5-second averaging?
In this case it actually gets even closer percentage-wise – showing them all within 20w on ~700w.

And if we remove smoothing altogether? Well, that’s when it gets a bit hard to analyze. At that point you’re really not comparing values in-so much as comparing update rates that are sub-seconds.

So for that you’d need to look at the max wattages recorded in the files:
PowerBeat: 958w
PowerTap P1: 740w
PowerTap G3: 791w
But wait – where’d that 958w come from? Well, there’s a random spike at the 47min marker where it triggered it (15 minutes after the above graph section). Looking at my location, I was just on a relatively flat traffic circle. So obviously some sort of error there.
Next, you’ll have noticed in the very first picture I posted that there’s some divergence towards the end of the first ride – roughly in the 50-55 minute marker – and really only this section. Here things look blocky and wonky.

What was going on here? Well, this:

For those that don’t remember back two weekends ago, that’d be the Champs-Élysées, home of cobbles on the final stage of the Tour de France. This stretch that time of day is stop and go, hence a lot of the up and down you see, but it’s also fairly rough (cobbles, duh). This appeared to cause some oddities in the data as seen above where the PowerBeat spiked. As soon as I left that section, things looked pretty good the rest of the ride.
So I decided to dig into the cobbles thing a bit. So the next evening I went out on a night ride into the forests that would ultimately take me up some pretty cobbled areas. In doing so though I brought my bike from the cool temperature DCR cave out into the warmer night air, which resulted in the first part of my ride being kinda wonky (that teal color is PowerBeat):

You can see I stopped for a bit to troubleshoot, and then stopped again for more troubleshooting. It’s on the second troubleshooting stop that I got things happy (I suspect just waiting might have solved it too). After that, you can see they start to line-up pretty nicely (from 28mins onwards). This is what I was referring to earlier on the too-slow temperature compensation that they’re going to adjust.
So up to the the cobbles section. First, note the *scale has changed* here, you’re looking at only a 70w spread on the entire graph. In this case, my speed was much lower since I was climbing at about 6-8MPH, versus going down the Champs-Élysées at 20-30MPH.
Here you see things handled very well. Even in the wider gaps, we’re only talking a total spread between the three power meters of 15w on 350w. That’s well within the range of accuracy overlap of the units. And in many cases they are less than 10w apart.

If I look at other random sections on the same ride, things again track quite well:

Next, let’s go to ride #3 on the opposite side of town doing loops around Bois de Vincennes. For this, if we look at the first 25-30 minutes the units track quite well from a ‘up and down’ standpoint, but don’t perfectly align. This being another example of slow temperature compensation (easily fixable by simply compensating faster):

Whereas towards the end of the ride (as I’m in stop and go traffic), things get much closer. You will however see slightly different lag on some of these because of the nature of stop and go and how different units handle that at a second by second basis.

Finally – let’s dig into the trainer workout:

For the trainer workout I roughly did a 10-minute warm-up period, and then a calibration of units at that point (you see that above at the 10-11 minute marker). This was done on a CompuTrainer.
Then I did increasing wattage levels up to about 300w or so in two minute blocks. For this, you see things tracked quite nicely. Again, do note the scale of the graph.

Next, I decided to try a cadence sweep, starting at about 35RPM (the lowest PowerBeat supports is 30RPM). I basically went up in 10RPM increments from 35RPM to 150RPM, before a short sprint to 170RPM. Here’s data from the concurrent P1’s:

You can see here it struggles a little bit (below) on the lower cadences, with a wider offset:

As I get towards the mid-range through, it merges in quite well before tracking fairly well the rest of the way up. You’ll see slight variants in my little few-second sprint towards the end, merely because it was just that: A few seconds.
–
So – where does this leave us on accuracy? Well I think that if they were to speed up the temperature compensation piece, it’d actually look really nice. The lines all track very well together today, it’s just that initial portion of the ride and the compensation slowness that’s challenging. There was the outlier on the cobbles going downhill though where things went a bit wonky, as well as potentially low-cadence work. So that definitely would need to be tested and looked at a bit more.
So overall I’d say it’s positive if those tweaks can be solved. There aren’t wide variations across the board or anything out of the normal that’s systematic.
Odds and Ends:

During their multi-day stay here, there were a number of things I asked them about, or, that were worth noting. These didn’t really fit into any of my specific sections above, so let me just plop them here one bulleted section at a time.
Ordering begins August 31st: They’ll be opening up ordering of units (at $499 for both sides) starting August 31st to folks who have registered on their website. Non-registered folks will be able to purchase a few days later on September 2nd for any leftover units. This will only be initially available to the US market. They’re working on distribution plans for other markets.
Shipping begins in November: They’ll begin shipping units in November to pre-order folks. On the ‘good news’ front, they’re using Flextronics to do the manufacturing. This is one of the most well respected companies in the sports tech world when it comes to ‘getting $h!t shipped’. Based out of Southern California, they manufacture for Recon Instruments as well as GoPro and many others.
Initially aluminum cranks only: Going out of the gate they’ll be only taking orders for those with aluminum cranks. In other words, no carbon cranks. Right now they aren’t yet ready to accept carbon orders, though they are working through the last logistical elements to be able to do that. This does not sound like a technology issue here. As far as thickness on crank arms, the final production pods will handle slightly deeper (height) crank arms, but at present they haven’t seen any compatibility issues.
Parts & Additional Bikes: In the event you want to put sensors on additional bikes (or, in the event you break something), the sensor kit will cost $60-$80US and include new sensors/glue/cleaning pads, etc… In the event you manage to destroy the pod, it’ll set you back $200. These aren’t final prices though, and might change slightly. Moving the pods between bikes is trivial, whereas moving the sensors is not. So basically if you wanted power on different bikes and wanted to use the same set you’d just buy a separate sensor set and move the pods. The app will be able to support ‘remembering’ multiple bike calibrations, so you can easily swap bikes without having to take out Uncle Water Jug.
Technical Specifications: The company is specifying a 1.5% accuracy weight with no max rider weight. As noted earlier the rechargeable batteries should last about 80 hours, and take about 2 hours to recharge. The units do include a low-battery warning that will trigger and notify your head unit.
Waterproofing: The units will be initially certified to IP64, but are looking to achieve a higher level than that. That basically means splashing/rain/water is OK, but you shouldn’t use the power washer on the pod portion of the unit.
Bluetooth Smart compatibility: They’ve tested both the Ambit3 and Polar V800 for compatibility, and both are working.
Non-round ring support: At present they don’t believe this will be a challenge for them, based on the way they measure today. However, it wasn’t something they had absolute proof on.
Beta Test Teams: They currently have roughly 30 riders concurrently using them out in the wild today, including European pros and the Israeli National Teams.
Initial Thoughts:

Ultimately, I’m impressed with where they’ve gotten over the last year. They’re clearly very close to shipping status, especially if they can polish out the few (hopefully) minor bugs that are outstanding. Their installation process was much easier than I envisioned, and likely even easier and simpler than I make it look here (trying to convey detail can sometimes lead to making something more complex than it really is).
Of course, they still have to get through the manufacturing phase – which no doubt has in the past seen giant and small companies alike, including Garmin and Brim Brothers, struggle for years before release. On the flip side, there’s slightly less internal manufacturing complexity in this product than either of those units.
If PowerBeat can succeed in shipping before the holiday season, then that’ll definitely apply downward pressure on pricing going into next spring. However, I would not expect any of the major power meter companies to react to the ordering/shipping status until consumers start receiving units in hand. And of course, we still have the Eurobike/Interbike announcements sweep coming up starting August 27th through September 16th. There will no doubt be power meter announcements there, and those announcements could certainly drive pricing in both the near and long term.
With that – thanks for reading, and feel free to drop any questions below.
FOUND THIS POST USEFUL? SUPPORT THE SITE!
Hopefully, you found this post useful. The website is really a labor of love, so please consider becoming a DC RAINMAKER Supporter. This gets you an ad-free experience, and access to our (mostly) bi-monthly behind-the-scenes video series of “Shed Talkin’”.
Support DCRainMaker - Shop on Amazon
Otherwise, perhaps consider using the below link if shopping on Amazon. As an Amazon Associate, I earn from qualifying purchases. It doesn’t cost you anything extra, but your purchases help support this website a lot. It could simply be buying toilet paper, or this pizza oven we use and love.