
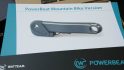
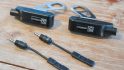
Last week while at Interbike I got to not only check out, but actually install, the much talked about $499 PowerBeat system on my bike to take it for a short test ride. This proved useful in getting a first hand look at the installation process as well as how the accuracy is looking.
Of course, keep in mind that the system is an early prototype system. Which means that things that go great can falter later, and things that are troublesome now can be perfect at release – which is planned for 9 months from now. While the tests were short (and the system was removed from my bike afterwards), they did still prove useful in being a small window into the development progress of their product.
Installation:

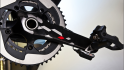
To begin, we wiped down a bit of my crank arms with some alcohol to clean things up. Nothing fancy as you can see. Speaking of the crank arms, for the sake of the heck of it, they were ‘diverse’. On the drive side (right) it was carbon, whereas the non-drive side (left) was aluminum. This was simply because the non-drive had a Stages Power crank arm on it, and thus the current aluminum requirement. The Watteam guys found this kinda neat as it allowed them to demonstrate how the system works on either material, which can be a challenge for some power meters.

On the bike for the initial evening we’d be installing the small strain gauge sensor portion, which is the piece that is glued on. Here’s a small collection of them. One is needed per crank arm.

They’re still working out what the final consumer installation process will look like, but for now they have this fancy ruler with a hole in it to align the exact install location.

Next, was applying glue to the sensor. I’m told it’s simply super glue.

Next, the sensor is placed on the crank arm in the specified location. There was no sanding or alteration to the crank arm itself.

Next, the sensor was held on for about 20 seconds to let the glue initially set before letting go.

Now for reasons that weren’t clear to them or me, this particular crank arm ended up being a bit finicky for the glue to set. Super glue simply wasn’t staying glued initially. It took a few go’s and re-cleanings and then it set and stayed put. They noted they’ve done tons of cranks, including these exact ones before without issue previously.

With the drive side down we flipped the bike around and did the other side.

This side went on instantly without issue. A small bead of glue was added along the edge of the sensor as well.

Lastly, before we wrapped up for the night to let the glue harden, we quickly validated the sensor measured something (anything really).

It did without issue, next, let’s talk about calibration/configuration.
Calibration/Configuration:
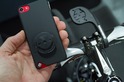
Before we let the glue set and did the calibration they brought out their phone app to validate a few things. This demo/utility app enabled the ability to turn on strain gauge display, the zero set, as well as the angle of the crank itself (plus cadence, left/right power, and total power up top).

To demonstrate the sensitivity of the platform, they went ahead and simply placed their finger on the pedal, which immediately made the strain gauges jump (seen in next photo below this).

You can see that the SG value on the left went from 752 to 763 (the zero value). Note however that wattage didn’t increase because there was no movement factor (cadence).

Of course, this is a very basic test that any power meter company could demonstrate. It’s the chef’s equivalent of boiling a pot of water. But, it does at least show the sensitivity of the system, since it was not calibrated yet at this particular point.
Next, was the calibration piece. Calibration wasn’t done until the next day, after the glue had set. They did this prior to my secondary arrival however, but did outline the two step process:
1) They aligned the cranks level to the crank (3 o’clock/9 o’clock position)
2) They then added a known weight hanging off the pedal (on each side)
The app then took those values and determined the calibration values of each crank arm, which was used for the remainder of the test.
Note that for this piece they did not use the water weight approach, but rather a static known weight. I suppose that while I would have preferred them to use the planned water approach, that is some 9 months away from release so it’s somewhat acceptable for that piece to still be in flux.
Also note that the glue did harden for a total of 24 hours, per their guidelines.
Two Brief Tests:
Next, comes some tests. While I would have loved to go outdoors with the tests and wander for a ride, there were a few factors that made that challenging. First was that they were concerned if there was a crash that they’d lose one of the few current generation prototype transmitter pods they had (personally, I would have been more concerned about my body in a crash, but…I understand). Second, and perhaps more importantly was that the unit isn’t yet enabled with ANT+ or Bluetooth Smart for regular capture transmission. This means that it would have been incredibly difficult (actually, impossible), for me to gather the data outdoors in a way that I could normalize and compare against other power meters.
In fact, I’ll give the Watteam guys credit in that in less than 24 hours between my initial arrival and me mounting the bike they came up with a laptop based solution to export out the data into a CSV file that I could compare with at 1-second rates. The challenge was previously they only had recorded data at a much higher rate, based on stroke position – which isn’t something I could compare with any other power meter (like apples to watermelons).
As for the test, it was indoors on a trainer after the show had closed for the day. The test was a wee bit shorter than I would have preferred, but unfortunately due to some initial delays the timing then conflicted with other meetings I had – so this will have to do for now. I think it still gives a good picture.
For the test I had my own bike with all of my own power meters. I had a Quarq Riken, PowerTap G3, and Stages Power (all units I owned). I also had Brim Brothers on there (loan in test). Plus of course the PowerBeat we had installed the night before. This was all on a generic magnetic trainer that I could control resistance via a little lever or just changing gears.

All the ANT+ data except the PowerBeat was recorded concurrently via an NPE WASP unit and also to a barrage of Garmin Edge units serving as a backup.
For the test I basically just started off relatively easily and then continued increasing resistance. I then did some higher intensity sprints (closing in on about 800w), as well as did some higher cadence work (about 160RPM). Essentially just a mix of different wattages and cadences.

After the test I received a .CSV file of the data from them. Because I couldn’t control that data aspect, I can’t be 100% sure it wasn’t tweaked in any way. But they didn’t have any recording of the baseline numbers (only I had that), so the only tweaking they could have done would be to remove random spikes/drops – though I didn’t see any during the test itself.
Now, because of the different recording rates there’s bound to be some slight differences in the data from a timeline standpoint. This is because they’re recorded on different devices (and at different rates), so don’t worry about the fact that one might appear a second or two delayed (or fast) at various times. I do want to thank power guru Dan Connelly, who helped re-align some of the data from the PowerBeat from a mathematical standpoint to refactor the different recording rates…all during the middle of his vacation.
For these graphs, I’ve gone with just the Powertap number versus the PowerBeat. I did that because comparing against Stages wouldn’t really be super useful from an accuracy standpoint (due to being left-only), and while the Quarq data would have been ideal, it was running into some sort of transmission interference in the booth – causing drops I’ve never seen before (or since).
In any case, here’s how things compared on what is a beta/prototype unit some nine or so months prior to release:

As you can see, it generally trended well in terms of going up when everyone else went up, and down when everyone else went down. Here’s a 10-second smoothed version:

Of course, you can also see it was reading a fair bit higher. This was something I noticed during the test as well, primarily in the higher wattage areas where I saw some 1,000w+ numbers flash by at points on the screen (beyond my capabilities, as I usually max out just below 1,000w), though I didn’t see data points recorded with that – which may just be a results of down-sampling the higher resolution data to 1-second.
Below is a max power graph plotted over time that Dan put together, showing the max power allocations for different periods. Do note that since this was a short ride (10 minutes) that fatigue didn’t really set in for me, hence why the Stages is so close despite being left-only. Whereas when these graphs are produced for longer/harder rides, I tend to see more variation with Stages being left-only as my left-leg fatigues slightly differently.

From an overall power standpoint the key here is that it wasn’t randomly higher or lower than everyone else at different points. It also didn’t have any unexpected spikes or dropouts. Thus, it’s more than likely more of an offset/calibration item at this point than poor readings. Also of interest here is that the unit was actually reading on one carbon crank (right), and one aluminum crank (left).
Looking at cadence, here’s how things compared:

As you can see, there things are pretty good. No specific complaints across a wide range of cadences (~60RPM to 160RPM). You’re seeing some slight shifts there just due to trying to align different recording rates and devices together.
Overall, for where they are in the project, I’d say things look promising. But do keep in mind this is indoors, on a trainer, for 10 minutes. It is effectively the easiest possible test compared to outdoors, in a winter of rain and fluctuating temperatures, on the cobblestones. Still, it’s promising.
Finally, after we were done with the test, they removed the unit without any issues from my crank. There were no visible markings from the removal (beyond minor scratches I already had on there prior to giving it to them).
Early thoughts:

Again, It’s important to remember this unit is targeted for next summer. As such, this is really just a snippet of their development window. Things could be better…or worse, at the end-state product. Still, things do look like they’re headed in the right direction. It appears at least initially that they’re on the right path when it comes to measurement of torque on both carbon and aluminum cranks (since I was split across both), as well as the cadence aspects.
The pieces that I think they’ll need to focus on the most will be the installation components. For example – how well does the glue hold up in the rain long term? Also, what exactly will the final attachment cabling situation look like? As it stands now I could easily see that getting ripped off when trying to clip-in. Again though, there are certainly ways around that longer term such as a sleeve or potentially different placement of the sensor component. I’ll give them the benefit of the doubt on both.
Yet, with that, keep in mind that as I often say – I wouldn’t base your immediate power meter purchasing decisions based on products more than a handful of months out from release. That’s just far too out for this market segment, and too many things can go wrong in that development timeframe. I’ll dive into my full set of recommendations mid-next week for power meters as part of my ‘2014 Power Meter Recommendations Guide’ – so stay tuned there. Nonetheless, it’s still an exciting time in power meter development and consumer choice.
Thanks for reading!
FOUND THIS POST USEFUL? SUPPORT THE SITE!
Hopefully, you found this post useful. The website is really a labor of love, so please consider becoming a DC RAINMAKER Supporter. This gets you an ad-free experience, and access to our (mostly) bi-monthly behind-the-scenes video series of “Shed Talkin’”.
Support DCRainMaker - Shop on Amazon
Otherwise, perhaps consider using the below link if shopping on Amazon. As an Amazon Associate, I earn from qualifying purchases. It doesn’t cost you anything extra, but your purchases help support this website a lot. It could simply be buying toilet paper, or this pizza oven we use and love.


I still think that PowerTap is the best out there when it comes to quality, maintenance, price and versatility. Switch the wheel and that’s it. Also i am interested how much power my bike is transmitting to the rear wheel, not the power i have in the crankset. There is a light difference. Too bad their advertising department sucks and leave other companies to promote themselves like they are better.
Out of curiosity, why would you want the power locale further/less from/than what your body is actually putting out?
(Nothing wrong with the PowerTap, just curious about your answer)
…perhaps, like auto racing to see how much power is lost through the bike? Would be interesting to see that with different bikes?
For the difference you’d need a non-hub based pm as well, though. Generally, for what most people are trying to achieve (measuring training intensity/power output), I’d say the closer to the source, the better.
Knowing how much power you are getting to the ground without knowing how much you’re losing through the drivetrain… it’s not really super helpful.
It’s not like you’re gaining an insight into drivetrain losses with a dirty chain or when you’re cross chaining or whatever.
On the days where your drivetrain efficiency is low, your power reading is low, but you’re unlikely to know why its low. And then you’ll train harder than you want to be training to hit ‘your numbers’, or you won’t be able to hit your numbers and won’t know why, or whatever.
I’m not saying PT is a bad solution… but the closer to your feet the measurement is, the less noise there will be, and the more useful that number is.
So from these comments, the takeaway is that pedal based (Garmin Vector) is most useful?
Yes and no. I think the differences we’re seeing between pedal/cleat based power and crank based power is minimal. Whereas you see more impact further down the bike depending on how clean your bike chain is.
That said, I’d also argue that most people probably have larger variations than the difference of those two just from improper calibration/maintenance/validation of their power meter.
Following this line of thought, I thik a generic “how to properly maintain/validate/calibrate your PM” would be nice, if it makes sense to you. This would contain generic (as much as possible) guidance on how to avoid the biggest, more common issues afecting PM data reliability for not-so-tech-oriented bikers
To be fair, if one is looking at using the power meter to determine “demand side” in cycling (i.e. using it for field determination of Crr and CdA) then having the power measurement after the drivetrain is better due to there being less variability in the power measurements. Drivetrain losses vary by gear.
If you want to do field testing for aerodynamics a powertap is better because it is the power output into the road and not at the crank that affects speed. As loses in the drivetrain change based on gear selection, chain/cassette wear, a powertap provides better data for doing multiple sessions and for if you change gears during a test session.
Someone correct me if I’m wrong here, but isn’t heart rate a more direct measure of how hard your body is working than crank/pedal based power? Depending upon when you last ate, hours of sleep, stress level, outside temperature, and previous exercise, your body may be working much harder to achieve the same power number as it did the day before. I know that at the same heart rate, my power numbers vary quite a bit day to day. As long as you’re measuring heart rate and power, it seems like power to the road should be more useful. If you’re comparing HR and crank power, that can tell you how efficient your body is, but it’s missing an important factor in drivetrain losses. Comparing HR and hub power seems like a better way to know whether or not the energy you’re producing is being used effectively.
Good stuff Ray. From Dan’s plot, that difference looks like a torque slope mis-calibration or linearity issue. A faulty bias shift would show as a fixed offset vertically on that chart, no?…oh wait, but only if your cadence was constant. Ah…that points out the value of a constant cadence cassette sweep in this sort of testing ;-). Speaking of cadence, did you point out their mis-spelling of it on their app (cadance)? :-)
I for one am very happy to see an android phone used, even if it is back-of-house stuff!
Looks promising but as you said who knows this far out! Looking forward to the 2014 Power Meter Recommendations Guide, I think I’m nearly ready to purchase and interested to see what your current thoughts are on the unnits I’m looking at, specifically the 2nd Gen Pioneer unit.
You said it. It looks promising.
Although there are many unknowns, so many I won’t even begin listing them up, I keep thinking if they’re willing to show it like this, they are highly confident they can deliver. Not that I would give them any money before it is fully tested and proven on the field, but it helps convey the idea that it’s actually a thing, not just an attempt to draw attention. The proof will be in the pudding ofc.
On a sidenote, I would be a little surprised if they stuck with superglue (pun intended): it’s so brittle, I don’t think it would take up well to temperature shifts and repeated shocks, at least not for a long time. Having to glue the strain gauge over and over would be annoying, especially if it comes off or start malfunctioning when you don’t have time to go through the whole procedure again.
+1 on being dubious about superglue–although there are alternatives. I used to use superglue a lot for an application where the glued items were subject to consistent but light immersion in water (specifics are too weird to even mention here). Over time the superglue bond would just quit and I’d have to reglue.
Great, finally a power meter that displays more watts than the others. Everyone is training to get more watts, so that’s a spot on on this market.
Buy an SRM program in half the value of the slope that is printed on the sticker, get double the watts
I would’ve liked to have seen left vs. right from the Watteam meters. (especially measured against the Garmins)
Yeah the two limitations there were lack of Vector pedals on that bike, and the secondary limitation being that the PowerBeat wasn’t quite yet outputting separate left/right data into the CSV file (they were showing it of course, just not programmed into the app to export). Getting the export out was a completely last minute thing, so I was just happy to have total power at that point.
Totally off topic, but nice shirt by the way! That was the same year that I did Alcatraz and I remember seeing you ahead of me coming across the bridge a mile or two before the end. Good times.
And thanks for all the power reviews. Really looking forward to the bringing-it-all-together article.
Thanks! Yeah, a great race and definitely a fun day!
I love the new technology coming out these days! I’m in the market for a power meter, so your 2014 guide is perfectly timed. I’ll be back!
Interesting to see another cheaper power meter coming into the market. Looks like they’re heading in the right direction in terms of price that we’ll see a shift over the next 3 seasons from ‘most people don’t have one’ to ‘most people do have one.’
Any idea of a UK or Europe release?
http://www.oxygenaddict.com
I can’t help but wonder:
ARE THE GLUED SENSORS GOING TO BE CHEAP?
Now just like the 4iiii PM, these are glued onto the crank arm and you pretty much have to remove the entire crank arm if you want to move it to another bike.
If the sensors are cheap then these are definite winners. To date I still believe that the PowerTap and the Garmin Vectors are still the easiest to transfer from bike to bike.
If Watteam can find a way to avoid glueing those things or sell the sensors for relatively cheap then that would be excellent.
Stages uses glued sensors, and outside of a single bad batch there – no issues.
Based on my experience super gluing a tiny neodymium magnet to my crank, the glue won’t work reliably. I went through three magnets before going back to electrical tape. Something I’m planning to try soon is FiberFix (carbon fiber tape w/ resin). Maybe Watteam should partner with them.
According to Watteam’s Facebook page it looks like the powerbeat is in its final stages of testing (by the looks of it they have also made some significant improvements to the design as well). DC have you heard whether your going to receive a product to test soon?
Yup, I’ve been in touch, and it looks like things are moving along.
That’s exciting. I’m looking forward to your next Power Meter Roundup post with all of the rapid movement (and plummeting prices) in that space.
It also strikes me that at this price point there’s lots of room for the LBS to do some value-added installation and calibration services, which could really help promote their product. I could even see a moderately standard offering, something like $499 DIY, $599 installed, that folks could partner up on.
Any update on when there will be a review of the Powerbeat? Any updates on release of this one that you know of?
We were attempting to schedule something (install at my place) for next week, but it looks like that won’t quite happen. Was very last minute, so don’t blame them. Hopefully later in the month for an install for me, which then would allow me to give an update on where they stand. An in-depth review of course requires a month or more of data.
Out of curiosity, have they managed to send out units for reviews? It’s been a bit quiet from watteam lately.
Websites looking – like well a website now – still hasn’t got a lot of info but the actual product looks “finished”.
Anymore news on dates / tests ?
cheers
Jim
I spent last week riding a nearly-final pair of them. I’ll have my post and data up later this week.
Can you include the Brim Brothers data to your comparative results?
Thanks
Ray,
what features will Power Beat provide? Are there any advanced features or Just cadence and power? What about cycling dynamics, power distribution, etc.?
It does provide Left-right power distribution.
Correct. It doesn’t provide Cycling Dynamics because Garmin has locked that down to only Garmin products.