DC Rainmaker Review Updates:
Got two items of note today for you. First, the most important one (ok, that’s probably debatable). Over the past week I’ve been slowly chipping away at adding in a bunch of updates to the FR910XT review that I posted back in October. A bunch of sections were updated/added/clarified/photofied. They are as follows:
– Openwater swimming comparison/details (lots of pretty Bora Bora pics too!)
– Indoor pool swimming troubleshooting section
– Paddleboarding section added
– Skiing section added (snow sports)
– How to edit our swims (fix errors) section added
– Ultra-long battery methods (55hr+)
– Random other updates sprinkled about…
This is in addition to the sections I added a few weeks ago with all the details on the new quick release strap, extender strap, and fabric strip.
The biggest item of note is really the pool swim troubleshooting section. I’ve been getting lots of questions on how to get accurate swim data. Given I’ve managed to actually only have a single miscounted lap in 5 months of using the FR910XT, I figured I may be a good one to offer some tips on it. So, I go into a Top-10 style list of ways to get accurate data. If nothing else, you might find it funny.
As usual, I continue to answer questions on the FR910XT posted to that thread…up to nearly 400 questions in total. Crazy!
And finally, last night (Wednesday) I got my pile of FR910XT’s that I ordered from Amazon (both January and February orders). People in the know have stated that Amazon’s backlog should be basically cleared now (and that’s reflected in that you can buy a FR910XT and have it arrive next day). Good stuff…now, what to do with those FR910XT’s?
Garmin Connect Updates
Yesterday Garmin Connect added a bunch of updates to their online training log platform. Many of these updates have to do with power and analysis of it. Without too much more preface, let’s dig into it.
First up is the addition of TSS/NP/IF into the sidebar. Note that these metrics are ONLY calculated at this time for rides done with a device capable of displaying TSS/NP/IF.

This is inline with the support of these TrainingPeaks metrics in their other device products (currently only Edge 800, but soon coming to the Edge 500 and FR910XT). Unfortunately, there doesn’t appear to be a way to calculate it for other rides not done on these devices – which is too bad, as it would have been a nice benefit.
As always, remember that if you’re using TrainingPeaks online, you’ll want to ensure that your FTP value is set identically between TP and GC and the device itself. Otherwise, things will get all dorked up (they won’t match).
The next item of note is that all of the graph windows are expandable. This is much better, as the previous graphs were the size of Ritz crackers, and basically not terribly useful for analytics. At the corner of every graph is a little expandomatic button:

Which in turn, expands it to a much larger window. I do wish though that they would put some simple mile/time marker vertical lines up though. Note that the new expandomatic feature is applicable for ALL graphs within Garmin Connect (HR/Pace/Speed/Cadence/Power/etc…).

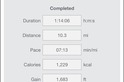
Moving back into the power side of things, you’ll now be able to show Max averages for 5-second, 1-min, 5-min, and 20-min. Or, just simply select your own timeframe (in either minutes or seconds). This basically gives you the average maximum for that time period. Meaning, if you selected 5 minutes, it’ll find ‘highest’ 5 minute period.

You can see here if I change the setting to 5 minutes, how it looks. You can see that the highest 5-minute average for this ride was 290w, and it occurred between minutes 22:35 and 27:35.

Meanwhile, if I change it to 1-minute, you’ll see the highest was between 1hr 19m and 35s, and 1:20:34, where I maintained 309w.

Make sense? Good. If you want to play around with how the data looks, feel free to use this activity of mine since it’s a bit longer and easier to see.
Finally, they now support left/right power and/or power balance, for ANT+ enabled power meters that support it. Today, that’s basically the SRAM RED Quarq 2012, but obviously this feature is for Garmin Vector, when it comes out this summer. Additionally, it’ll benefit Brim Brothers, O-Synce and Pioneer, with their ANT+ enabled left/right power meters when they come out.
The first thing you’ll notice is that the sidebar now includes a quick left/right summary for activities that have the data:

But the main deal is that there’s a new chart in town, which is like the rest of the charts, except dedicated to left/right power.

If you expand it (click the image below), what you’re essentially looking at is two graphs, on two different levels, combined into one graph. The upper portion is the right leg aligned to the right axis numbers, while the lower portion is the left leg with the left axis numbers. They could have made this slightly less confusing if they had simply aligned the ‘Left %’/’Right %’ descriptors either up or down on that graph. But, if you stare at it long enough it’ll make sense.

(Note that Garmin says they are still refining the left/right graphs a bit. Given that literally only a handful of folks have devices capable of capturing this data, it’s a reasonable thing to still do some feedback/refining development cycles)
Garmin Connect is bit different than TrainingPeaks implementation in that TP doesn’t actually have a graph function for left/right power today. But, they do allow better analysis of the data within TP since you can slice/dice the data more easily. But Garmin themselves has made public statements that for the advanced cyclist, TrainingPeaks is really the better option.
Now, Garmin Connect does have lap left/right power, but it’s a bit more difficult to analyze that way because you can’t re-arrange the columns like you can in Training Peaks. So you’re constantly scrolling left/right.

Got all the changes? Make sense? Good. If not, feel free to poke around at the above file with the Quarq I did last night (which has power balance). Note that one of the intervals may look like I was having trouble…and I was, my tire was slipping a bunch – so I had to get off and fix it. No worries, but just for the Wattage heads amongst you, why it looks the way it looks.
Now go forth and analyze! And as always, feel free to drop questions below. Thanks for reading!
FOUND THIS POST USEFUL? SUPPORT THE SITE!
Hopefully, you found this post useful. The website is really a labor of love, so please consider becoming a DC RAINMAKER Supporter. This gets you an ad-free experience, and access to our (mostly) bi-monthly behind-the-scenes video series of “Shed Talkin’”.
Support DCRainMaker - Shop on Amazon
Otherwise, perhaps consider using the below link if shopping on Amazon. As an Amazon Associate, I earn from qualifying purchases. It doesn’t cost you anything extra, but your purchases help support this website a lot. It could simply be buying toilet paper, or this pizza oven we use and love.