[Please Note: As of June 18th, 2013 I have published an in-depth update for the Stages Power, based on new firmware. Please see that update post here. While vast chunks of this review around background/unboxing/etc remain unchanged, I will note in sections that may be affected. Finally, in an effort to consolidate questions/feedback, I’ll be closing this review to new comments – but any new comments may be left on the updated review. Thanks!]
Since its announcement at Interbike this past year, no power meter has caused as much Internet discussion and debate than the Stages power meter. It was previously named “StageOne”, but has since simply been renamed to Stages Power. The unit attracted attention for two reasons, first was the low $699 price point – and second, was the fact that it only measured on the left leg.
Stages Cyclinghas provided me a trial unit test out. Since installing it on my bike I’ve been using it near-daily, mostly with various beta firmware drops, but more recently in pretty-close-to-final (if not final) firmware versions. In doing so, I’ve got a pretty good grasp on how the unit works, as well as all the inside and out details. Because I want to be transparent about my reviews, once my evaluation period with the Stages PM has elapsed, I will send the crank-arm back to them in Boulder, Colorado. Simple as that. Sorta like hiking in wilderness trails – leave only footprints.
Lastly, at the end of the day keep in mind I’m just like any other regular triathlete out there. I write these reviews because I’m inherently a curious person with a technology background (my day job), and thus I try and be as complete as I can. But, if I’ve missed something or if you spot something that doesn’t quite jive – just let me know and I’ll be happy to get it all sorted out. Also, because the technology world constantly changes, I try and go back and update these reviews as new features and functionality are added – or if bugs are fixed.
Cut To The Chase Summary:

(As part of the survey last week, some of you expressed an interest in a cliff notes version of the review at the beginning of the review in addition to full review. We’ll see what you think.)
This is the executive summary version of the review. It doesn’t cover all the detail that the few thousand other words and hundred plus photos do, but it gives you the quick version. As always, there’s substantial detail (especially around pros and cons) in the full review, and as is usually the case in all products – the devil is in the details (both good and bad).
Overview: The Stages Power Meter (no longer called StageOne) is a left-crank arm based power meter that measures your left leg power and doubles it to determine total power. It does this by attaching a pod to the crank arm of an approved crank. These approved cranks must be purchased from Stages, due to the attachment/baking/curing process of adding the pod to the crank arm. The pod adds 20g of weight – which is the same weight as a Kraft American Cheese Singles slice. The crank prices start at $699, which is a bit below other hub-based systems out on the market today. They have a slew of crank arms on the market today, though are missing notables like ROTOR cranks. In general, they’d prefer to partner with everyone and their cousins, but it’s up to the crank arm company to ‘approve’ of the solution. Stages won’t offer a pod for a crank unless the crank-arm company is willing to still ensure the system is certified and supported. While some would prefer Stages simply add pods to both crank arms, that would more than double the cost (the drive side crank-arm is much trickier due to space limitations), and, they aren’t terribly interested in being another $2,000 power meter product.
Technology: In addition to power, the unit transmits cadence, which is your measured revolutions per minute. It does this via accelerometers within the unit, there are no magnets required. The unit is unique in that it’s the first non-trainer power meter on the market to include BOTH Bluetooth Smart and ANT+ in it. This is also noted on the small pod attached to the unit, with both the Bluetooth Smart and ANT+ logo. This means it’s backwards compatible with ANT+ cycling computers like Garmin units and other manufacturer units. The Bluetooth Smart side means it’s compatible with Bluetooth 4.0 phones such as the iPhone 4s/5 and some Android phones. Though, at present there are no Android phone apps that would support this due to lack of API to access the Bluetooth Smart power meter device profile. Same goes for Windows Phone and Blackberry. In time, those will come. On the Mac side, Trainer Road supports it today, and you’ll see a few other apps come for Mac and PC in the coming weeks and months.
Setup: Installation is without question the fastest power meter I’ve ever installed. I’m confident my Mom could install this on her bike. It will take a torque wrench to complete properly however. I wouldn’t risk doing it otherwise, simply because if you hose up the torque values you’ll likely break something. Over torque means it might crack a component. And under torque means it could fall off, breaking you. Installation can be done in about five minutes tops. Calibration for the unit merely involves holding the crank-arm either up or down vertical, and then leaving it alone for a second.
Day to day use: From this standpoint, it acts just like any other left crank, and operates just like any other power meter. It transmits standard ANT+ and BLE power meter values, which complies with all head units out there (of each type). So the limitations from a display standpoint are the same as any other power meter. I found the accelerometer-based cadence impressive from an accuracy standpoint, more than reliable enough for any cadence focused training or racing you may be doing. The pod is waterproofed to IPX7 standards, and thus can hang out in a puddle of water 3 feet deep (1-meter) for up to 30 minutes. I’d suggest if your bike is underwater for 30 minutes, something has gone horribly wrong. There’s no issues with temperature drift, as the unit includes temperature compensation which is dynamic based on the rate of temperature change.
Accuracy Testing:
[Note: This section is impacted by the new software update. See updated review.]
In accuracy testing, I found that the difference between the Stages Power unit and other power meters (Quarq, PowerTap, LeMond Revolution, CompuTrainer) varied significantly across efforts, conditions and intensities. At this point I don’t have any definitive trending as to be able to identify which situations work, and which don’t. But ultimately that becomes the core of the problem – the inability to count on it 100% (or even 90% of the time) makes it tough from a data analysis standpoint, as well as a pacing tool in races or training.
Cut to the chase summary:
[Note: This section is impacted by the new software update. See updated review.]
In summary, at present I don’t feel that the Stages Power unit will work for me as my primary power meter. The variations in data from workout to workout, and the variations within a workout make it difficult to analyze and come to meaningful conclusions on power-focused workouts. I do however feel that with more work on the software side, they may be able to stabilize some of the power outputs and ultimately simply have a known offset (due to left-leg power). However, there are still significant unanswered questions around how stable ones power balance is from left to right on both an individual basis, as well as throughout varying conditions over the course of training or racing.
Unboxing:
The Stages power meter comes in a relatively simple cardboard box. In effect, they’re replacing whatever shipping material the new crank would otherwise come in, and replacing it with their own material. Thankfully, no crazy plastic here to deal with (the kind you cut your fingers on).


Crack it open and you’ll find the crank arm looking up at you, semi-shrink wrapped inside.

Upon pulling the cardboard insert out, and you’ll see that there’s two CR2032 batteries in there, along with a small slip of paper. Behind that is the original instructions from the crank-arm vendor for installation of the crank.


That little slip of paper includes two stickers. These stickers list the ANT+ ID of your power meter. While there’s also a unique Bluetooth Smart GUID (rather long) to go along with that, you’d never manually enter that ID in anywhere, so there’s little point in printing out a 12” wide bumper sticker for it. And while the ANT+ ID doesn’t need to be manually entered in, it makes it super-easy to do so if you have to at the last minute and are near others. You can see there’s also a sticker already on the unit itself, so these are extra.

The unit ships with two batteries. You’ll only need one. The unit is designed to get about 200 hours of battery life per CR2032 battery. These batteries only cost a couple bucks at the drug/grocery store, or you can buy them online in bulk like I do. Get a five-pack of them for $5. Or, a 100 pack for $30 (ya know, if you coach a pro cycling team or something).

As I noted above, below are the crank-arm instructions as provided by the manufacturer of your chosen crank-arm. There’s something like a 100 different combinations that Stages supports, so obviously the manuals will differ slightly by model/vendor/tidal conditions.

Taking a closer look at the crank-arm itself, you can see the pod that’s been added on there. I’ll talk more about that in another section.

If you flip the unit over, it’ll look no different than any other unit on the market.

And in total, here’s all the parts that matter:

From a weight standpoint, the pod adds a total of 20g of weight. To put that in perspective, I wandered around the house trying to find semi-common items that weighed 20g. In the end, one slice of singles cheese (with wrapper), is equal to 20g:

Yes, that’s all:

I don’t usually tend to be one to fuss over every last gram, especially when you put it in perspective like above. In short, eat one less piece of cheese.
Battery:
Just a super-quick section on the battery. The unit uses a CR2032 coin cell battery. This is the same battery used in almost every ANT+ device made these days (footpods, speed/cadence sensors, heart rate straps, etc…). They are commonly available and cheap.
To access the battery cover, you’ll just pop off the little plastic cover using the tip of your finger. You can see the o-ring inside, keeping it waterproof.

The battery is designed to get approximately 200 hours of active battery life before you swap it out. It’s a touch bit lower than traditional ANT+ power meters, but keep in mind it’s capable of doing both Bluetooth Smart and ANT+. If you rode 10 hours a week, you’re still talking nearly 5 months of usage before you had to pay $2-3 again.

As noted above, if you do as I do just buy your batteries online in bulk. Way cheaper. That way I have a few batteries with me.

The unit will however let you know when you get to a low-battery condition – and it’ll notify you via your head unit.

Size matters on your crank:
One final semi-oddball note before we dive into things. One of the major strengths of a power meter like this is how quickly it can actually be moved from bike to bike. Additionally, it could be moved to rental bikes relatively easily. That’s ideal for someone like me who’s constantly travelling. For example, this next weekend I head out to Seattle. I have a bike there, as does my Dad – both are viable options to put this crank-arm on. Perfect you say, right?
Well, mostly.
As I found out upon hanging out with the TSA folks in the Denver International Airport, the Stages power meter attached to the crank arm of my choice was actually just a touch bit too big for the carry-on allowance. I recognize that checking luggage isn’t a huge deal for most people (and thankfully that night I had tons of time), but it is something you should at least be semi aware of when travelling. Obviously, I don’t think it impacts purchasing decisions, but note that the TSA length limit for heavy metal tool-like objects is 7” inches for carry-on luggage. There’s no limit for checked luggage. This particular crank-arm was about 8.25 inches (the TSA Officer did indeed measure it).

Again, not a purchase-influencing decision, but more of a ‘nice to know’ if you travel frequently like me. Ok, on with the installation!
Installation:

(Note: Your installation may differ slightly, as there are some 100 different crank-arms and cranks that they support – including crank lengths. So just keep that in mind)
Without question, installing the Stages power meter is the easiest crank-region power meter I’ve ever installed. I say crank-region, meaning anything within about a 6-8” of that area. It’s probably technically easier to just install a pre-configured PowerTap wheel, but as far as crank-based things go – this is hilariously simple. Even my Mom could do it (no offense meant Mom).
First, you’ve got your existing non-drive side crank-arm on there (btw, non-drive side simply means the side without the chainrings (the spikey things)):

Before you go and take off your crank-arm, take off your pedal first. Trust me, it’s WAY easier to take off a stubborn pedal when it’s still attached to your bike, than trying to do it in your lap.

Using a pedal wrench is easiest. But lacking that you can just use a hex wrench from the backside of the pedal.
Now, onto the crank-arm.
You’ll go ahead and use a hex wrench with some leverage to get it off. In my case, I just went with the same torque wrench I’ll use to put on the new crank in a minute.

It shouldn’t be too tough to take off. If you’re not sure which way to turn, the bottom bracket actually tells you. Dust off any dirt down there and you’ll find the arrow pointing for the direction to tighten. Just do the opposite of that.

Ok, all off? Good, should look like this:

Now comes the ‘installation’ part. See your crank-arm? Stick it on. Be sure that you don’t put it on in some funky direction. One arm up, one arm down. Doesn’t matter which is up or down, just ensure they’re opposites.


Next, take your small hex wrench and tighten it up until it’s snug.

Then, take your torque wrench and tighten it to the limit specified in your instructions. It’s written there. Really, don’t over-tighten it. Bad things happen. Puppies and unicorns cry if you do.

And finally, add your pedals back in:


With that, you’re installed:

Now personally, anytime I mess with parts in this region on my bike, I prefer to do a trainer ride first. Just to ensure everything is good. Even if only for 10-20 minutes. Obviously, if you feel confident in your self-mechanic skills, then no need. But me, I’m more about technology than bike mechanic master. So I’d rather something go wonky on the trainer, than on a hill at 30MPH. Just sayin’…
Calibration:
Ok, next comes calibration. This is pretty complex – so hang in here with me. First, you’ve gotta take the crank arms and have one pointed at the ground, and one at the sky (or ceiling as it may be). Like this:

Then, you’ll dive into your cycling computer head unit and into the power meter section:

Then you’ll press calibrate:


Ok, you’re done.

Seriously, that’s it.
The tolerance here is is a few degrees, so it doesn’t have to be absolute perfect straight up and down. You can see below that if I have it offset a bit, the calibration will fail:

At present, there is no end-user calibration validation option (such as static test like hanging weights), though I understand that may be on the table in the future.
With that, we’re almost ready to go. One last stop in functionality before getting into how the unit works.
Updatable Firmware:
The Stages Power unit’s firmware can be upgraded by end users down the road. Myself, during the beta process I did this a couple of times. Doing so requires a Bluetooth Smart (BT4.0) compatible device, such as an iPhone 4s or iPhone 5 (or some newer iPads). Today, they only have a private (non-published) app for doing the firmware updates, though I expect we’ll see that expand in the coming months.
Just to give you a rough idea of how it works however, I simply get within Bluetooth Smart range of the power meter. This allows the app to make a connection via Bluetooth Smart to the Stages PM.

Then, I click to update the firmware file to the most recent version available. Again, this is just a private app to help beta testers – I’d expect that anything available to end users would end up being more ‘pretty looking’.

The whole update process took perhaps 60-90 seconds depending on which version. I needed do nothing more than just hang out. For those keeping track at home, I’m running on a later version than this (1.0.55, which is the version used for all tests shown here as of 1/18/13).
While the update process probably could have technically been done via ANT+ (with a Wahoo Fitness iPhone adapter) similar to how Garmin watches update, today it doesn’t support that. I wouldn’t expect to see this added, given the general trend towards using the Bluetooth side of the cell phone, rather than adding an ANT+ adapter in there.
How the Stages power is built and works:
The day prior to CES 2013 (early January), on my way to Las Vegas I stopped in and met with the Boulder, Colorado based Stages Cycling product team for the day. During that timeframe I got to see everything from how the units worked there way through testing and validation, to how they are baked onto the crank arm. Along with hours upon hours of technical questioning. And just for clarity, I paid my own way (flight) there, as well as hotels/car/etc.
Thus, let’s take a quick detour through the build process. There’s been a lot of questions about this. First, we’ve got your left-crank arm. That’s no different than any other crank arm out there on the market. That’s because, these are the very same crank arms you’d buy anywhere else. When you order a Stages Power Meter, you select exactly which crank arm (or full crank set) you want to use as the base. These are only units that Stages have full support/warranty agreements with the different crank manufactures – which is many of them. They’d do it for every unit in the world if they could. Stages purchases them brand new, and that’s where the process starts:


Then they’ve got their pods. These little pods are where the strain gauges are, the accelerometer, communications electronics (ANT+/BLE) and the battery. In total, this pod weighs 20g.

This little pod and its stain gauges measure the amount of torque that you subject the crank arm to. Basically, bend in the crank arm as you apply force (pedaling). That force is both predictable, and measurable. Which is ultimately how any strain gauge on any power meter works. Now, the one challenge is carbon cranks. These are tough due to the lack of rebounding back to a ‘known’ state as force is removed. Aspects such as the finish, resin, and the actual carbon affect this as well. From Stages standpoint, it’s definitely still in the R&D phase, but they don’t have any timelines at this stage.

Next, comes getting it on your left crank arm (whichever brand/model you selected). The trick to this is ensuring that the strain gauges are placed in exactly a specific spot on a given crank. This is why they aren’t just selling the pods as a ‘take-home’ kit. Additionally, the requirement purchasing a new crank-arm is to ensure that they are working with brand-new units, and not something that may have scratches/dents or otherwise look like your dog used it as a play toy.
Once the attachment of the pod to the arm has been completed, then comes literally ‘baking’ it onto the crank arm. It goes into an oven (like for a cake, only fancier) and then bakes on there. When I checked out this oven, it looked like a bunch of bats hanging from a cave. Just rows and rows of power meters hanging up inside to cure.
After the curing is complete, they’ll run it through diagnostics tests, and at that point it’s good to go. The entire unit is built and assembled in Boulder. Virtually all of the parts are sourced from within the US, some from even across the parking lot.
Now let’s talk about what exactly the Stages power meter measures – since it’s been the topic of significant debate.
In short: It measures left leg output only and then doubles it.
In long: It measures left leg output only and then doubles it.
There’s been a lot of talk about this very point – and make no mistake, Stages isn’t trying to hide it. In fact, it’s right on their own site:

You see it again in listing their algorithm online:

This is why they are careful to always claim accuracy with the caveat of “as measured”. Specifically their accuracy claim is within that is +/- 2% at 100w with 90RPM. As you increase wattage, their accuracy claim actually increases. For example, at 200w it’s +/- 1%, and at 1,000w it’s even smaller.
With that out of the way, the question then becomes what does that mean for accuracy on the whole system? Well, there’s two parts to this. First is how accurate is the left leg measurements (as claimed above). While there, I got a good look at some of the systems they use to measure that. They had three different automated testing platforms going at the time I was there, all three of which had a robotic foot (for lack of better term) that was pedaling the bicycle on the left crank arm at a specified and changing rate. While this was occurring, the forces were measured and transmitted just like they would be later while on my bike:

The system they used costs tens of thousands of dollars. But it isn’t just for the Stages power meter. In fact, it’s been used for many previous projects. It’s important to note that Stages is really simply an offshoot of the Nautilus company (separate though). And in particular the division that worked on power meters for stationary bicycles that you typically see at gyms. In other words: This isn’t their first power meter BBQ. It is however, their first consumer-focused power meter (BBQ or otherwise).

While there they demonstrated for me the system changing the forces and cadence, and in turn I watched as the ANT+ signal being transmitted would reflect the new value.

Now nobody in the industry really expected this part to ‘fail’. That’s (all things considered) the ‘easy’ part.
Next comes the hard part – how that translates into ‘total power’, and how real that is in comparison to regular users. I’m going to tackle that in detail in the accuracy section. But I want to leave you with one little graph I put together this morning based on a quick six minute test. Hopefully, this will wrap things up in a tidy bow and help you understand exactly what is meant by ‘left measured power’.
The test was conducted with a set wattage of 150w on a calibrated CompuTrainer. The data was captured across three power meters, below is the Stages Power Meter (in orange), and the PowerTap (in Blue). The third power meter, a Quarq, was so similar to the PowerTap it didn’t really add anything other than more lines to the graph, so reduced clutter. Here were the six minutes of the test:
Minute 1: Normal pedaling
Minute 2: Right-leg Heavy. In this case, I focused 100% on keeping the force on the full rotation of my right leg. Both legs were clipped in.
Minute 3: Left-leg Heavy. Same as previous minute, but left leg. Both legs were clipped in.
Minute 4: Right-leg Only. Here I fully unclipped my left leg from the pedal and let it rest on trainer frame.
Minute 5: Left-leg Only. Unclipped the right leg, and pedaled purely with the left-leg.
Minute 6: Return to normal both-leg pedaling.
First, the graph, and then I’ll dive into what you’re seeing (10-second smoothed).

As you can see, the normal pedaling is pretty similar to each other. As I shift into Right-leg heavy (well beyond normal right-leg heavy), you see the Stages power meter (which is left-leg measured), drop significantly. Again, this is an exaggeration of an imbalance for the point of this graph, but it shows the impact. Then, as I shift to left-leg heavy, you see that it substantially increases the measured total power well above what was actually being put out (which was hard-set at 150w).
Next, as I unclip the left leg entirely the power drops to zero. In fact, the cadence also dropped out (which surprised me). The cadence was normal for all other minutes of this test except the left-leg unclipped. As I went into left-leg only with right unclipped, you see the same near perfect doubling of actual power. And finally, as I return to normal power, you see the two stabilize on top of each other.
Again, the point here is to simply illustrate the relationship between left/right, and the fact that the unit is measuring torque (bending) in the left-crank arm, and thus any power exerted from the right crank arm simply isn’t captured.
Lastly, one item of note – when the unit measures power, it takes into account data from the accelerometer. Meaning that if I just stand (without pedaling) on the left crank-arm, it won’t produce a power value, as no angular velocity was occurring. This is expected and logical.
Why not just a heart rate monitor for intensity?
Heart rate monitors report your reaction to a given activity. That reaction though isn’t constant. It varies from person to person. It’s impacted by many things, whether it be fatigue, sickness, sleep, caffeine, or any number of other variables. Understanding those variables can make training with a heart rate monitor extremely useful when used in conjunction with other metrics (pace/power/etc…). However, that is fundamentally different than power. The reaction of the power meter to your output doesn’t change because you only got two hours of sleep. It doesn’t change its evaluation of you because you were sick. Nor does it shift. Instead, it just reports a strain-gauged value. Unlike the human body, that strain gauge value doesn’t shift day to day with sleep patterns.
Now, one can of course argue the accuracy level of the overall Stages PM system based on left leg – no doubt. But one shouldn’t compare it to a heart rate monitor, as the Stages PM doesn’t shift readings as dramatically as a HR monitor can based on fatigue or other factors. Yes, if you are fatigued you will likely put out less power – but, in doing so you haven’t shifted the strain gauges, instead, you’ve just put out less power. Whereas as one who trains with heart rate monitors regularly, I can put out a 250w effort at 130bpm on a fatigued day (HR won’t rise, classic HR fatigue symptom), and then put out that same 250w effort at 150bpm on a normal day. If I had just used HR as my barometer, I would have been offset due to my fatigue. But with a power meter (including the Stages), I’m able to see the actual output. Now, the real value starts to occur when you can meld these two together over time and understand your own training patterns.
Day to Day Use:
I won’t focus on this section too much, other than to note a few quick items. Since having the unit I’ve rode in sun, rain, cold, wet and even a touch bit of unexpected snow. Smooth streets and cobbled streets (welcome to Europe). Flats of Paris, and the mountains of Colorado. Been there, done that. No issues or oddities seen in those scenarios.

Temperature changes are accounted for within the unit itself. There’s no expectation that you need to constantly recalibrate or otherwise zero the unit frequently – even during significant temperature change events. the unit automatically takes into account temperature change and shifts correspondingly. It does this based on the rate of change (i.e. faster if you’re descending, slower if you’re climbing). With Stages office being based in Boulder, at the foot of a slew of cycling routes with significant climbing, they’ve found they can go weeks without running a calibration routine – despite the climbing and changes in temperature.
In my day to day testing across temperatures from the low-20’s (*F) to about 50*F outside and 70-75*F inside, I haven’t seen the calibration value ever slide more than 1-2 units (that’s not even watts, that’s just a numerical number).

As noted earlier, the unit is IPX7 waterproofed, which means it can hang out in a riverbed 3 feet deep (1 meter) for 30 minutes before it starts to have a bad day. I haven’t seen any issues from mud or rain either during my rides:


When it comes to viewing the data, the data is transmitted in both ANT+ and Bluetooth Smart. On ANT+, it’s transmitting as a power meter device profile with cadence information included. It does not transmit speed information. The power meter is compatible with any number of ANT+ head units out there, including popular units like the Garmin Edge 500/510/705/800/810, Forerunner 310XT/910XT, CycleOps Joule 1/2/3/GPS, Timex Cycle Trainer GPS, Magellan Switch Up, Motorola Motoactv and many other units out there.

Within those units, all of the same metrics you’d get from a power meter are supported on the Stages PM. The only exceptions being the ‘Balance’ metrics (for left/right balance) – which aren’t included as like most power meters on the market today, it isn’t measured.
Via ANT+, it’s compatible with any ANT+ enabled iPhone apps via the Wahoo Fitness iPhone adapter, as well as on Android phones that have ANT+ built into them.

On the Bluetooth Smart side, it’s compatible with Bluetooth Smart enabled phones (such as the iPhone 4s/5), and apps that support the Bluetooth Smart power meter device profile. Today, that’s fairly limited actually to really just the Wahoo Fitness app (updated variant, coming in the days ahead) and the Kinetic inRide app (supports Bluetooth Smart power meters). Additionally, you can pair it with Trainer Road on a Mac (but not yet a PC), as well as upcoming builds of Golden Cheetah on a Mac.

In general, you’ll see any apps that support the Wahoo Fitness KICKR, will also support the Stages power meter – because they share the Bluetooth Smart power meter profile. So expect to see that supportability front explode over the next 30-45 days.
Finally, indoors. Again, no issues here at all. Unlike some other low-end power meters on the market today everything is measured at the crank-arm, so there’s no dependency on a specific trainer or knowing a trainer power curve. As long as you’re pedaling, it’s measuring. Simple as that.

Cadence Accuracy:
[Note: This section is impacted by the new software update. See updated review.]
Cadence measures how frequently your crank arm completes a rotation, measured in Revolutions Per Minute (RPM). Typically you’ll find most cyclists in the 80-100RPM range. There’s plenty of religious thought as to whether you should be high cadence, low cadence, self-selected cadence, or something else entirely. I’m not here to debate that. Instead, I’m just going to focus on how well the Stages unit does reporting your cadence, whatever that may be.
The Stages power meter uses an accelerometer to determine cadence. This means that there is no magnet installation required, nor any other sensor required on your bike. It just does its thing internally to the pod attached to your crank arm.
Over the last three weeks I’ve spent a LOT of time looking at cadence accuracy. Mostly because I have a lot of indoor trainer workouts that include specific cadence RPM levels. So, I’m aiming to hit those workout specifications.
In doing so, I’ve looked at cadence from three different perspectives:
1) The Stages Power Meter reported cadence (accelerometer)
2) An external cadence sensor (standard unit with magnet on crank arm)
3) A crank-based power meter with cadence magnet (Quarq Cinqo)
Test after test, I’ve found the Stages Power Meter aligns quite well to all three. I don’t see any notable lags in display of cadence changes, nor did I see any strange anomalies.
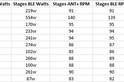
Below is a simple indoor step-test of cadence from 50RPM up until 150RPM, at 10RPM increments at one-minute per step. Following which, I did a handful of spin-ups to between 195 and 200RPM. You can see how well the units track:

(Note: A small 10-second drop section was removed – where the ANT+ sensor detail dropped out entirely, an earlier beta bug)
As you can see, they’re all virtually spot on while indoors. If you look at this from a difference standpoint, the below chart plots the 5s running difference (to account for 1-2s latency). Only two spikes as I ‘spin-down’ back off the 200rpm spin-ups.

Outdoors, we see a wee bit more variation in cadence, but not enough that I personally noticed it myself on the ride. Though it seems quite visible in data later. Again, we’re talking a very small difference here while riding, but something that shows up later in charts. First, the two overlaid:

Below is the chart plotting the difference – again, smoothed over 10-seconds. This is where you start to see some of the variations.

What’s interesting is that during that middle section I was largely very steady-state, so it handled quite a bit better there than other sections where I was out on more city streets and generally had less stability in my power output (surges, slow downs, etc…). Some of that difference may be latency, and some of it may be measurement differences.
The below graph helps to pull it together a bit more (for the outdoor ride). Each panel is a plot of cadence vs. crank torque (cadence in RPM on the x-axis, crank torque in Nm on the y-axis). If you could zoom in, you’d see that over the “normal” range of cadence the Quarq and PowerTap are almost on top of each other, while the Stages is reporting slightly lower crank torque.

Above cadence graph provided by Robert (more on his analysis in a second). [Update since there seems to be some confusion] However, a brief note about the above chart. It does NOT show that cadence itself is inaccurate below 60RPM – I found that to be fine (at least indoors). Rather, it is referring to Torque against cadence below certain values.
It seemed to me that most of the difference came from shifts in cadence, rather than holding a given cadence. In other words, if you’re focusing on holding a given cadence, this probably isn’t too big of an impact as things were quite steady (both indoors and outside). But when it comes to post-ride analysis, that’s where you see things surface.

(Note: The single random offset at about the 13 minute marker in the upper graph is the result of the Stages Power unit dropping the ANT channel for a few seconds. I wouldn’t hold it against them in this case as I haven’t seen it since.)
Now, there is an impact on power accuracy when it comes to cadence with the Stages PM, but I’ll cover that in the power accuracy section next. The above just focuses on the cadence portion.
Power Accuracy Testing Results:
Upfront, let me clarify something: This next section may or may not mean anything.
Why’s that you ask?
Well, it’s based on my riding. And in particular, it’s based on my cycling leg power distribution (left vs. right). In fact, every review you’ll see of the Stages Power (in the near-term), will be based on that riders leg power distribution. Over time we’ll no doubt see more detailed studies on this – ideally ones involving lots of riders of varying abilities. Not just a pro team, but a good cross section of riders in everything from normal day rides to high performance racing.
For now, you’ve got just me. :)
This means that no matter how accurate (or not) the data below is, it’s only at present just one persons accuracy level (mine). You could be different. You could be the exact same. You could be more accurate. Or less accurate. It all comes down to leg power distribution.
Make sense?
With that ‘warning’ out of the way, let’s talk about some tests.
Oh, actually, one more item. There are many studies which people from both sides like to point to around pedaling balance. Some of these studies are 37 years old, and some are more recent (but actually just summaries of older studies). I don’t know whether or not these studies are ultimately a good representation of how the Stages unit would perform, my guess is ‘not quite’. Close, but not the same. Thus, I’d really prefer to simply see studies against the Stages Power unit, rather than guesses based on studies from four decades ago with different equipment.
From my perspective, I tested the output of the Stages PM against other ‘known’ PM’s. In this case, the Quarq Cinqo power meter, as well as the Wahoo KICKR, RacerMate CompuTrainer, and a CycleOps PowerTap. These tests were a variety of indoor and outdoor tests. All of these tests were done on the most recent firmware given – the same one that other media outlets are using. I actually have interesting data on other firmware versions, but with each beta iteration prior to them there were minor bugs impacting data transmission. The last firmware update over the past week has been fairly solid. Of course, things may change (for better or worse) down the road.
I used the same brand of head unit configured identically across all power meters. Further, to validate data, in most tests I also had a secondary head unit capturing data across one or more power meters during each test, just to be able to double-check against any head-unit specific issues that could have arisen. In some of those cases, I was dual-streaming data across both Bluetooth Smart and ANT+, hoping to further ferret out any data issues.
At some point along the way, one has to agree that the data ‘is what it is’. Like I said above, it’s just data from me. And comparing against other units. True, I don’t know for 100% certainty that the Stages or right or wrong in the below tests. But by the same token, when I’m testing against three additional properly calibrated power meters (such as on the indoor tests), at some point…the data is what it is.
Finally, unlike past power meter accuracy sections where I’ve compared numbers myself – this time I ‘outsourced’ it to the folks who more or less do this stuff for a living (they analyze numbers and instrumentation for work, power meters for fun). I’ve worked with Robert Chung (see also) and Thomas Anhalt to establish some of the tests, and more importantly – to do the majority of the analysis afterwards. I gathered data on three separate head units (often times 5-6 head units for redundancy), and then zipped it all up with clear explanations of what I was doing and sent it to them. They then helped me formulate the data behind what you see below.
I’m hugely grateful for their time in analyzing the files – as they are the pinnacle of folks in this particular field (like Yoda masters), and they really can dive into what all the numbers mean. Thanks again!
Note that on all tests, manual calibration was done on all power meters prior to start of ride (stopped and unclipped from bike), as well as between 2-3 times throughout, starting around 10-15 minutes in (typical warm-up).
Indoor Rides:
[Note: This section is impacted by the new software update. See updated review.]
First, let’s tackle the easy stuff – the indoor rides. Below is a relatively simple and straight forward power ramp test. What I did was start off with a 10-minute warm-up, where the last two minutes I did two quick 300w 30-second sprints. Then, I calibrated all the power meters and trainer (CompuTrainer). From there, starting at 150w I increased power at 10w per minute, up to 250w. Then I went back down in 25w increments to 150w, before doing two 400w sprints for 30s.

In looking at this data, it seems that the Stages power meter ‘pulses’ a bit as I increased each power level, or decreased it. Once it stabilizes, it stays pretty close until I change the power again. You can see this more clearly in the difference graph:

Things are relatively close at each ‘in between’ (+/- 10-20w), and then as I increase/decrease the steps on the one-minute, it impacts the accuracy and you see a spike(up to 40+ watts).
Here’s another test I did, this time on the LeMond Revolution Trainer. This is somewhat interesting in that the power isn’t hard-set by the trainer, but is instead dependent on my power output. This particular test was mostly trying out difference gearings and keeping the cadence relatively constant. Thus, the wattages got a bit lower as I got into the easier gears:

As you can see, as I worked my way down the rear cassette, the alignment between the Quarq and the LeMond were nearly spot-on. However, the Stages Power seemed to lag a bit and just like above, each time I shifted power levels you see a drop and then a bit of catch-up.
This was less prevalent at lower wattages as I shifted into the small ring in the front and worked my way up (easier) the rear cassette. The two became much closer. But at that point, the power was pretty small (80-100w), compared to before at nearly 300w.
Now interestingly, it actually tracked pretty well on the two quick sprints I did at the end – just over 500w on all power meters.
Let’s look at the difference chart, displaying the LeMond and Stages:

Again, as noted above you see things don’t track very well at the beginning, but do fairly well in the middle. And each time I ‘shift’ (either physical gear shift, or wattage shift), you see spikes in differences.
Now, what’s interesting here is that if you look at averages and maximums, it’s not too bad. But the same was true of the CycleOps PowerCal. Though, that was $99, not $699.

But, as you see above in the chart, it’s not all about the averages and maximums. Aspects such as those spikes make pacing and other power meter metrics more difficult to be consistent or accurate. It would be one thing if it was consistently offset, but, it’s a bit over the map.
What is generally clear though (and you’ll see this later) is that my right leg is clearly dominant, as in almost every case the power is lower on the Stage (due to the lesser left leg being doubled).
Outdoor Rides:
[Note: This section is impacted by the new software update. See updated review.]
Next, let’s dive into the outdoor rides. First, we have a ride comparing both the PowerTap and Stages power meter. There was a Quarq on board, but the data has been excluded from that due to an error about half-way through.
This ride started as about 20ish minutes getting to the park, then a number of loops around the park before returning across town. In general this means that the first and last 20 minutes tend to have more starts/stops, and thus more shifts in the power output. Whereas the middle section was more stable. That middle section also included a few hard sprints in there.

Here, let’s make that a little easier with some 5-minute smoothing (of course, this wipes out all the little differences that become so important):

Now here you see that once you smooth things out (a lot), they actually track somewhat similar. There are some oddities if you look closely. Places where one line jives and another doesn’t.
But, again, it’s important to look at the differences. Ideally, these would be constant – but they aren’t. Here’s what we see:

The challenge here being that once things stop being constant, you can’t really trust them. And we’re not talking a small amount – but rather shifts upwards of 40w.
Let’s look at another ride, this time to the other part of town.
In this case, a similar pattern of about 25 minutes getting to the loop area, and then I did four loops at a steady-state effort, followed by a ride home back across town. Here’s the 10-second smoothed version. Note that unlike the 10s smoothing above in ride #1, this is actually a bit easier to see/read when I’m in my steady-state efforts.

To make it easier though, I’ll go ahead and apply 5-minute smoothing:

We can see some clear trends here, and a few interesting oddities. For example, the Quarq seemed to read abnormally high for the first 10 minutes until I performed the standard calibration of all units, then things stablized out.
Now, as we look at the difference between the two on a five minute average, we see that the Stages was measuring around 20w lower on average than the Quarq, but that varied over the course of the ride, from 10w to 30w on average, but all the way up to 54w and down to –5w. It’s this constant change in the difference that’s problematic.

[Note: Following graph updated, incorrectly labeled graph was initially included, making the Stages PM look smoother against the PowerTap, that’s been corrected].
If I take this same graph against the PowerTap, it’s a bit messier – especially towards the second half. The relatively stable portion in the middle though is better – trending at about 8-12w during that phase.

Now, as you can see above – the difference being 8-12w apart isn’t actually too bad all things considered. There’s far less variation in the steady-state sections than against the Quarq.
And, per your request, I’ve added the plot between the Quarq and the PowerTap. Pay particular attention to the scale differences (vertical axis):

While you see variations across both the PowerTap and Quarq, they are substantially lower than those variations between the Stages and either of the other two power meters. Specifically, about 50% less variation than you see, in some cases on average just 5w difference – within the realm of accuracy of either unit. Of course, as I note later on, even despite a standardized calibration process across power meters, it’s still very difficult to get absolute perfection in data results.
Below is the difference in wattages between the different units:

Of course, I don’t know which unit is ultimately correct in this particular test. Here’s the quick overall total averages:

We do see that the total averages are relatively close (all things considered). With the offset between the Stages and the PowerTap being the same as the offset between the PowerTap and Quarq (in watts). This is similar to the trend I saw with the PowerCal, in that it was actually fairly solid when it came to averages. But averages don’t always tell the whole story. In fact, when it comes to pacing events such as time trials or triathlons, it’s keeping things smooth and steady that become important – minimizing spikes. The pulsing on the Stages unit makes it very difficult to quantify due to the quantity of them, and deciding which ones are real and which ones aren’t.
Now finally, one last item of note – which is the fluctuations of the power. When I was climbing in Colorado, the power stayed relatively stable, because the load was relatively stable (a hill). I just kept a constant cadence and a relatively constant heart rate, and things seemed in line.
But on more varied terrain, I see more fluctuations in power – even in 30-second smoothing mode. Typically I use 3-second and 30s smoothing on my power meter head unit to pace with. I use 3s as my ‘instant power’, and 30s to watch for trending. However, with the Stages Power unit, I’ve found that using 30s is still a bit shifty. Sorta like a 10s smoothed power. You see this often reflected in some of the graphs below – the constantly changing nature of things.
So what does this all mean?
Well, it’s tough.
At present, based on me (and only me) it would be difficult for me to swap out my existing power meter with the Stages power meter. There’s just too much variance and fluctuations in power. Do I think that Stages can get there though? Yes, I do. But I think it’s going to take time, and likely more software work. You start to potentially see the impacts of the cadence fluctuations likely impacting power accuracy – especially outdoors.
The challenge with the Stages Power system is that is ‘demos well’. Meaning, at first glance some of the overlay charts look pretty good. But it’s not until you start to dig into the data that things start to get a bit rough. Again, I think given time it may very well get better. But that doesn’t answer the question of how it varies person to person either.
And finally, note again, these are just my numbers – and only my numbers. For some people, it may be spot on, and for others – further off than me.
Power Meter Market Comparison Chart:
Here’s a comparison chart of units on the market today that I have reviewed or otherwise ridden. Note that I don’t include units that I haven’t used in there, since it seems silly to include ones that I can’t provide direct feedback on.
I do however (based on popular requests for other products) include units that are pending shortly, in those cases, I’ve put a TBA/TBD in the data fields as appropriate. Note that the below chart is updated dynamically in real-time from a database, with the most recent update listed at the bottom. If products are updated (such as a firmware release), you’ll see the table update.
Finally, you can click to expand the tableand get a whole lot more info (and competitive products). It’s just a page size limitation thing. All good? Good.
Again, remember you can expand the table to see more info, and then mix and match the power meters as you see fit. Or you can do the same over at the product comparison tool.
Product Availability (US/International):
At present you can already pre-order your Stages Power Meter, with units shipping out this week. When I was there earlier this month, they had a pretty substantial inventory of units already built and completed – just waiting for final firmware. Additionally, they were waiting on final tools to speed their build process significantly.
For the majority of the 2013 cycling season, they will only be selling within North America. The plan is to go to Europe and Asia next, but they don’t have a specific timeline beyond getting it done this calendar year (2013). From a certifications standpoint, they have done both US and European certifications (such as CEE) in concert. So it’s more of a support/logistics situation with going international than a technical one.
From a warranty standpoint the units include a 1-year warranty. They are also offering an extended plan for $105US-$135US depending on crank model, which includes any accidental damage/crash situations. They noted they’ll expedite shipments back to you to get your unit back quickly. The extended plan is available for up to 14 days after the unit is purchased, and will last two years in total. Inside the box there’s a card which you can then go online and enter in your SKU number. Once done you’re activated and good to go…crash?
Finally, units are available only through independent bicycle dealers (basically, your local bike shop – no online-only sales), with the exception of their own StagesCycling.com site. Additionally, there are coaching affiliate programs. These are where you place your order through your coach and they act as a initial order taker.
Summary:

[Note: This section is impacted by the new software update. See updated review.]
As I noted last week in the Power2Max review, the reality is that power meter selection is a highly religious thing for many. If you visit this post in a few days/weeks/months, – you’ll likely see that in the comments. Everyone who buys their power meter swears by it – and believes it can do no wrong. This is true whether they spend well over $2-3K for an SRM, or $700 for the Stages PM. There’s nothing wrong with believing your purchase was the correct one.
The challenge is that people from both extremes attempt to make product purchasing decisions about individuals other than themselves. The reality is that people purchase things at different price points for different reasons. Some will spend $2-3K for a power meter because it fits their use case perfectly, while others are fine with compromises by saving $1-2K. There are tradeoffs, and the fact is that some of those tradeoffs are accuracy, and some of those tradeoffs involve money. And some involve configuration options. It’s up to you to decide what’s most important…to you.
For me personally, I don’t believe the Stages Power unit would be a good fit. The accuracy shifting makes the data too hard to truly analyze without significantly watering down the data. In paced efforts (by a set wattage value), I saw difficulties in pacing against it compared to either the PowerTap or Quarq units due to more jumpiness than other units. [Edited to add] I do think however that for total average power, the units end up being relatively close. Yet at the same time, I found the same true of the PowerCal. In that case (and similar here), I found that you could get down to about 60-seconds (as a time splice) as far as averaging before things started to fall apart during shifting efforts. Further, when it comes to calibration I’d wager that 90-95% of power users today (in whole, not just people that read this blog) don’t correctly calibrate per recommendations. Thus, I’d argue that power accuracy on the whole is probably less relevant than some people think. Again, it doesn’t change what I noted above regarding stability and this unit, but it is worthwhile pointing out.
In some ways, this review only serves to point out just how difficult it is to get exactly matching data across power meters today – even well established brands under near-perfect testing conditions following every bit of guidance possible.
On cadence, I found that ‘good enough’ for my purposes – and I would think for most peoples efforts.
I will say however that this is without question the easiest power meter I’ve ever swapped back and forth (aside from a full wheelset). This morning I moved it between my bike and The Girl’s bike in about 3-4 minutes, including putting back the crank arm on each bike so that both bikes were functional.
Pros and Cons:
Here’s a quick table of the pros and cons of the Stages Power Meter.
Pros:
– Cheapest direct force power meter on market today (new)
– Easy to install. Silly easy.
– Tons of crank compatibility options
– Accelerometer based cadence measurement works really well
– Utilizes standard CR2032 user-replaceable battery
– Automatically compensates for temperature changes
– Lightweight – 20g
Cons:
– Power fluctuates significantly within a ride
– Power accuracy difference against other units shifts constantly over ride
– Left leg dependent, simply doubles left leg power
– Total power can be highly impacted by left/right distribution
– No method of end-user calibration validation (advanced users)
– Doesn’t support ROTOR cranks/arms as of today, or carbon crank arms
Thanks for reading! And as always, feel free to post comments or questions in the comments section below, I’ll be happy to try and answer them as quickly as possible. And lastly, if you felt this review was useful – I always appreciate feedback in the comments below. Thanks!
Finally, I’ve written up a ton of helpful guides around using most of the major fitness devices, which you may find useful in getting started with the devices. These guides are all listed in the ‘How-to’ section. Enjoy!
Updated 3:00AM EST 1/19/13: Added summary table in outdoor tests, thoughts on total power, additional cadence plot, information on accuracy across all PM’s. Added cadence difference chart showing comparison of indoor/outdoor. Continue to add data requests/tables/etc to review as I see them.
Updated 3:16AM 6/18/13: Noted sections where original review diverges from updated review. Closed comments on this review.