When you first get your new fangled Garmin Forerunner or Edge device you’ll probably be using the default data field views that show commonly used metrics like pace and distance. After all, these are some of the key benefits of a GPS watch – the ability to go anywhere you want and the little device will tell you exactly how far you’ve gone.
But…virtually all the Garmin’s offer a significantly expanded set of data fields that you can customize and tweak until you’re hearts content. In fact, you can have multiple ‘Data Pages’ (or ‘Data Screens’) that each have different data metrics on them. From there you can just use the simple up/down/page buttons to alternate through whole data pages easily while out on a run and a ride, allowing you easy access to different sets of information.
Of course, with all these options come choices – and confusion. So much so that I see or get multiple questions a week on exactly which data fields I use on a day to day basis. So I’m going to highlight the two devices I use the vast majority of the time, the Garmin 310XT and the Garmin Edge 500 to show off my customized data fields. I should note that from a functionality standpoint, the Forerunner 305 and 310XT have virtually all the same data fields, except the 310XT has additional power fields for use with a cycling power meter. The Garmin FR60 has almost the same screens for running as well, so that’s also applicable here. And the Edge 500 and Edge 705 share almost all the same fields as well. Some of the other models like the 605 and 201/301 have basically the same fields, but since I don’t have those devices, I can’t speak to them specifically.
Thus, even if you have one of the different Forerunner or Edge units, you’ll still be able to utilize this guide, as none of the fields I use on a day to day basis are unique to only the latest units.
The options:
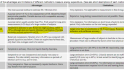
But, before we get into my specific configuration, I figured I’d type out all of the data fields available to you. Mentally I think I thought this would be a relatively short exercise. It turns out, it took a while to write them all down. Also note that I transcribed them exactly as shown on the data configuration screen.

(Note, it’s funny that on the 310XT there’s Total Ascent, but not Total Descent…which the Edge has)

And remember, the 310XT and the 305 share almost all the same data fields. And the Edge 500 and Edge 705 also share almost all the same data fields as well.
So with that out of the way, let’s talk about how I configure it…because…it’s all about me! :)
Garmin 305 & 310XT – On the Run:
For me, the 310XT is primarily my running watch, so I’m going to focus on that here. I divide it into a few different data screens (you can have up to four on the 310XT), plus the Virtual Partner feature, which I always leave enabled. I may not use it on any given run, but if I want to, it’s there nice and handy. You can read up on the Virtual Partner feature in my 310XT review if you’re not familiar with it.
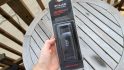
Primary Screen: For me, my main screen includes the only things I really need to look at on any given run. Since I train by heart rate, that’s a key item for me. Along with all the other ones that I’d consider critical – lap distance, pace and lap time. I use lap distance/time instead of total time/distance simply because I tend to do a lot of interval type workouts where I want to know exactly how far/long I’ve gone on that particular set.
Fields displayed recap: Current Pace, Lap Time, Lap Distance, Heart Rate

The second screen I use has my HR and cadence. Sometimes I’m doing cadence drills where I’m focusing on maintaining a specific cadence using the foot pod. So for those, this is useful.

The third screen I use (barely) has the time of day, and then the overall run time and run distance. This is useful if I need to know how far I’ve gone overall – outside of whatever exact lap item I’m doing.

And last but not least, the virtual partner screen. I can tweak the default target pace on the fly if I’m trying to maintain a different pace. So that’s handy and motivating to me.

As for how I configure the bike settings on the 310XT, it’s virtually identical to the Garmin Edge 500 below. The only exception is that since I don’t have 30s and 3s power averaging, I just use real-time power and lap power instead. But my key tenants on the bike are with the 310XT: HR, Speed, Cadence, Power. Distance and time on a secondary screen with lap & instant power.
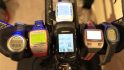
Garmin Edge 500 & 705 – On the Bike:
The main reason I use the Edge 500/705 over the 310XT for cycling is the extra data fields I can display. As for why I use the Edge 500 specifically instead of the Edge 705 (even though I have both) is that I really really really love the new mount system on the Edge 500. This means I can basically swap the 310XT and the Edge 500 back and forth on the same bike in about 20 seconds using the same mount (assuming you’ve got the 310XT quick release kit). So in a pinch if I forget to charge my battery or something, I can easily just do a quick swap.
Primary Screen: For me, on the Edge 500, I pretty much never have to change the screen on a normal ride. So I treat my primary screen as my only screen. This means it has everything I could ever need, plus a bit more I don’t really need. I have the core items: Speed, Cadence, HR, Distance, Time. Plus the power specific fields – which are 3s, 30s power display (averaged). I don’t use real-time instant power because it jumps around far too much for my liking. By using the 3s average I get a good idea of what I’m putting out, and the 30s average keeps me honest. Between those two I can pace pretty well with power. And finally I include grade %, because I find that pretty useful in understanding false flats – whether that be slowly rising or slowly descending.
Recap of data fields: Current Lap Time, Speed, Distance, Power 30s, Power 3s, Grade %, Heart Rate, Cadence

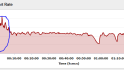
Secondary Screen: The only other screen I sometimes use is one aimed at ‘historical’ information. Sorta a ‘what are things looking like for this ride’ type of screen. It includes a fair bit of overall ride and last lap averages to get a good picture of how the ride is going at the macro-view level. Below you can see an example of that at the end of Sunday’s ride.
Recap of data fields: Avg Speed (Whole Ride), Avg Lap Speed, Total Distance, Lap Power, Avg Power (Whole Ride), Max Power (Whole Ride), Average Cadence (Whole Ride), Average Heart Rate (Whole Ride)

Third Screen: Ok, I forgot about this screen. This is one I’ve used just a handful of times on a trainer when I’m just focusing on keeping an exact power level. This makes it simple with just minimal data fields – Power 3s, HR, Time Cadence. This is for those sessions where you’re just heads down hurting spinning away, counting down the seconds until the set ends.
Data Field Recap: Power 3s Avg, Heart Rate, Current Lap Time, Cadence

So, that’s what I use on a day to day basis with my Garmin flotilla. If you found this particular post useful, you’ll probably find many of my other Garmin ‘How To’ type posts useful, which I stash away all in one nice tidy pile here. There’s about 50 of these type of posts, either triathlon, technology or running ‘How/What/Why’ type posts.
Hope you’re week is going well, and thanks for reading!
FOUND THIS POST USEFUL? SUPPORT THE SITE!
Hopefully, you found this post useful. The website is really a labor of love, so please consider becoming a DC RAINMAKER Supporter. This gets you an ad-free experience, and access to our (mostly) bi-monthly behind-the-scenes video series of “Shed Talkin’”.
Support DCRainMaker - Shop on Amazon
Otherwise, perhaps consider using the below link if shopping on Amazon. As an Amazon Associate, I earn from qualifying purchases. It doesn’t cost you anything extra, but your purchases help support this website a lot. It could simply be buying toilet paper, or this pizza oven we use and love.