
For years, aerodynamic sensors and testing facilities for cycling have been appropriated to not just the pointy end of the pack, but the absolute tip of that pointy end. The cost for a mere hour of wind tunnel time is as much as a power meter, and that excludes the travel costs required to get to but a handful of centers around the world – or that they recommend two hours of time. Even in the most time-optimized test setup, iterations in a wind tunnel take lots of time.
Born out of those limitations (among others), we saw new facilities like the ERO Sports one (and others driven by Alphamantis Technologies, which Garmin recently acquired). This service leveraged velodromes, which had an advantage of putting a cyclist on a moving bike, versus just a static wind tunnel. The last option on the table was using a bit of software and careful data collection in set procedures. This method being called Virtual Elevation (also called the Chung method, after its creator – Robert Chung). Virtual Elevation has other uses beyond just aerodynamics, such as looking at power meter accuracy too. But the vast majority of the iron-distance field would find it too complex to approach.
And one of the biggest challenges of all of these solutions is the inability to move it to race day or training days. They were largely for one-off testing days, or something you’d analyze from a desk at home.
And that’s where AeroLab aims to fill that gap. They’ve got a device that gives you real-time information out on the bike during your ride. Mind you, AeroLab is hardly the only company we’ll see put forth products and services in 2018 in this category. I talked about this a bit within my Symposium Keynote this past fall. There’s also Notio (which I’ve tried briefly too), as well as Swiss Side, and Red is Faster. Then whatever Garmin is doing with their acquisition of Alphamantis, and finally, the others that haven’t made themselves public yet. And all of these companies seem to have their sights on 2018 product introductions. Oh, and to be totally complete here – we saw the Velocomp Newton do real-time CDA back years ago, though the head unit didn’t really compete with others on the market.
A Look At The Tech:

Ironically enough, it was on my way to the ANT+ Symposium this past fall to give that very keynote that I got a chance to test ride the AeroLab system. I carefully followed Google Maps in my rental car to what was literally described to me via text message as the middle of nowhere. And it was. I had successfully navigated to a locked gate on a cattle farm, aside a perfectly straight road.
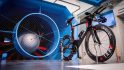
A few minutes later the guys from Energy Lab Sports showed up, and escorted me a bit further to our starting location for the day. It was here they had a bike waiting for me, with a power meter already affixed. Also already affixed was their aerodynamic sensor and a funky looking bike computer of sorts.

In reality, it was more of a beta testing display device. Like most of these companies, they intend to let you leverage your existing bike computer, largely through the use of Garmin Connect IQ or other arrangements with head unit makers. The company has joined others in trying to establish an ANT+ technical working group to standardize some of the data streams here, so that all head unit and aerodynamic sensors can work from the same sheet of music (like it is today for things like heart rate sensors or power meters).

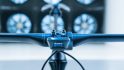
It’s that pointy looking aerodynamic sensor though where the majority of the magic is. The pointy thing is a multi-hole pitot probe. That’s what’s capturing wind speed and direction. Inside the larger housing is a host of hardware designed to capture and display the following metrics:
A) Wind Speed
B) Wind Angle
C) Wind Gust Magnitude
D) Coefficient of Aerodynamic Drag (CdA)
E) Coefficient of Rolling Resistance (Crr)
F) Humidity
G) Air density
Atop those metrics that are more ‘capture-based’, they’ve added another pile of metrics that are more calculation based, which are noted below.
H) Current power to overcome drag
I) Current power to overcome the road slope
J) Current power of acceleration
K) Current power to overcome rolling resistance
L) Estimated drivetrain power loses
The entire suite also contains an accelerometer, gyroscope, temperature sensor, humidity sensor, and barometric altimeter. It also supports connecting to ANT+ sensors too. All of this data is recorded at a rate of 2Hz, 5Hz, or a 10Hz (user selectable). That means it’s captured at 2, 5, and 10 times a second.

Without going too far into the weeds, the data in this prototype was recorded onto a MicroSD card, but by time production hits it’ll be wirelessly transferred to a planned online platform. The data is written as a CSV file, which they say they’ll have guidance for importing into Excel, MATLAB, and Golden Cheetah. Below is a sample from the data file with the headers removed:

The battery life of the platform is quite reasonable. At a 2Hz data storage rate, you’re looking at about 25 hours. Whereas at a 10Hz data rate, you’re looking at about 5 hours. So more than your bike computer would last in the lesser recording mode, but about what the more competitive iron-distance athletes would need in the highest recording rate to finish an Ironman (possibly a tiny bit short). But again, most training/racing circumstances wouldn’t really require the highest recording rates.
When it comes to setup, it’s desirable to use either an ANT+ or Bluetooth Smart wheel speed sensor for the most accurate recording, though the platform can fall back on GPS for ground speed measurement.
Finally, note that the company intends to offer two different variants of their product. One is a consumer version and one is a coaching version. The consumer one aims to have core measurements like real-time CdA, wind, and wind yaw. As well as the ability to run your specific bike/person setup through a course simulator. Whereas the coaching one would add in features like body position sensors and potentially those measuring sweat rate.
A Test Ride and Data:

The single biggest reason a product like AeroLab exists is because when you go and test in a wind tunnel or other aero facility, you quickly realize that slightly more aerodynamic body position changes are in many cases the difference between having your finger a mere centimeter in one direction or another (or possibly even less drastic than that). The challenge then becomes how to memorize that position after just a few minutes in, say, February, and transfer that all the way to your ‘A’ race in August.
With a road-capable system that you can use day in and day out, you can figure out that ideal position and adjust accordingly.
The first step in doing a ride with the unit is getting the sensor mounted to the bike, which is done using a fairly universal GoPro mount adapter. The extra Christmas lights wiring won’t be there on final production units of course, it’s a prototype. The final variants will be wireless. Also, the Cervelo markings were mostly due to some early interest there from Cervelo.

After which, you’ll do a short calibration procedure leaving the bike in a level spot sheltered from the wind for about 30 seconds. Upon completion, you’re ready to roll.
In my case, we would do two 10KM loops around a perfectly square set of farm roads on the outskirts of Calgary. Here you can see the Strava file:

Don’t worry though, you don’t need to ride in squares. It just helped to validate some aspects of the test data set from them.
In my test, we had a team car accompanying us (primarily to walk me through a series of ‘interesting’ tests, but also to take some photos with my camera). Additionally, the team car acted as a safety car so that we could so some of the intersections without braking, since that would impact the aerodynamic results, as it wouldn’t account for braking and would have assumed my aero position went all upside-down.


For the majority of the first loop, I just got used to riding with the display of the system. In particular, using some slightly different metrics. Sure, I was familiar with CdA and Crr and the display of that value – but there were other metrics to evaluate here including Paer – which is the power to overcome my aerodynamic drag. The goal here being to keep this number as low as possible. If I were to sit up, that power would increase, since it would now take more power to overcome that aerodynamic drag.

In addition to the power to overcome aerodynamic drag, they’re also looking at aspects like the power to overcome road slope, and power to overcome rolling resistance. With the general principals the same there.
You’ll notice above the balance metric (top one) on the Garmin looks a bit funny. Usually this would be split something like 48%-52%. But in this case, what’s actually happening is that their system is re-broadcasting as a power meter. So in reality, they connect directly to your ANT+ power meter, and you can connect to it as a power meter. From there they ‘took over’ the balance field to show CdA. Of course, the plan by production is just to make that a Connect IQ data field. But this is basically akin to what we’ve seen companies like Stryd do pre-CIQ.
Here’s a look at some of these numbers for my first loop (solo):

As you can see in the charts above, my CdA for much of this loop was about .30-.40.

In some cases it climbed a bit, likely in places where I briefly got out of aero or otherwise changed position (such as up some small climbs). Note that this was a loaned bike that I had no specialty fit for, nor was I wearing particularly aero clothing. The purpose of this ride wasn’t to find my perfect aerodynamic position – rather, it was just to show how the tech worked.

One can start to overlay these different metrics together to see where the inputs and outputs of the entire system fit together. This is my first loop, which again, was solo (thus, no draft effect).

On the second loop we started playing with the impacts of drafting on the sensors. To assist with this, another rider, Robert, was riding either in front or behind me.

We alternated positions throughout the second 10KM loop, and I was able to see the impact on things. During the first portion of this loop where I trailed Robert, my CdA skyrockets.

This is because there’s very little direct wind hitting the sensor, thus the wind sensor is no longer measuring my true wind speed, but rather the perceived wind speed.
You can see this shift again when I pass Robert. At that point his CdA spikes, and mine normalizes:

However, it gets slightly more interesting as we both slow down to climb a short hill towards the end of the loop. It’s at that point that you can see that the draft impact is lessened, since the overall wind speed is lessened.

To put things into a bit of audio-visual context, the AeroLab crew showed me this brief animated graph as part of a larger slide deck. They explain over the course of 90 seconds what’s going on with real-time CdA at different points during the ride. The video recording is super basic, so I’m just uploading it as-is for those that are curious.
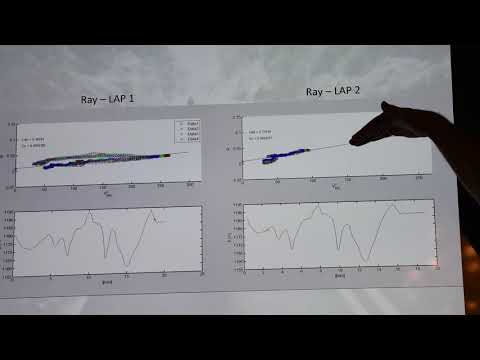
Of course, all of this is very basic in terms of what I highlighted above. And more importantly, to some degree it’s not 100% verifiable. However, a lot can be backed up by cross-referencing it against other methods, like the Chung method. The company did that for my ride (specifically Lap 1, which was ‘clean’ and free from all the draft testing we did on Lap 2), and was able to note some of the challenges that non-real-time methods face around assumptions. With AeroLab, it’s able to eliminate assumptions through its larger slate of sensors. Versus software-only options lacking those sensors have to make educated guesses.
Which isn’t to say that those guesses are bad, but they just aren’t as accurate as measured values. One is free, one might be upwards of $1,000. Both have value.
Also, it should be noted that the AeroLab system isn’t perfect either. For example, there are some minor increases in CdA towards the end of the loop that can’t fully be explained. Perhaps it’s the terrain (a climb), combined with other environmental factors, or perhaps it’s passing cars impacting the wind around us. All of which are areas that will no doubt need more detailing for not just AeroLab but other platforms as on-bike aerodynamic sensors become more widespread.
(Note: AeroLab did provide me a full and detailed whitepaper of the session with boatloads of data and extensive explanations of what was going on during each part. They’re going to make that public in the next 3-4 weeks, so once they do I’ll link to it here.)
Going Forward:

All of the companies mentioned at the start of this post are vying for the first to market title, but the long-term winner will be the one who can put together an affordably accurate system that’s easy to use and unscrewupable. It may sound silly, but one of the biggest challenges of aerodynamic testing today is the complexities to get the system setup and producing accurate numbers. AeroLab has done a fair bit there to try and address that within their prototypes, though, I suspect there’s still a bit more work to be done.
The main challenge that AeroLab will face is how to better integrate with head units. Most consumers of the platform would likely prefer to use their own head unit. The company acknowledges that and notes that they won’t require using their display, which is good news. It’s effectively the same challenge that ProShift faced, and to a lesser extent what Velocomp faced with Newton. And we see Notio with their system is focusing on as well, by just delivering the data via Garmin Connect IQ data fields, so users can get the data fields they want without the display they don’t.
The good news is shifting that data display is relatively trivial in the grand scheme of things – since they’ve demo’d it already with an Edge 520 for certain fields. Hopefully that’ll be the final direction going forward – if so, I think they’ll have a plethora of suitors, assuming the price is right.
Speaking of which, that is the final outstanding question – what will the price be? None of the companies have listed final prices, though competitor Notio noted they intend to offer roughly three levels, with prices spanning likely in the $500-$800 range for the mid-tier offering that includes real-time CDA and some level of aero guidance. AeroLab says that they’ll be “well under $1,000” for a consumer version, and about $1,800 for a coaching variant.
As for AeroLab, the company notes that they expect to start their beta program in the next few months. Though they say you can sign-up for it now, should you want to put your name in the hat for getting their aerodynamically beta bits.
With that, thanks for reading!
FOUND THIS POST USEFUL? SUPPORT THE SITE!
Hopefully, you found this post useful. The website is really a labor of love, so please consider becoming a DC RAINMAKER Supporter. This gets you an ad-free experience, and access to our (mostly) bi-monthly behind-the-scenes video series of “Shed Talkin’”.
Support DCRainMaker - Shop on Amazon
Otherwise, perhaps consider using the below link if shopping on Amazon. As an Amazon Associate, I earn from qualifying purchases. It doesn’t cost you anything extra, but your purchases help support this website a lot. It could simply be buying toilet paper, or this pizza oven we use and love.


wow
I guess you should have disclosed more about the comparison between Newton+ / Powerpod and Aerolab product. I mean how and why Aerolab can be more (or less accurate ) than the sensors of the former ones.
Newton/PowerPod are hardware products, that sentence specifically refers to the limitations of non-hardware approaches to calculate metrics after the fact.
My issue with Newton+ is that it’s a horrible cycling head unit. My concerns there have little to do with aerodynamics, since I haven’t focused on it’s aerodynamic aspects too much. If PowerPod ever gets around to releasing a Connect IQ app for it, I think that’d be incredibly compelling as a starting point (at which point, accuracy debates can then ensue around real-time CdA).
One problem with the PowerPod is that it can’t measure wind direction. This apparently can.
Indeed, we measure wind magnitude and wind direction using a 3-hole probe off the front of the device. As well, we are computing Crr in real time (no assumed constant value).
To my understanding a 3-hole probe is only able to measure wind coming from the front, with angles of maximum +-25°. Is that right?
Correct. Beyond somewhere around 20-30 degrees (depends on pitot tube design), local flow separation off the pitot tube alters the readings. Some non-linear compensation can also be done to try and stretch the calibration further. I have played around with this over the last couple years using a 5 hole-probe, and comparing the field-based measurements obtained with a 3-hole probe. In situations where aerodynamics is critical, you very rarely see wind angles beyond 20 degrees, and when you do, you should focus on bike stability rather than aerodynamics!
Great differentiating features.
Unlike AeroPod, measuring the aerodynamic force as a vector enables AeroLab to calculate the wind relative to the ground (assuming that heading is also known). The ability to record, upload and share wind speed and wind direction may find future applications that resonate with a larger audience.
Real time data is great for instant feedback, but by analyzing an entire bike ride, Crr could be computed from discrete data samples where specific conditions are met (for example all instances where power is high but acceleration, air drag and hill slope are small). Because the congruence of such conditions is rare, it is less likely to occur in a continuous sequence that is long enough for given accuracy.
Hi Ray, Thanks for the info on this.
It seems like there is quite a learning curve to interpreting and using the data, even post ride, I will be very interested in seeing their approach to educating their potential market (beyond coaching).
Is the size of the displayed hardware close to its final form factor? (will it get smaller?) and do they have an estimated ballpark figure of hoped-for final weight of the unit?
Being a cyclist with tech interestests is fantastic at the moment, we are experiencing so many evolutions and integrations, very happy.
My understanding is the size of the pitot portion is as expected, however, all the rest of the stuffs (display/etc) would go away in a non-display setup.
I’ll see if they’ve got an estimated weight (or perhaps they’ll respond here).
Thanks for your questions
– The form factor will most certainly be changing for the Beta users from what you see here (likely ~30-50% reduction in size). That in mind, it is tough to guess at the final weight of the sensor system.
– Ray is correct, the pitot portion is likely not going to change too much. We have been doing wind tunnel testing on each iteration of the design.
thank you both for replying, looking forward to seeing trying out your product.
Hi Ray,
Will Garmin integrate those data fields into their devices also? Like the way they integrated Di2.
I mean that way, users would need only 1 display unit and pull the required information there…
Yes and no.
For Connect IQ data fields, those are by default Garmin-specific. So any user of any Connect IQ device (basically and device made in the last 3 years over $150). That’s an ideal interium scenario.
Then the second piece is having the ANT+ TWG for aerodynamic stuffs come up with standardized data sets. So in the same way there are standardized fields for ANT+ Gear Shifting (which SRAM, Campagnolo and FSA leverage), it’d be the same thing for aero fields.
But I don’t know if that specific TWG is formal yet or not. Typically there’s a call for members to join, and I don’t remember seeing that in a newsletter. Of course, once a TWG is established the timeframe to fruition can be incredibly quick (a few months) or incredibly slow (years). Really just depends on the players involved.
“If I were to sit up, that power would increase, since it would now take more power to overcome that aerodynamic drag.” Or the number would remain the same and you would slow down. But, yeah, there’s a finite amount of power that has to overcome various losses, and air resistance is one of the big ones that you can do something (a little, at least) about by staying low. It’s fascinating how they’re going to split the various losses apart so you can actually see them in real time.
We are glad you like this concept. From a cyclist perspective, power in Watts is a well-understood quantity. That knowledge took time to be absorbed by the cycling community. It is important to leverage that for what its worth. CdA is going to be a learning process for the cycling community, but Aerodynamic Power (and other power terms) will be quicker and easier to physically understand from the start.
Fuuutuuure!
Thanks for finally getting this up Ray.
Any odds on the next Garmin 10XX device having a pitot tube sticking out of it? :)
I’d be an early adopter of a gopro mount style pitot tube that broadcasts ANT+ CDA in the 500$ USD market. Ideally natively supported via a firmware update to my 820. Though I could live with CIQ.
I think that’s essentially what Notio is looking at, at least on the lower end of the pricing range. What’s a bit fuzzy is the exact data streams they’ll send at that price point (versus perhaps a tiny bit higher).
I wouldn’t expect any near-term device from Garmin to be inclusive of a pitot tube. But, I expect long term they’ll essentially do what Velocomp/iBike did, just with more success since they have a highly adopted head unit.
I assume CdA is drag coeff x Area – which would make sense since the area is unknown and variable depending on your position. So it’s 2 x drag force (presumably estimated from power less acceleration less rolling drag less climb power) over density x airspeed squared, all data that can come from the air probe and power meter. Now for Crr – do they estimate it based on accelerometer measurement of vibrations? And do you enter an overall weight somewhere so they can back out the power-acceleration part?
Thanks for your comment and question. You are right, if Crr is known, you *simply* re-arrange the equation to solve for CdA. How we solve for CdA and Crr simultaneously is tricky since you have one equation and two unknowns. One method is called Virtual Elevation (VE) or the Chung method, and another is regression based. Both have their merits, and we have been using both.
I developed a system for “live CDA aero testing” in a velodrome like the system of Alphamantis. The equation of motion is “solved” by chi² fitting a global model (also based on Martin et al. J. Appl. Biomech. 1998 14 176-291) to the experimental data. However, I was not yet able to solve reliably for CdA and Crr simultaneously. The dependency on Crr is so much weaker than on CdA that the solver does not converge in most cases. In addition there is the problem of “noise everywhere“ which I suppose is even more severe outside in the field than in a velodrome. To overcome the noise problem what other possibilities one have besides averaging, thus giving up somehow the mantra of “live” measurement?
Well, you are certainly correct Berg. It is incredibly difficult to do on the road where everything is changing when compared to a controlled test in something like a velo (where it is also very difficult!). For power measurements, most find that something between a 10 sec and 30 second average provides the ideal user experience. With that in mind, we are indeed using averaging in order to substantially reduce effects of random noise in each of the sensor measurements. The leftover, would be any unmodeled sources of error plus sources of bias error in the measurements themselves, which we are addressing through several articles. The first of which is posted on our site here: link to aerolab.tech
Thanks for the clarifications. Is there a rider + bike weight input as well?
Read the AeroLab posts on their web site, and all is clear now – they even include sensivity analysis vs weight and Crr errors.
Great! Yep, I have an explicit definition of rider weight in the first blog post. it is critical to the calculation of CdA.
Ray, very cool review! The photo of their head unit and Garmin above is on a road bike. Was that a stock photo they provided or did you spend some time on another bike?
They shot that photo, since we didn’t want to disturb the test ride with me taking a bunch of photos.
Clearly there is something wrong with their calculations: when you trail somebody your CdA spikes up ?! CdA is a coefficient, so it should remain constant if your position doesn’t change. What you should have seen is your CdA remaining constant but your power going down.
For the Crr they probably measured it before your ride or they are using a chart because CdA, Crr, gravity and friction loss (drivetrain) are coming as a package deal. The power that you produce is what you need to overcome that package deal. With a GPS you know what you need to beat gravity and on a good bike we can say that friction loss is minimal. So if you want to estimate CdA or Crr, you have to know or estimate one of them.
It would have bee more interesting to see the CdA of the other rider vs yours and difference between gears like helmets, bikes and clothes. That would be the point to buy a 10XXX$ gadget, not to see a miscalculation in CdA…
Eddie, sorry, but you may have some misconceptions about how the calculation is working. Once you are drafting in a three-dimensional time-varying flow field, all assumptions about constant CdA go out the window!
First, several experimental studies have shown that CdA is in fact a function of Reynolds number for a lot of bluff and quasi-streamlined bodies. Tests with riders stationary in a wind tunnel show variances in CdA on the order of 30% simply by changing the wind tunnel velocity. See for example, “Aerodynamic Drag in Cycling: Methods of Assessment” by Pierre DeBraux et al. 2011.
Now, onto the more subtle issue. When you are drafting a rider, the wind velocity you experience is constantly fluctuating (often quite wildly). Even in an average sense, it will be HIGHLY three-dimensional. (e.g., your bike frame may see a wind velocity of 10kph, while your head sees 40kph depending on your draft position). So what value of velocity do you use for computing CdA? In the case of an aerodynamic sensor, we only have one reference point of velocity that is enclosed in the sensor system, and this is mounted on the bike frame.
Hence, when you are drafting, in all likelihood, the wind you measure with the sensor will be substantially lower than the wind experienced by the remainder of your body. The result is that your estimated CdA goes up.
In a perfect world, we would measure the entire three-dimensional flow field behind the rider, then compute the mean velocity experienced by the frontal area of the rider, and then use that mean velocity to estimate CdA. Even in this case, CdA will likely not remain constant.
Thank you for the feedback, really interesting and I will read DeBraux for sure.
Checks Strava segments. Still has faster times than aero DC Rainmaker. Phew!
Correction from my 2.5 year-old son: you rode in a rectangle, not a square.
Pretty advanced. He’ll probably know about geodes and coordinate projections by 5 ;-)
Are Energy Lab wheels and Aero Lab affiliated with each other then? The logo looks similar and I noticed their wheels in one of the shots
Hi Colin,
AeroLab would not exist without the partnership with EnergyLab Sports. When I met the CEO of EnergyLab, I was a lone wolf with a data logging prototype about 2x the size that you see in the photos in this article. Since then (been 3+yrs), we have patents in play, a more sophisticated network of collaborators, and a functional real-time system.
They are connected at the hip. AeroLab is a spineoff company when consumer interest started. We have kept AeroLab low key because of patent filings.
Oh yeah, great to read. And very interesting informations about this specific optimization.
Hope to see more of this sort of tests here. ;)
Thx for your hard work!
I think this is the very first published real-time CdA and Crr data…seems like the competition might be scrambling. Kudos to AeroLab for sticking their neck out confidently.
Thanks, we struggled on when to release. One of the factors was the patent filing process and we got the green light from the lawyers in early December.
My favorite book as Cycling Physics 101: link to mitpress.mit.edu
Same for me. I used it for my final project in MechEng way back when.
How (or could you?) use this to compare say two sets of wheels, or two different aero helmets, on the same setup given many other inputs that are in constant change with respect to even two ‘test’ rides done on the same course / same day? Ie would it even be able to tell the difference through all the other random noise/variation of input data (how accurate can it be)?
Hi Jim,
Good question. If the differences in aerodynamic drag are less than a few grams at 40 km/hr, this is starting to reach the limit of any measurement system (wind tunnel or otherwise). Now in terms of things constantly changing, I am not sure if you mean body position changes or simply environmental (wind etc.). If your goal is to test two sets of wheels for example, then you most certainly should keep all variables fixed (same gear except the wheels, and use the same body position, ideally on the same course – though this is not necessary). Then let the AeroLab sensor do its work. It will track all environmental variables throughout the ride along with your aerodynamic performance. Post-ride, it also completes all the analysis and will inform you of the results.
You can imagine that the wind speeds and wind angles experienced might be different between your two tests. This will enable something like a windrose to be generated with CdA associated to wind angle (this is really important for wheels as their optimum aerodynamic performance is often tuned to specific wind angle ranges – it may be less important for certain helmets). AeroLab computes an overall performance value using some fancy wind-averaged drag techniques and provides you (the rider) with the overall CdA and performance of each wheel setup. Note that the overall CdA used in the comparison is only computed based on the available data which overlaps between the two test cases (if you have some CdA measured for a wind yaw of 14 degrees in one setup, but do not have that data in the other setup, then you cannot include this wind yaw in your comparisons of the performance).
Now, let’s say you have a race coming up and you found both wheel sets to be good (i.e., previous testing showed the CdA difference to be small), but you are not sure which one will be better since winds are expected to be strong that day. Run the AeroLab course simulator, input the expected wind speed and direction and it will use your collected windrose of CdA data for each setup to determine which wheelset will perform better.
I may have forgotten to answer part of your question:
Can you see the CdA difference immediately in real-time? Well, as you said, everything is constantly changing, so unless it is a relatively large CdA difference (say >5%), you will likely not be able to tell until the ride is finished and the above-described analysis is completed.
Wind tunnels measurements see variation over the time of a test as well. It is an inevitable feature of the non-linear behavior of wind over a body.
Amazing read! thx for taking the time to put this in depth review together.
Can you tell us more about what we might expect or the plans for integrating this with existing display systems?
and what kind of live data we might be able to display?
I imagine a large portion of the data will be post ride as discussed however will there be immediate Cda, Crr (and more)?? results visible i.e. with the change of helmets and or position, etc. of such that can be adjusted / overcome while riding?
Hi Ryan,
We are definitely slaves to the current head unit market (it would be silly for us to even attempt to make a competitive head unit at this stage since the market is dominated by the likes of garmin, Wahoo, stages, SRM, Sigma, etc.
At the present moment, there is no defined ANT+ device profile for sending data and displaying it on any head unit. This is why the Garmin ConnectIQ route is a good option while we wait for Dynastream to finalize with device profile and make it available for all head units that adopt the profile.
Currently, we believe the profile will involve sending CdA, Crr, wind, and wind yaw. So all the added features you see in this article (power to overcome drag, power to overcome road slope, etc.) would continue as a ConnectIQ feature, We will push for as much of these features as possible to be adopted via ANT+.
Indeed, when you change position, you will see nearly immediate (20 sec delay or so) change in your CdA and aerodynamic power. If the change you made is miniscule, say CdA from 0.255 to 0.250, this will be more difficult to discern in real-time as the variations in CdA over a ride will be on that order of magnitude or higher.
It would be interesting to see this with some integration with Best Bike Splits.
Indeed, integration of the true environmental data collected on a ride would be substantially better than measurements from a local 10 meter or 30 meter MET tower that is unobstructed from the local terrain. It would also enable more accurate CdA and Crr information to be inputted. I build the AeroLab course simulator for this purpose – to actually use the data you collected from your previous rides.
Ray, this is definitely what speed junkies have been looking for in the tri and TT world. It looks to bring up the value of having a good power meter over a low price point. But, GPS is traditionally poor on slope accuracy, adding slow moving the data can poor.
Did you experience GPS data floating around? Also, are they taking into consideration different power meters and will that change the accuracy of the CdA and Crr?
Ironman Kona, Here I come! ;) Finding free watts while I train.
Hi Todd, I will jump in here to quickly explain a couple key items:
1) There are a few options available for completing a sensor-based estimate of the road slope. One can use GPS, barometer, accelerometer/gyro, a custom inclinometer, or sensor fusion. Early prototype units had all of these sensors within for the purposes of comparing each methodology of slope estimation. The method we are currently using for slope estimation is proprietary and vastly superior to GPS.
2) Indeed, there is a power meter quality issue that needs to be addressed. I am currently writing up an article looking at this in detail. Stay tuned…
Should I be saying congrats on the KQ? Or are you still gunning for that elusive slot?
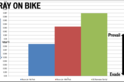
Thanks for writing this article. Aerodynamic sensors I think will become a must have for triathletes who are serious as it is more important than say SRAM Red over SRAM Force in terms of the difference it can make. e
I have a few questions about your experience and the unit:
1. Did you experience any crosswind during your ride? If you made a square I would imagine you got wind from 4 different directions by doing a square loop. I can’t tell from the data what affect that had on your cda numbers from your graphs. Do you have any insight on this? More broadly, how does crosswind affect cda numbers?
2. This is probably a silly question and one that might be reduced in importance as I read Chris’s comment that they plan on reducing the size of the unit by 30-50%, but what affect does the unit itself have on cda numbers? On the topic of the aerolab unit, I use a Profile Design FC35 BTA hydration, does this aerolab unit sit right in front of the fork and thus where a Torhans, PD, etc. water bottle that sticks down would be?
Thanks!
1) There was a 5KPH wind that day, so pretty tame actually. In the PDF they’re going to release (which covers my test), they dive into this a little bit. But, I’m sure Chris can outline some initial thoughts prior to that.
2) I’d have to defer to them if they’ve done any testing on it. Certainly, down the road when there’s more than one, it’d be fun to take a collection of these devices into a wind tunnel and see what the impact is exactly. :)
Hi Graham,
I totally agree with you on the value of the aerodynamic sensor. Its one thing to train year-round and try to gain 10 [W] or 15 [W] on your FTP, and then find out that some adjustments to your equipment/body position provide equivalent advantages!
1) Indeed, the winds were quite weak on Ray’s test day. Wind yaw experienced was less than plus or minus 2 degrees for the entire ride (on a 30 sec averaging window). The PDF report will show a direct overlay comparison of the wind yaw experienced by Ray as well as a second rider, Rob, who was riding the same course at the same time. Given that the yaw experienced was so low, CdA variances with yaw are not really observed. I have some test data from a different day which shows the effect of Yaw on CdA much more clearly. Wind tunnel measurements have shown that CdA is indeed a function of Yaw. In order to validate the yaw effect and the quality of the sensor to pick up the associated CdA changes, we are conducting additional full scale wind tunnel tests with the sensor mounted to the bike+rider and comparing these with our current road test results. Expect an article to come out on this around March/2018.
2. The full scale wind tunnel tests discussed above are also being used to quantify the effect of the sensor on CdA (wind tunnel measurement with/without sensor on the bike). We have a good idea of our beta unit shape and size and hope for this to be used in the tunnel test. If the shape of the beta unit is still not finalized, we will push the wind tunnel testing for this particular feature to a later date. I will try and come up with some ball-park numbers in the meantime, and post here when I have them.
Thanks for the great info Chris. You guys have a very exciting potential product.
I hope this will be a ground-braking product. Potential applications are endless. One day, cyclists will be able to save their wind speed in a FIT file and share it through online services like Strava. Air distance may become as ubiquitous as elevation gain.
A few years ago I tried to measure my air drag using essentially the same principles, but my wind sensor was a PowerPod, which does not measure wind yaw. So I tried to estimate a “virtual wind yaw” by comparing the prevailing wind direction with my GPS heading. Prevailing wind direction is defined for the whole ride and estimated by “riding in squares” (indeed rectangles to be accurate), and comparing PowerPod-wind-speed with GPS heading.
My research was published in the Journal of Science and Cycling Vol. 4(1), which can also be downloaded from link to europub.co.uk. I would be very curious to know if your wind tunnel testing (or field testing) confirms the yaw effect shown in Figure 12 of that article.