And by now…I mean like 5 months ago. But no matter, I’m finally getting around to telling you about it in some manner that might be noticeable. Or even semi-formal.
But wait – what’s the DCR Analyzer?
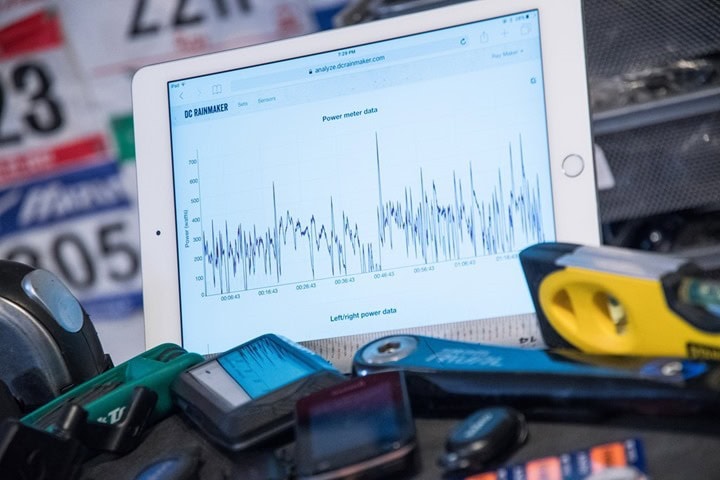
You know in my in-depth reviews (you do read those, right?) where I’ve got all these fancy charts that compare one power meter to another (or 4 others)? Or one heart rate strap to another or three? Or possibly one GPS track to 7 others? Well, that’s the DCR Analyzer.
It’s a purpose built tool that I’ve been using for almost two years now, designed specifically for comparing two theoretically like things. So how does one power meter track against another on the same ride. Or how does one optical HR sensor compare to a heart rate strap. That’s the goal.
It originated from my frustration with spending 15-45 minutes per ride/run/activity trying to normalize and compare the data using off the shelf tools. I used to use a combination of Golden Cheetah, Excel, and a large hammer to make everything work. The problem was that no tool exactly fit what I needed. And with a typical in-depth review having anywhere from 10-30 sets of data contained within it, it became a nightmare to quickly generate the core data that the reviews are often based around.
Hence…the DCR Analyzer was born!
I worked closely with a developer (of FitFileTools.com) to inch our way towards a pretty sweet toolset for comparing data from the same activity. And early last year (2016) a smattering of you started beta testing it as well. Then earlier this past year (January 2017) I opened the doors to anyone who wanted to use it.
Since then, far more of you than I ever expected have been making comparative data sets and seeing how your devices measure up. It’s been really cool to see! Especially cooler to see it being used throughout the industry, and even some of the UCI World Tour Pro Cycling teams are now using it for analyzing and validating data.
Now there are free options out there to do similar things. But there are a bunch of nuanced reasons why I feel the DCR Analyzer is better suited for data comparisons:
– Automatic Alignment: It automatically aligns files based on GPS timestamps (or any timestamps). So you don’t have to worry about pressing start at the same time, or about pauses
– Data file support: It doesn’t barf on files with the latest data types. Many 3rd party tools have trouble with file format specs that are updated with new data types. Since I use the tool on usually unreleased products, I get these supported in the Analyzer well before you even know the products exist. :)
– Sensor support: The DCR Analyzer allows you to save your sensors and then automatically recognize them for .FIT files. This is great if you record lots of things at once and accidentally mix up which unit recorded which.
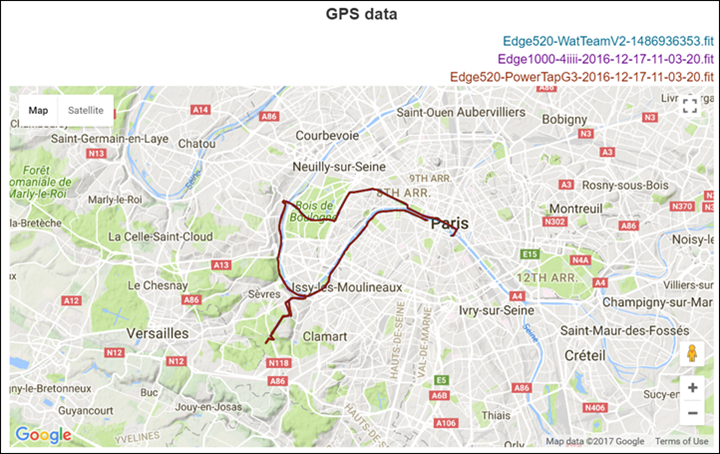
– Proper mapping: The ability to get true 1-second recording data tracks on the map is really important to me. A lot of sites/tools won’t properly display all the data points on the GPS map, which sorta defeats the purpose for analysis reasons.
– Constant improvements: We’re super open to adding features that make comparative analysis quicker and easier. I’ve got lots of ideas for how to keep improving the suite of tools for this purpose – without losing sight of the fundamental purpose: Comparing data files
– Data Types: It supports comparing a slew of data types: Heart rate data, Power meter data, Cadence data, Elevation data, Distance data, GPS Tracks
Now, to be clear – this is NOT a training log site. It’s not designed to replace sites like Training Peaks, Strava, SportTracks…or apps like WKO+ or SportTracks. Rather, it’s simply a tool to compare multiple sensors/tracks/whatever’s on the same activity. I still use all those tools myself as my training log. The DCR Analyzer is more like a graphing calculator than logbook.
So how do you get started? Well, there’s two options. First is a day pass, and then an annual pass. The day pass gives you 24 hours to create up to 3 sets of data (each set contains multiple files), and then you’ve got indefinite read-access after that. This is great if you’ve got a quick one-time use for it. This is $5.
The second option is the all you can eat annual pass. This allows you to create unlimited sets for an entire year. All 365 days of it! This costs $29 for the year, and like the day pass, your sets remain active indefinitely, even beyond your membership.
You can hit the account creation page here!
No matter which option you choose you can share the sets with public links, just like I do in my reviews (and you can also keep things totally private too). With public links you can post links to forums or e-mail, Snapchat or on a giant sign by the side of the road. Whatever floats your boat.
If you want to check out more about all the technical capabilities of it, you can read-up on the manual of sorts that I’ve put together here. This covers how to use the Analyzer, and some of my pro tips for analyzing hundreds of data sets with it.
With that – thanks for reading- and enjoy!
FOUND THIS POST USEFUL? SUPPORT THE SITE!
Hopefully, you found this post useful. The website is really a labor of love, so please consider becoming a DC RAINMAKER Supporter. This gets you an ad-free experience, and access to our (mostly) bi-monthly behind-the-scenes video series of “Shed Talkin’”.
Support DCRainMaker - Shop on Amazon
Otherwise, perhaps consider using the below link if shopping on Amazon. As an Amazon Associate, I earn from qualifying purchases. It doesn’t cost you anything extra, but your purchases help support this website a lot. It could simply be buying toilet paper, or this pizza oven we use and love.







I find you comparisons in the in-depth reviews really helpful. Making it available for us to use at a pretty reasonable fee takes it to a whole new level. As an owner of several power meters, head units, HR monitors etc I can really get get stuck into the data now. A new level of geekdom! Thanks Ray.
Thanks – I have been looking for an easy way to compare my interval workouts!
Specially 30 / 30 repeats
This will be perfect.
I really appreciate the sharing.
From the manual:
The tool is not designed for comparing workouts done at different times. Meaning, it’s not designed for comparing a Monday workout to a Tuesday workout on the same course. For that there are better tools as part of training logs.
Is there a free trial version? Or is there at least a price reduction von umeployed?
No free trial, mostly because you can check out the public sets (like the one linked to in the post). Though, there is the day pass – so that’s kinda like a reduced price trial. :)
This seems like a tool that could be used for data geeks that ride together, too — if it will align multiple files based on GPS timestamp, that tells me that one could grab a few buddies’ ride files, throw them together, and get a comparison of individual outputs.
That seems like a freaking awesome option to me for certain situations where nerding out benefits the team. =)
Indeed it would. Would be especially interesting in a team dynamic (like a team time trial even), to see how power drops off one one rider and then increases on another. Nerding out indeed!
Okay let’s see some old team data. SKY, BMC, who else will post, amateur team? It would be cool to see the aero effect all the way back.
Stumbled on the tool a few months back and have had a bunch of fun with it. Super easy to use.
link to analyze.dcrainmaker.com
My fiance laughs at me whenever I get ready for a run when I feel like testing out some data.
Awesome! And not too bad of numbers in that comparison either.
The 935 does a very good job on tracking. I find it still struggles the first 5-7 minutes, so try to start the watch up well in advance for it to hopefully find a good lock. I find the H10 strap comfortable so tend to stick with that as the accuracy is so good.
Registration asks for FTP. Clearly utilizing a tiered architecture where higher FTP users are given more processing power. ;-)
Nicely done. Fairly priced. You continue to impress. Keep it up.
Maybe I should price based on FTP instead! :)
Thanks – glad you appreciate it!
Awesome. Now if only I had multiple devices to use on the same run…
What about other types of analysis? Like comparing one metric for one same workout you repeat periodically. I am not aware of any tool where I can get advanced analysis (like fitting matematical models to sections of heart rate curves or comparing heart rate for multiple intervals in one same workout), other then cumbersome work on Excel.
It’s not so good for comparing the same workout over and over (I know Sport Tracks has something like that, as does WKO4 and Golden Cheetah). Only because everything is based on timestamps, so if those don’t match, then you’re kinda up a creek.
Technically speaking you could skew the timestamps to make them align, but you’d have to do a lot of math since the offset adjuster is based on seconds. :-/
Or you could use the Time Adjuster tool on FIT File Tools to align the file start times before loading them into the Analyzer.
Theo, you can try Today’s Plan. They have tools to easily compare intervals within the same activity or even across activities.
Not sure that would work. I think what Ray was alluding too above is that 1s resolution is pretty low (a lot can happen in a second). You’d probably have to resample the data unless you just wanted to compare longer averages. And resampling comes with it’s own (aliasing) issues.
(Probably fine for HR, maybe not power depending…)
Another option for FIT files, is the Perl tool “fitsed”, which is a stream editor for FIT files and would let you shift times with a one-liner. (Please ignore if “stream editor” and “one-liner” mean nothing to you…)
It’d be nice if the tool displayed pace for running activities. Also, either I’m doing something wrong or it doesn’t support bluetooth devices paired to a fenix 5X.
Hmm, interesting thought on pace. Never come up before – let me look at that.
For Bluetooth sensors, it definitely supports them (I’ve done some BLE power meters on the 5X). However, it won’t allow you to save sensor ID’s for BLE devices, since the spec itself doesn’t record the sensor ID’s for BLE devices. :(
I uploaded a file that should have data from a Bluetooth footpod, but it’s not listed under sensors. My Garmin footpod does show up in the sensor list.
I 2nd the request for pace/speed comparison… GPS data has 4 dimensions (longitude, latitude, elevation & timestamp) and I’d catch situations where the GPS location ‘stalls’ due to signal issues and then catches up when the signal improves. This may not show up in the route if the path during this time is relatively straight. This would be particularly useful to see how different devices handle things like tunnels since creative use of cadence/power data could be used to fill the gap.
Sorry, embarrassed, but on the registration page I don’t know what to put down for “FTP (watts)”.
Thanks Ray!
Just in time. Got myself new P1 pedals. The first ride showed wattage much higher than I expected from my last FTP test on KICKR, and i’m definitely less fit since then. Would love to know by how much these two are apart, given they are the extreme ends of the power measurements. The DCR analyzer will be perfect for doing such a comparison, and for me readjusting my known power KICKR levels to the new P1s.
Thanks!
Thanks Ray! Been using it for the last few weeks to compare heart rate info from the FR935 vs. HR strap and power data for the P1 pedals vs. KICKR1 or G3 hub. Takes an extra few seconds to rename the Garmin files, but super easy to use.
HI Joe,
Please, do tell about the P1 and KICKR1 comparison, as well as the FR935 vs. HR strap comparisons. Would love to hear!
Artur,
KICKR1 tends to consistently run 10w higher than P1. Usually use ERG mode in Zwift. Seen the same pattern on a few short free rides on Zwift, so not just ERG mode. I only have one outside ride so far this spring with P1 vs. G3 but they were pretty spot on (even though I forgot to calibrate), so I’d say the KICKR1 is the outlier. Done spindowns, calibrations, crank arm setting adjustment, firmware updates, etc. First link is P1 vs. KICKR1. Second link is P1 vs. G3.
link to analyze.dcrainmaker.com
link to analyze.dcrainmaker.com
Still getting used to the FR935- got it a few weeks ago. Overall I like it. Seems good for 24/7 stuff and GPS, mixed bag for OHR on activities. I’ve been recharging on Sundays with 35-40% left – takes about a minute per 1% to recharge. Also good for data across running/cycling (like recovery time) because it’s on one device instead of two. Seems to not like getting moved around/fidgeted with. Might be mostly my fault though as I tend to wear it *on* the wrist. Tried *off* the wrist, but tends to slip down to wrist since my wrist is narrower than further up. Probably will still use a HR strap for now. Might try OHR again here and there to see if things change.
Outside running (laps around a cemetery) seemed pretty good on the running laps, but lost the plot once I started walking. Fidgeting with it seemed to help it get the plot when it was off:
link to analyze.dcrainmaker.com
On the indoor bike, off the wrist was pretty good. Again, when it was off, fidgeting with it seemed to help *reset* it, particularly in the first few minutes of the workout:
link to analyze.dcrainmaker.com
Treadmill run/walk workout, on the wrist – mostly ok:
link to analyze.dcrainmaker.com
Weight lifting/resistance bands – off the wrist – pretty bad:
link to analyze.dcrainmaker.com
Also tried with mowing the lawn (no link). Similar to weight lifting pretty bad – I’m guessing because of all the jostling.
New data for the KICKR1: Wahoo updated the KICKR1 firmware about a week ago. I updated it on my KICKR1 yesterday. It’s just one workout, but the P1 vs. KICKR1 power readings are much closer now (average power was only off by 1w). The KICKR1 power data is definitely smoothed (at least in ERG mode – has been for the last 6 months I’ve been using ERG mode in Zwift). Anytime I slightly changed cadence, I could feel the KICKR1 adjust the resistance but on screen it showed the same power (it felt more like the P1 lines show):
link to analyze.dcrainmaker.com
Nice to see Wahoo still making updates to the KICKR1, even though they have the KICKR2.
I had noticed the 10W difference, that tends to reduce with usage. Have’t updated the fw yet.
Will see what happens
Thanks – esp for this!!!
Automatic Alignment
Will give it a try :)
Hello Ray
This is very useful but there are a few things that would be very useful (at least for me) to consider for additions.
1. Support for Garmin CIQ “developer data”. I thinking, for instance, of comparing Stryd power. I have got two of them and may want to compare different firmware releases…
2. Cumulative difference in distance accumulation. Over on the Garmin forums you get a lot of comments like this run on my new watch “lost” distance compared to my “trusty” device. The longer one is always “right” yeah – or is it… It would be nice to compare 2 or more files on the same run to see if the difference was “systematic” or caused by GPS spikes somewhere along the way. I am thinking very similar to the Strava segment compare tool.
3. Running pace (as already mentioned) would be good as kind of ties in with the previous one. You could then compare GPS derived current pace with foot pod derived pace to see how they shape up. In fact this might also be better done as a difference rather than an absolute value as would then be easier to see where it is “close” or not.
Thanks Tim.
Great suggestions, and ones we’ve been tossing around on how to implement. CIQ developer fields is definitely highest on the radar. And I like the idea of distance accumulation.
Pace is tricky actually. See pace isn’t recorded in the .FIT file. Rather the GPS locations and time stamps are, and pace is calculated. One of the core tenants we’ve taken is to always ensure whatever data we have exactly matches what’s in the files – and not to guesstimate. So i we did something in this area we’d want to ensure that it’s matching what is shown on the vendors site for pace (i.e. Garmin Connect). Definitely not saying no, just explaining some hesitancy there.
Thanks again!
Hello Ray
Puzzled now with pace and speed? When I open up an activity FIT file using FIT File Repair Tool then Speed (in km/h) is one of the “native” displayed fields (although you can display it as pace) and it does not appear that the program has computed it. You can sort of see that as one data point (with every second recording) has zero speed but a different lon/lat to the adjacent data points.
Also if I open up a treadmill run or a trainer ride, it again has speed but can’t be computing it from GPS as that was off!
I am fairly sure the FIT file contains the distance accumulation data (hence my suggestion) recorded by the device as this is how GC matches your device as opposed to some 3rd party apps that may take the GPS data given in the FIT and recompute distance from that.
Hi Ray, I’m relatively new to using the full subscription Analyzer service, but just wanted to circle back around on this recorded speed/pace vs track point derived speed/pace. It’s always been clear to me that there are 2 things recorded in the fit files that can be compared. This is really clear if you put a crazy foot pod calibration factor (like150.0) in to a modern Garmin GPS watch and have the foot pod setting configured to Speed>Always and Distance>Indoors. The pace chart in Garmin Connect is crazy fast, as you would expect, but the distance and re-calculated pace from GPS points is as one would expect to see (as Strava does). So there must be 2 things that can be compared, as is the case with fellrnr’s foot pod calibration tool where the graph in that tool is quite specifically a comparison of foot pod pace to GPS pace; in fact in simple terms, it’s the two graphs that fellrnr’s tool produces that I’d like to be able to see in the Analyzer.
>The DCR Analyzer Is Now Available For You To Use!
I wait, until it provides a kitchen sink.
I have noticed your’e not able to choose Power2Max power meters (Original, Type S or NG). Also you have 4iiii power meters listed but not the heart rate monitor.
No problem – added!
I’ve been adding them as I do comparisons in the calculator – so oddly enough the P2M one likely would have been solved this afternoon in due course. :)
But good call on the others and the Viiiiva. Thanks!
This looks a really useful tool for a lot of people. Great work developing this!
Will you have access to the data uploaded by users, even in anonymous form? It strikes me that with a large enough data set of comparisons between pairs of sensors you should be able to rank their accuracy. For example (off the top of my head) you could calculate the RMS difference between the sensors in each comparison, then for each sensor, calculate the mean of the RMS differences across all comparisons against all other sensors. The more accurate sensors should have lower numbers, although it may be more complicated to derive an actual number for the accuracy of each sensor.
This should work for any measurement I think, including GPS, HR, Power. I think it would be a great complement to your reviews where you can typically only test a single device of each type.
Just a thought…
It’s something I’ve thought about – but not something I’m doing today. Part of the challenge is the unknown on how accurate different folks are when it comes to calibration and such. With a much larger sample size it becomes less important though.
If things were to change I’d make it opt-in of course, and folks could decide if they wanted their data anonymously included. But for now we’re just working to get in other requests that focus on making analysis better/etc… I think medium term there’s more room for graphs/charts that better tell the story of accuracy for certain data types (power/HR especially) that require less human analysis.
I wish there was a paypal option for paying rather than a credit card …
No free trial use for DCR supporters? :)
It’s actually something I looked at doing, but logistically we were having some issues getting it done in a timely manner. And by we, I mean me. The DCR Supporter piece is handled in Wordpress as ‘Users’, while the Analyzer runs on a separate platform and Stripe handles the backend there.
So doing a one-time thing while manually cumbersome is possible (a messy mail merge basically), but trying to make it such that if someone signed up as a DCR Supporter that they’d get (instantly) the coupon codes for the Analyzer is where things fell apart a bit. It’s on my radar though – as I definitely want to provide more value in the DCR Supporter piece.
Thanks for being a supporter!
This is super cool. I’ve been playing with a Moov and I want to compare between the Moov data, my Garmin 520 and my FR 235 but I’m too lazy to do it. Now i have one less reason to be lazy about it!
Why not merging the premium subscription to the blog with the usage of the data analyzer?
Ok, didn’t read the previous comment :)
Sorry, yeah. Definitely was something I was trying to do (and still want to do). It’s actually a core reason I delayed some 4-5 months on announcing the Analyzer. Obviously, not all that time was spent on figuring it out, but one of those things that I just kicked the can down the road every time I tried to figure out how to do it in a non-clunky and sustainable manner. :-/
Can this handle strokes per minute (SPM) from an indoor rower? The concept2 logbook can export to TCX and FIT. Also the distance from a rower would be in meters but i would think a tool to overlay heart rate and power from a rower would be pretty great.
Not at present. At least, unless it dumps it into either the cycling or running profiles. If it does that – then you’re golden!
Thanks Ray for all your hard work you’ve put into this app, it’s really interesting what you’ve done.
Just wondering if it would be possible to be able to overlay different parameters on the same graph? Notably it would be massively helpful for me to see power and HR against each other.
Reason being, I have a pair of Vector 2 pedals and a new Kickr 2017. Kickr is reporting pancake flat output but Vectors are drifting up and down. In trying to identify which of the two is giving a truer representation I was hoping HR might provide part of the answer.
I’ve had a basic crack at this manually myself today. As my Vector power starts to drift down I can see my HR dropping by a few beats and vice versa, thus suggesting my Vectors are giving a more accurate picture than the Kickr.
Thanks,
CBH.
Hi Ray
If I would like to compare my Elite Direto with my Stages PM. currently being used in conjunction with Ant+ and Zwift.
1) Would you suggest to record a workout simultaneously with 2 Garmin devices (which I own). Or use the data from the Zwift recording? Not sure what is best/easiest?
2) I assume to have the timestamp right I have to start recording exactly on exactly the same moment on both devices as their is no GPS timestamp indoors?
thanks in advance for a short feedback and thanks for bringing up should nice tools!
Hi Dick-
1) Yup, I’d definitely recommend using your two Garmin devices. Zwift can indeed be used, but I find just using the two Garmin devices is the easiest workflow wise, and you don’t have to worry about any gap situations in the event you pause Zwift.
2) For indoor workouts it uses the timecode on your GPS device (just like outdoors). In general, I find that most Garmin devices drift about 1-3 seconds per week if indoors and never accessing GPS. You can easily use the ‘offset’ option within the Analyzer to account for this though, as sometimes that’s even required outdoors (today on my ride, I had to offset one file by 1 second). Super quick option. That said, in general as a best practice I’ll simply get GPS signal outdoors for about 30 seconds the same day, then come back in and turn off GPS. That’ll be enough to update the timesync on the unit and you’ll be good to go. Again, not super critical if not done, but just makes your life a bit easier.
Enjoy!
Anyone getting a Server error: null when trying to sign in? Can’t seem to access it as of today.
Hmm, I just tried it without issue. I’ll circle with developers real quick and see if there’s something else going on.
It seems to work for me outside of company network. I’m getting issue when it tries to post login to link to dcr.5parks.com so maybe company content filtering is causing issue.
I confirmed it still works at home so it’s not a biggie and I love the functionality as it’s been huge help in troubleshooting wattage differences between my powermeter / trainer.
On a non-related note, I shoulda bought annual pass instead of two day passes lol as I’ve kinda fell in love with the functionality.
Hmm, yeah, we looked into it last night and we’re not seeing any errors on our side. And the specific error your getting seems to be a client error (not receiving back the page). It’s the first time I’ve heard of a company filtering the results, but I suppose it must have triggered on something. Ya know…that dirty scandalous power meter data!
Thanks for giving it a whirl – and glad you’re enjoying it!
Im guessing I’ve somehow done something to confuse the data, but I’ve exported data out of Garmin Connect to compare. One is a Kickr, the other P1 pedals. Been having issues with the Kickr with variations in speed and power so this was a great way to compare.
But, the analyzer shows both off in terms of speed and distance for the Kickr, yet looking at the numbers from the Garmin, they are quite close:
Kickr (analyzer — Garmin)
8.96 kph / 17.91 k — 30.05 mi | 1:30:00 | 20.0 mph
Garmin 935 (analyzer — Garmin)
9.112 kph / 47.08 k — 29.26 mi | 1:30:10 | 19.5 mph
So, maybe this is just another example of Americans not being able to handle the metric system, but pretty sure the speed is off, 90 mins workout wouldn’t add up to the distance the 935 shows or Connect shows on both.
Was guessing the 30 miles (approx) was correct for distance.
So, why so low in speed and why really low in distance with the Kickr?
Going to try another compare with today’s workout, so maybe it’ll be better?
Thanks,
Chris
Do you by chance have an Analyzer link to check out?
link to analyze.dcrainmaker.com
Got to be something I did and didn’t think about it….
Thanks.
So a couple of things:
A) The units aren’t time-aligned. So I fixed that first (it was off by -190 seconds). This can happen when using something like a Garmin Edge that hasn’t been sync’d to satellite in a long time, as it tends to drift a bunch. Or just a computer that’s clock is way off. This doesn’t directly impact the totals, but it does make it hard to compare. To fix this I set an -190 second offset on the KICKR file, which you can do at the bottom of the page on the settings for each file (little ‘Edit’ icon).
B) The Wahoo KICKR has ‘ERG Mode smoothing’ enabled. This feature means that it basically fakes the power to make it look prettier (smoother). And as such, makes it near-impossible to do any sort of analysis. You can disable this using the Wahoo smartphone app, add the KICKR as a sensor, and then toggle it off in the settings.
C) Distance: So the reason the distance was different is actually interesting. If you check out the distance graph (looks like a hill), it plots distance over time. So anytime the two aren’t mirrored, that means something different is happening. So it starts off with the one unit actually accumulating distance for the first two minutes solo, and then catches up. Then you’ll see how one seems to either drop the connection or otherwise stop calculating distance (paused perhaps)?
D) General thoughts: Now, while I was able to align things, i wasn’t able to totally align things. You’ll notice how the middle section is perfectly aligned, but the start/end is all wonky and not aligned. This looks like one of the units was paused or otherwise stopped recording – which can make analysis tricky since we don’t have identical sets of data to work from. In general I simply press start at the beginning of the workout, and then end at the end – and never pause for anything I want to do analysis on.
In short, I think if you disable erg mode smoothing, stick your Garmin head unit outside for a few minutes to get GPS (so it gets the right time, then you can disable GPS again), and then do a start to finish comparison, it’ll be much clearer as to what’s going on. Also, you’ll feel like me. :)
Note: This post might also be of use: link to dcrainmaker.com
Thanks for the tips and looking into it. As expected, user-errors…
Getting ready for a work-trip but I’ll have some good reading material so when I get back, I’ll be ready.
So, sorry to say but still questions.
I did disable Erg Mode Speed Simulation and Cadence from ANT+ & Control w/ ANT+ were already disabled but still getting the same graph, spurt smooth. I’d love to pass it off as talent, but yeah, not the case.
So, was wondering if this could also be from TR app settings? Perhaps Power Match, though don’t have anything other than the Kickr, Tickr and Wahoo cadence sensors all using ANT+. Perhaps something funky with Kickr, I am working with them on odd readings – hence all this comparison work.
Thanks
Chris
Hmm, power match could indeed be an issue. I don’t use it (PowerMatch) because I find it generally does more harm than good.
It’s also possible you’re in just the right gear and the workout is structured well enough that it’s handling the changes well.
OK, good to know, will give that a try.
Thanks!
Is it expected that the Analyzer misses HR data uploaded after a swim? Here are 2 links that show the problem:
link to analyze.dcrainmaker.com
link to connect.garmin.com
Hmm, that should be fine. For the FR945, I assume you were using HRM-TRI or HRM-SWIM?
For those straps they backfill the data to the watch after the fact in a bit of a different method. However, we had supported that previously, so I’m wondering if something was tweaked in the FR945 in how that records. Let me do some digging…
I was wearing an HRM-TRI with my new FR945. The HR data shows fine in Garmin Connect.
Ray, I’ve been doing some more digging on this now I have a HRM-Tri to go with my Fenix 6X Pro Solar and MARQ (this post dates the message I sent via the Contact tab). It seems the HRM-Tri data is not ‘merged’ in to the activity fit file, as the fit file modified date/time is as it is saved when the Start/Stop button is pressed, but it appears the HR is separately stored in a folder on the watch “GARMIN>TempFIT>SaF_HR” with a file cunningly called “hrdata.fit”. Clearly Garmin Connect uploads both the activity file and this hrdata.fit file to display in Connect. I have tried uploading the hrdata.fit file with the activity file to the Analyzer, but the Analyzer doesn’t seem to like the hrdata.fit file for some reason and no data is displayed. The only solution I have found is to go to Connect (website) and download the TCX file for the activity and upload that to the Analyzer with the Original activity fit file; that TCX file contains the HRM-Tri data rather than nothing or WHR data that is in the Original fit file. It’s actually kinda cool when you get it working, as you can then compare WHR recorded to the Original activity file with the HRM-Tri HR data on the TCX file.
Hi Ray, I’ve just noticed that the new battery chart update seems to have introduced a bug with public links created. The public links no longer have any of the charts or info below the Developer Data chart (everything displays fine when the activity is viewed in my account). In case it was a glitch with one set, I created a new set and got the same. Hopefully it’s not too tricky to sort out.
Woah, nice catch. And it’s funny, when I looked at the link above this morning, something in the back of my mind said ‘Something isn’t right here’, but I couldn’t quite make it click.
In some respects it’s a relief that I’m not the only one impacted. There’s nothing worse than seeing a bug like this, but then finding out you’re the only person impacted and everyone thinks you’re making things up or must doing something wrong.
All fixed now :)
Thanks for this. And particularly for the $5 day pass. I have a new pair of Rally XC-200 pedals and I was concerned that the power readings were out of whack. After spin down and calibration I did a short FE-C ride with my Edge-830 paired to the Kicker and my XC-200 pedals paired to an Edge 1000. Did about ten minutes. Uploaded the two fit files to compare and the Kicker and pedals were pretty much in agreement throughout the ride. Thanks for the time offset adjustment. I had about a four second separation and that brought the file data into alignment. Pretty cool for diagnostics riding in the basement. Saved me along fruitless contest with Garmin that for once is not their problem. And actually not a problem at all.
Thanks for the great tool, as well as everything else you do.
Regarding the DCR Analyzer, I wonder if you’ve considered giving a switch to select imperial vs. metric measurements. At the risk of being a crybaby American, I confess I would prefer it, maybe others would too.
Larry
Thanks Larry!
I’m not opposed to it, and as an American, I totally get it myself. I think the main thing is that really the only part that’s “harder” to grasp is the pacing/speed bits (primarily for pace specifically for me), which to be honest – I rarely use in exact terms, but just relative terms. Distance in meters in my head snaps to yards pretty easily if I need it to.
Anyways, not saying no – I think the thing is I’ve only ever had one ask for it. :-/
Cheers!
Thanks, Ray.
Here’s another oddity:
I did a 32 mile bike ride using a Forerunner 45 and an Edge 530. The results were predictable, except for the elevation chart. The Forerunner shows the elevation roughly 30 meters (~200 feet) higher than the Edge.
I tried having Garmin Connect enable elevation correction prior to exporting the Edge .fit file, but this didn’t change anything.
I think the Edge has an altimeter and the FR does not. Does this explain it ? 30 meters seems like a lot to be off by.
If there’s an explanation and/or a way to make it more accurate I’d appreciate it.
Thanks,
Larry
Indeed, that’s pretty normal for GPS vs barometric altimeters. I have a really old post on how GPS altimeters work: link to dcrainmaker.com
Ironically, it all applies here today, a decade+ later.
Realistically, there’s nothing you can do to make the GPS-based altimeter more accurate on the FR45. Inversely, if you believe the Edge is actually incorrect, you can set basically override the elevation at a given point, which recalibrates things.
Ray, Analyzer is a great tool! Thanks. One issue I’m having is trying to compare single-sided pm (4iiii) with left side of dual-sided pm (Rally XC200). Unchecking only the “Show Right Power” on the computer measuring the single-sided pm gives me no reading for that pm in the Left/Right Power chart. Unchecking only the “Show Left Power” gives me the total average power (i.e. double the actual left-side average power). I can do the math and halve what shows up as the average right-side power in the table but would love to also see the graphical comparison of how they track across a chosen duration. Any solution or setting options that would give me left vs. left (or half right vs. left) in graphical form. Here’s the file link to analyze.dcrainmaker.com. Many thanks.
So, I just uploaded a set to compare my Rhythm 24 with the built in sensor on my new 945 LTE. (This pointed out that the 945 LTE still defaults to smart recording. Grrr.)
But anyways, there is an ANT+ device listed in my Fenix 3 recording. But I have no idea what it is. I’ve renamed all of the sensors in my F3. So I can’t see the ANT+ ID’s anymore. I ran with a dead (I thought) foot pod. But it would not pair with my 945 after the fact. I put a new battery in it, and paired it to the 945, and it was not the ANT+ ID that was recorded.
Long lead-in to a simple question, is there a way to see what data was actually recorded for the specific ANT+ ID? That could tell me what it was. It might have been something that paired in the garage before I headed out, and didn’t actually “record” anything. But I was just wondering what investigation tools were available.
BTW: Apparently the fenix 3 does not record battery level. So no burn rate is available.
Hi Ray, I’ve sent an email to you with details (which hopefully hasn’t got stuck in your spam), but when I renewed my premium annual subscription to the Analyzer today, my card was instantaneously charged twice! I was emailed two unique invoices/receipts, so hopefully easy to fix by refunding one of them, but thought I’d post here in case this is a systemic problem with the billing service at the moment you use and others hit the same issue (and so you know to get it fixed).
Just heard back from Ray and it sounds like I’ve hit a rare issue with the renewal system, so doesn’t sound like a widespread problem that others will encounter (but you know what to do if it does – just email Ray).