
As you saw yesterday and over the weekend, sometimes gadget things just don’t make sense. And one of those things has been the tsunami of data I collected on a single run this weekend, using a wide variety of products designed to measure running efficiency and form.
Of course, some of these products aren’t new. For example, Garmin’s Running Dynamics has been around since 2013 with the FR620 initially using the HRM-RUN, as has RunScribe since 2013. Others have popped up onto the scene in the last year or so, with more even in the last few months. Yet what’s new is really having the ability to start evaluating what is theoretically the same data from different companies. It’s one thing to have two different companies and compare data (i.e. Garmin vs RunScribe), but it’s another to really dig even further and compare a lot more at once…like…six of them concurrently. All of which ultimately get to the question of: Which one is correct? Or…are any of them correct?
For reference, here are the devices I was using:
1) RunScribe running pods (dual left/right pod setup)
2) Stryd running pod power meter
3) Kinematix Tune insole based running metrics (dual left/right setup)
4) SHFT running metrics/power meter (dual pod setup)
5) Milestone footpod with advanced running metrics
6) Garmin HRM-TRI Running Dynamics (HR strap)
Note that there are other advanced running metrics devices on the market that I didn’t use/have for this run. They include: Wahoo TICKR, RunTeq Zoi, FeetMe, Lumo, and more I’m likely forgetting or have never heard of. I also touched on a few others at ISPO a couple of weeks ago like DigitSole.
Most times in reviews/posts I collect vast sums of data and rarely post on something until I have those piles of both mainstream and edge cases to evaluate. But in this case, I’m going to simplify things a bit more and just look at this single run. After all – most consumers aren’t looking at half a dozen devices to decide which one is correct. They’re expecting that the data they use is both accurate and precise, as well as repeatable and actionable.
‘Riddle Me This’ Background:
During one of the IT projects I worked at back over a decade ago now, I spent many long nights in a corporate apartment with two co-workers. Both these colleagues can now be counted among my best friends (including my groomsmen). Much pizza and Mountain Dew was consumed. At the time our job was partly to understand why things were the way they were. It often started with one of us staying aloud: Riddle me this – Do you actually know how ‘X’ works? In theory, you did. At the surface, the questions were always simple sounding. Of course you knew how DHCP leases (and renewal) worked. Of course you knew how Active Directory rejection and escalation of incorrect passwords worked. Or, of course you knew how some other staple of IT computing worked.
But that wasn’t actually the question. The question was did you really know how it worked. Could you tear it apart packet by packet and explain precisely what was going on? Could you explain the exact moment something was triggered and the various domino effects from it? For example – does the computer request a new DHCP lease if it reboots mid-lease duration? And if it does, did that extend the lease time if it was prior to the half-life of the lease? What did the client do if the server removed the address from the lease pool? No doubt these concepts all sound foreign if you’re not in IT. And that’s OK.
The point of the question was in effect a dare: Could you produce the mother of all in-depth e-mails and explanation on what sounded trivial, but in reality was not. Could you leave that knowing that you now know all there is to know about some inconsequential little topic that virtually everyone takes for granted?
All of which is a long-winded precursor to my ‘Riddle me this’ in this post. A riddle that perhaps it might be up to you to solve.
What’s being measured:

Before we get too far along, let’s me define what we’re going to focus on today. These devices all measure various running efficiency and form metrics. The theory behind them is that you can focus on one specific element (or a group of elements) and modify your running form. By modifying your running form you may run more efficiently, which means that you can expend less energy to go the same pace (or spend the same energy and go faster). Ultimately this is mostly all about either going faster, or spending less energy. There are however elements around injury reduction too though, which some companies focus on more than others.
Each company generally measures between 6 and 12 different metrics. Some of those metrics are the same across devices. For example, cadence is cadence (whether displayed as single leg or double/total), and pace is pace. Those two are the foundation of running metrics, and companies shouldn’t be getting those wrong. Then you move into areas like Ground Contact Time or Vertical Oscillation – all of which should, in theory, be the same across devices if supported. Finally, you move further into more detailed areas like footstrike type or g-forces, which can get very nuanced depending on how you measure it or where you measure it.
To start, here’s what each of the units I was using is capable of recording. Note that I’m specifically covering items which are exposed in their apps. If a user can’t access it – it doesn’t count. Meaning, just because they may have that data somewhere behind the scenes, if it’s not exposed to an end user it doesn’t matter to me. I’m also not covering in this table some of the coaching elements that you see in some apps like SHFT.
| Function/Feature | Garmin HRM-RUN/TRI | RunScribe Pro | Stryd | Milestone Pod | Kinematix Tune | SHFT Run |
|---|---|---|---|---|---|---|
| Copyright DC Rainmaker - Updated May 20th, 2020 @ 10:19 am New Window | ||||||
| Price | $89 (+ watch) | $162 (Dual Config) | $199 | $29 | $199 | $199 |
| Placement | Chest strap | Footpod | Footpod | Footpod | Insoles | Footpod & Chestpod |
| Support dual pods? | No | Yes | No | No | Yes | Yes (Chest/Foot) |
| Is phone required during run? | No | No | No | No | Yes | Yes |
| Battery type | CR2032 Coin Cell | Rechargeable | Rechargeable | CR2032 Coin Cell | Rechargeable | Rechargeable | Metrics | Garmin HRM-RUN/TRI | RunScribe Pro | Stryd | Milestone Pod | Kinematix Tune | SHFT Run |
| Cadence | Yes | Yes | Yes | Yes | Yes | Yes |
| Pace | Yes | Yes | Yes | Yes | Yes | Yes |
| Total Steps | Yes | Yes | No | Yes | Yes | No |
| Running Power | No | No | Yes | No | No | Yes |
| Vertical Oscillation | Yes | No | Yes | No | No | Yes |
| Ground Contact Time | Yes | Yes | Yes | Yes | Yes | Yes |
| Ground Contact Time Balance | Yes | Yes | No | No | Yes | No |
| Stride Length | Yes | Yes | No | Yes | Yes | Yes |
| G-Forces | No | Yes | No | No | No | Yes |
| Footstrike location | No | Yes | No | Yes | Yes | No |
| Pronation/Supination | No | Yes | No | No | No | No |
| General efficiency score | No | Yes | No | No | No | Yes |
| Other notable data captured | Vertical Ratio | Footstrike type, pronation velocity, braking forces, flight ratio | Leg spring stiffness, Form Power | Leg swing, rate of impact | Heel time, Heel Strike, Gait Cycle Time | Brake effect, time in air, landing angle | Data | Garmin HRM-RUN/TRI | RunScribe Pro | Stryd | Milestone Pod | Kinematix Tune | SHFT Run |
| Can export data | Yes | Yes | Yes | Per minute summary only | No | Only GPS/Cadence | Integration | Garmin HRM-RUN/TRI | RunScribe Pro | Stryd | Milestone Pod | Kinematix Tune | SHFT Run |
| Can use as standard ANT+ footpod | No | No | Yes | No | No | No |
| Can use as standard Bluetooth Smart footpod | No | In beta | Yes | In beta | No | No |
| Can use with Garmin Connect IQ | No | No | Yes | No | No | No |
| Can use with Suunto for running power | No | No | Yes | No | No | No | Purchase | Garmin HRM-RUN/TRI | RunScribe Pro | Stryd | Milestone Pod | Kinematix Tune | SHFT Run |
| Amazon | Link | Link | N/A | Link | Link | Link | DCRainmaker | Garmin HRM-RUN/TRI | RunScribe Pro | Stryd | Milestone Pod | Kinematix Tune | SHFT Run |
| Review Link | Link | Link | Link | Link | Link | Link |
Phew…holy data moly!
Of course – all of this ignores whether or not there’s any actual use for much of this data in terms of making you a better/faster/safer runner. It’s incredibly easy for companies to point to studies that prove that you should run one way or another because it somehow might be faster/better one way or another. But more on that in a moment, first let’s look at the numbers.
A Runny Pile of Data:
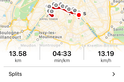
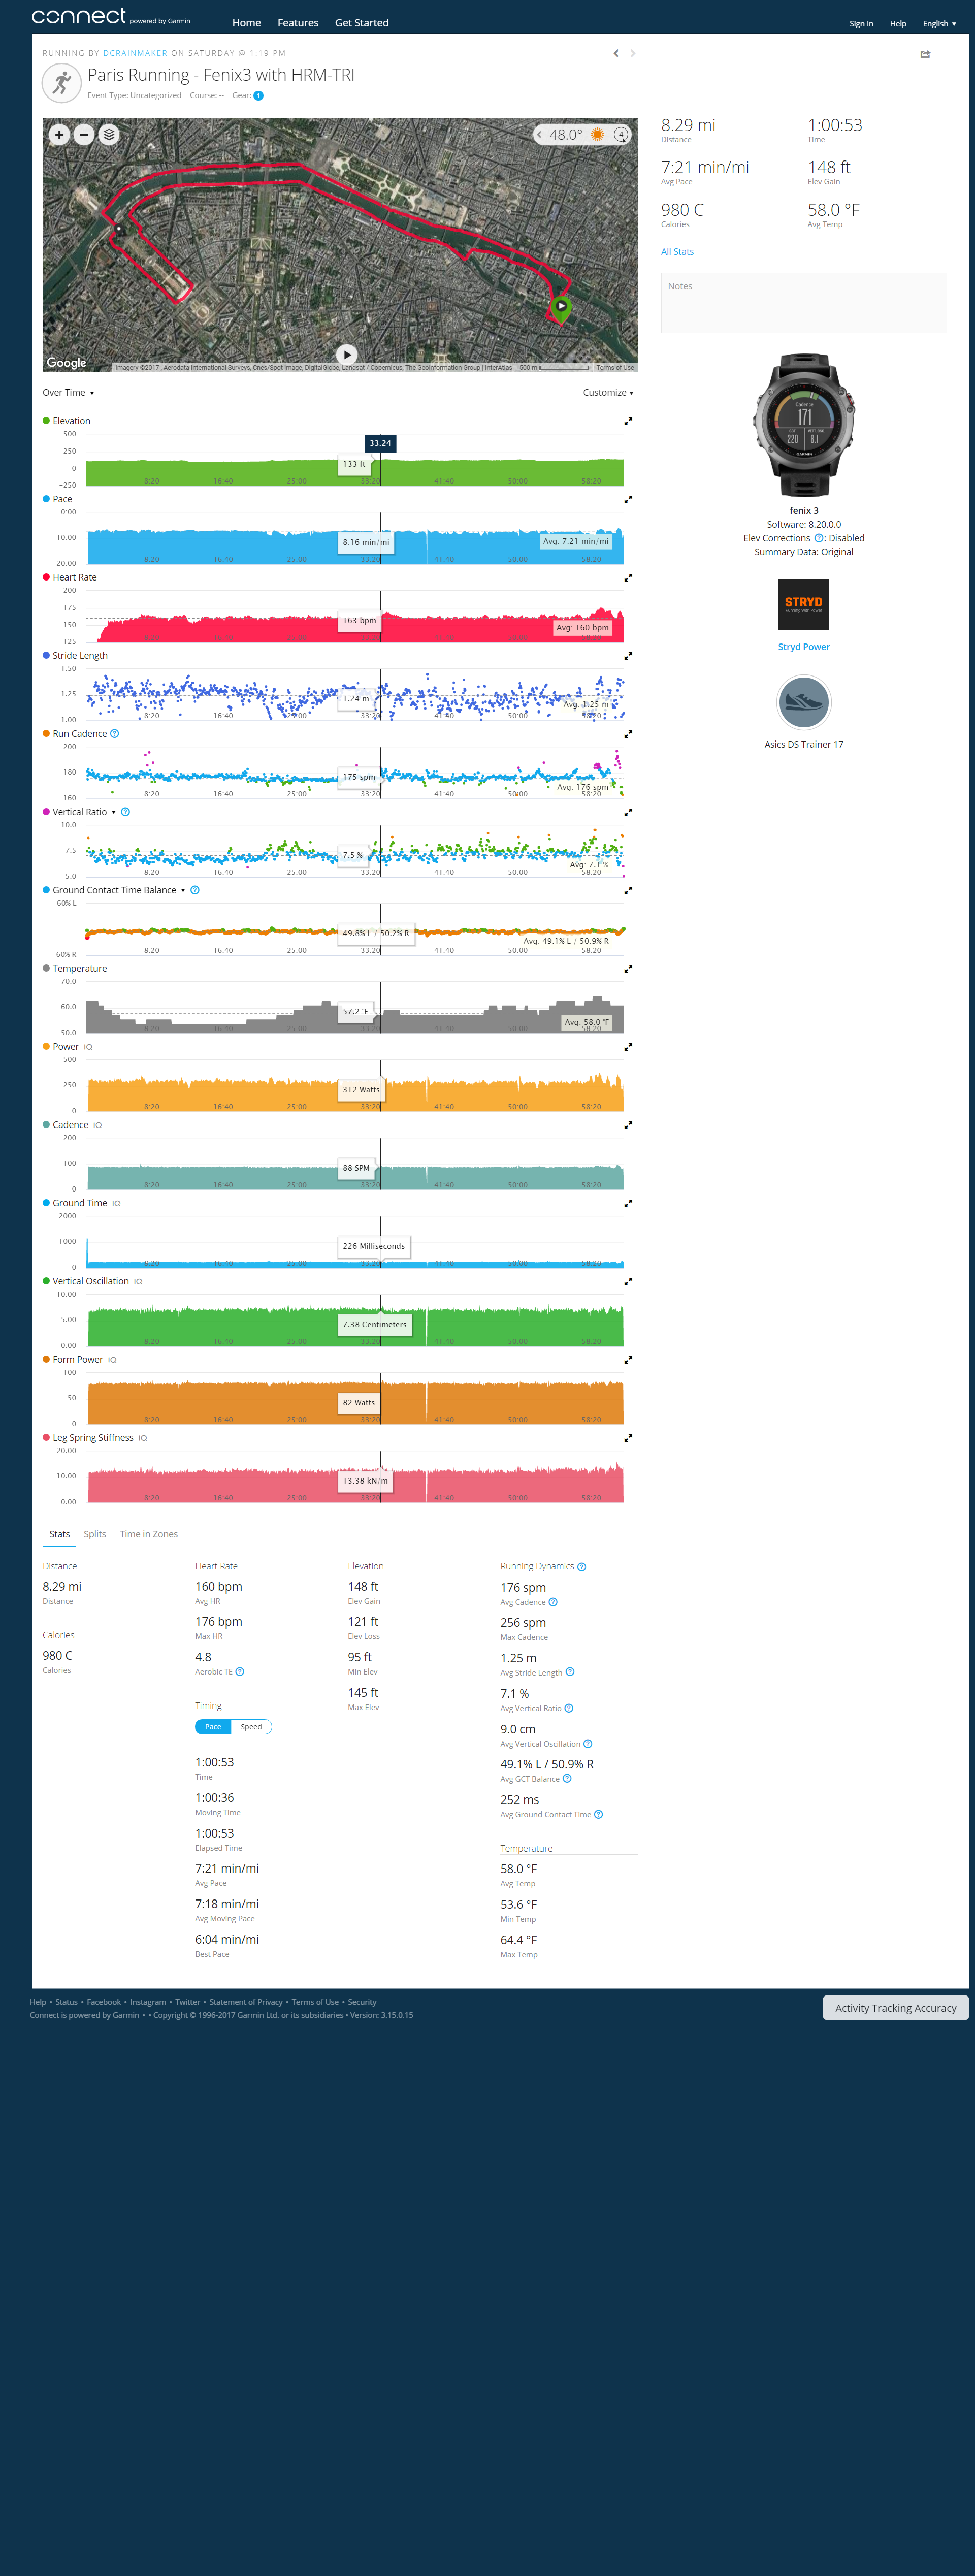
So with half a dozen running metric devices charged up, and four GPS watches, I set out on my roughly hour long run. The run was almost entirely without stoppage, and on mostly flat terrain. There were a few minor inclines up/down ramps to the river, and the ground was primarily pavement, with a portion compact dirt and finally an even smaller portion cobblestones. In general when I run I don’t stand for lights and such, but rather simply run up/down the street until I can safely cross. You can see the route here, as well as the pacing.

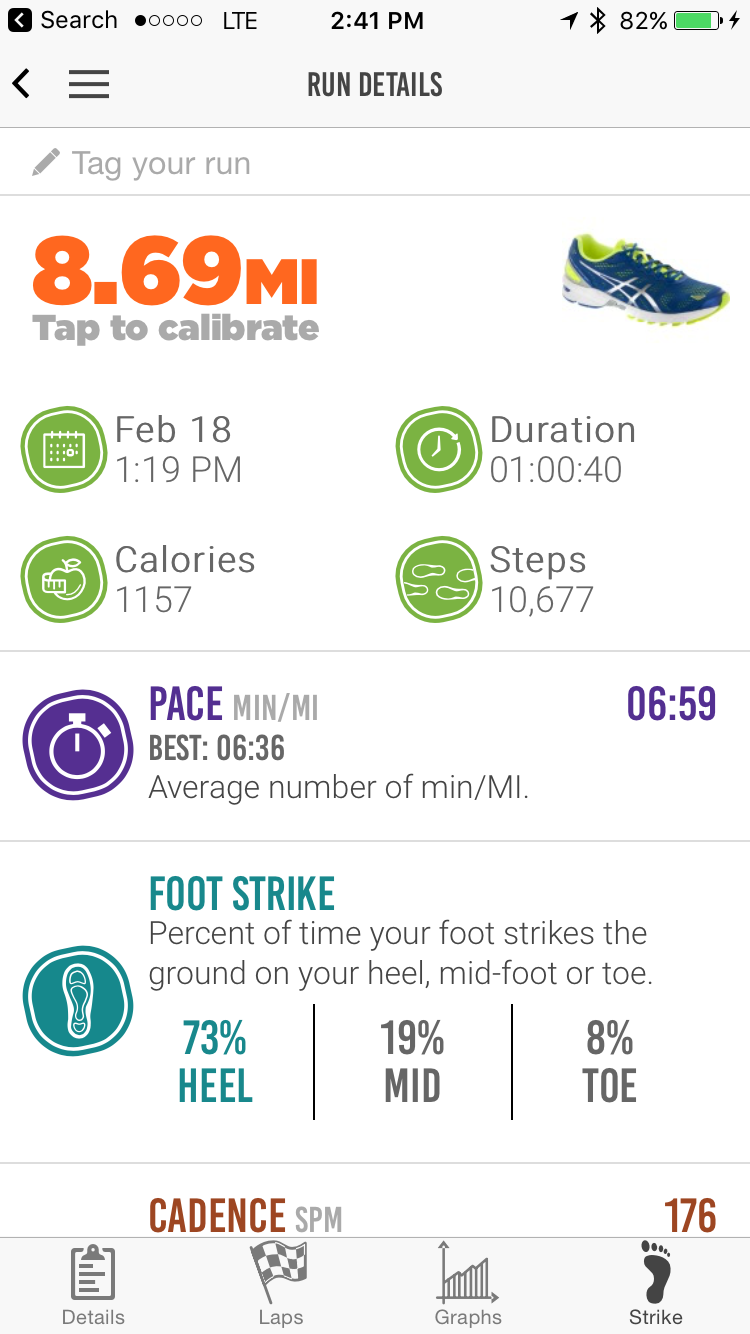
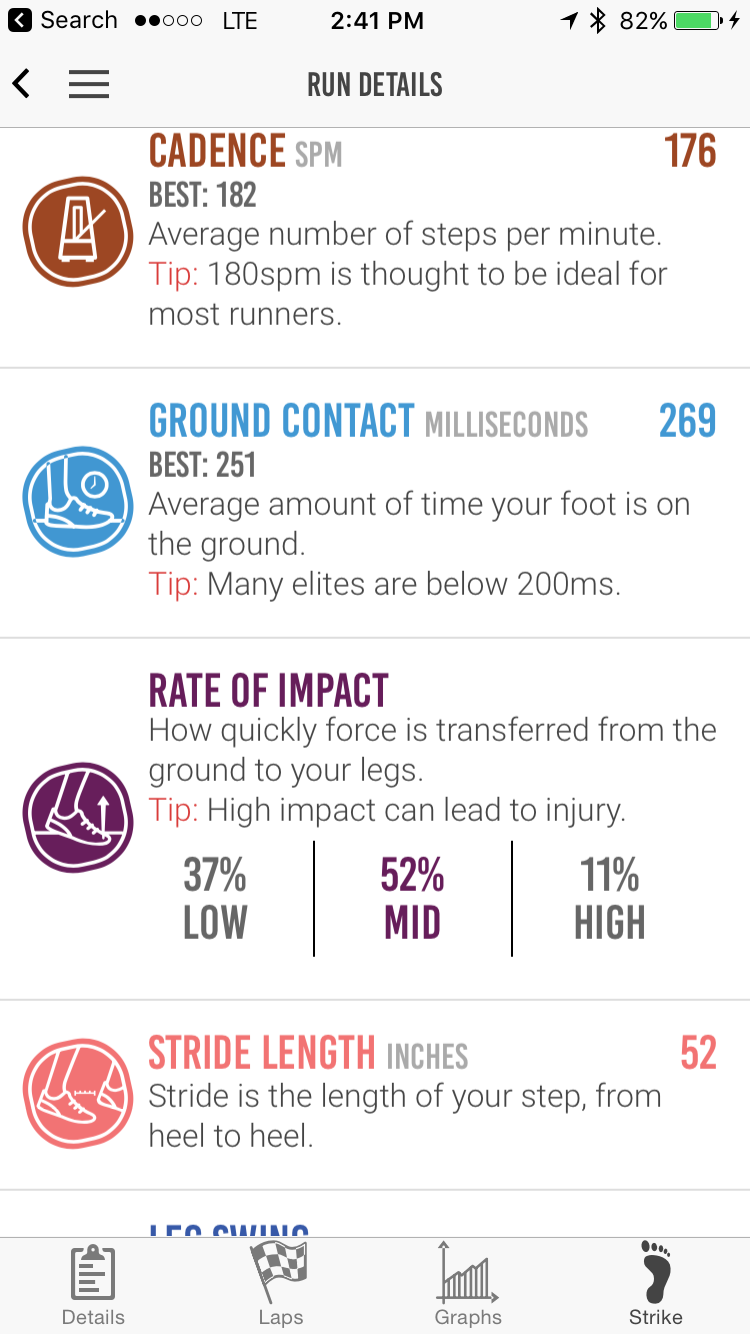
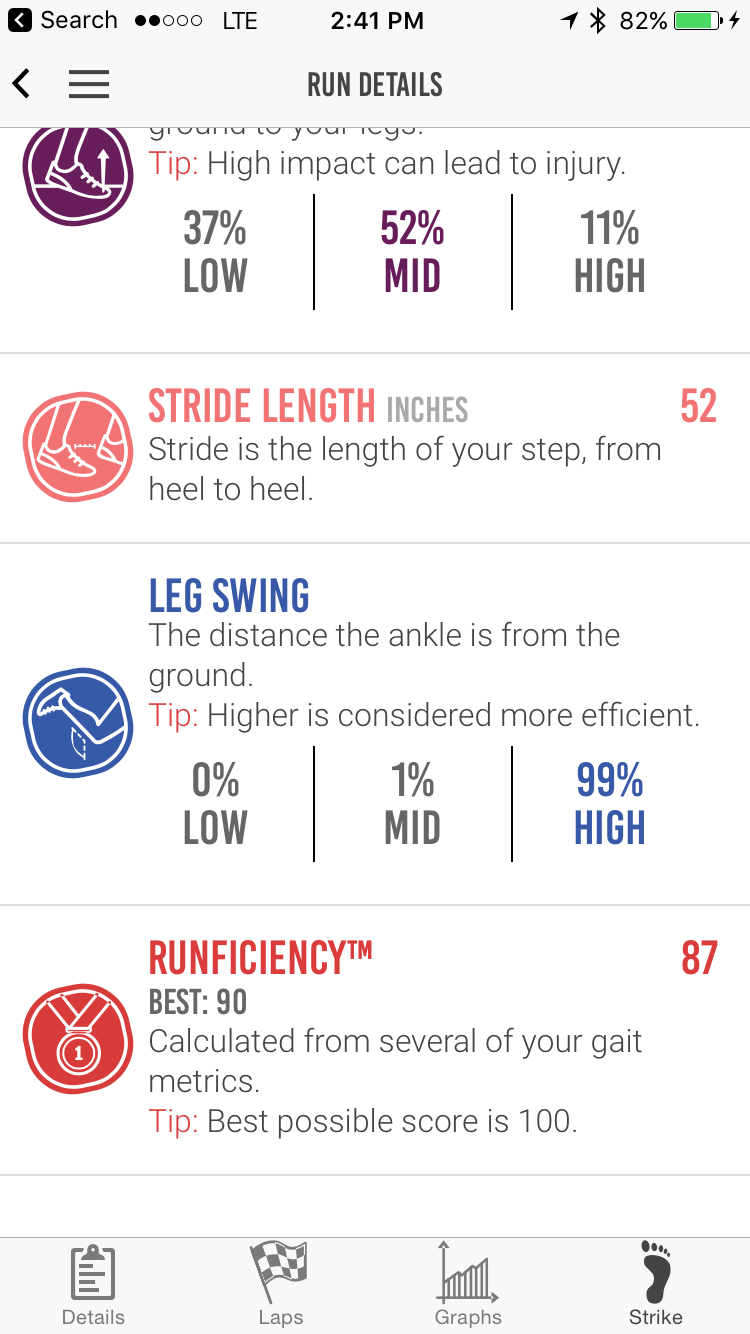
Now the first piece of the puzzle is getting a way to compare the data. Sure, I could show you screenshots from each piece, but that’s hard to actually compare like data side by side. Still, I’m going to do it anyway. Here’s a gallery of the different pieces from all of the apps. For the phone-only apps, I’m including a few screenshots of each:
-
- Kinematix Tune

-

- Kinematix Tune

-
- Kinematix Tune

-
- Milestone Pod
-
- Milestone Pod
-
- Milestone Pod
-
- Milestone Pod
-
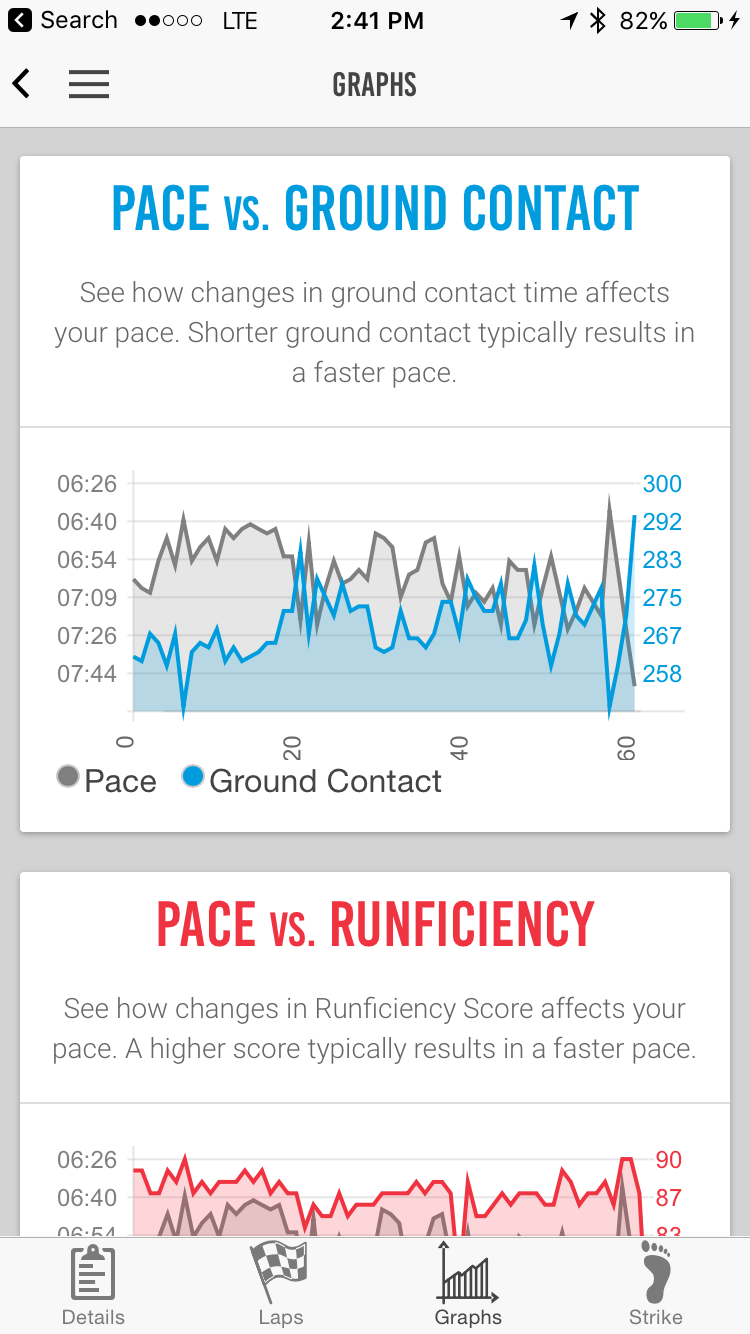
- RunScribe
-
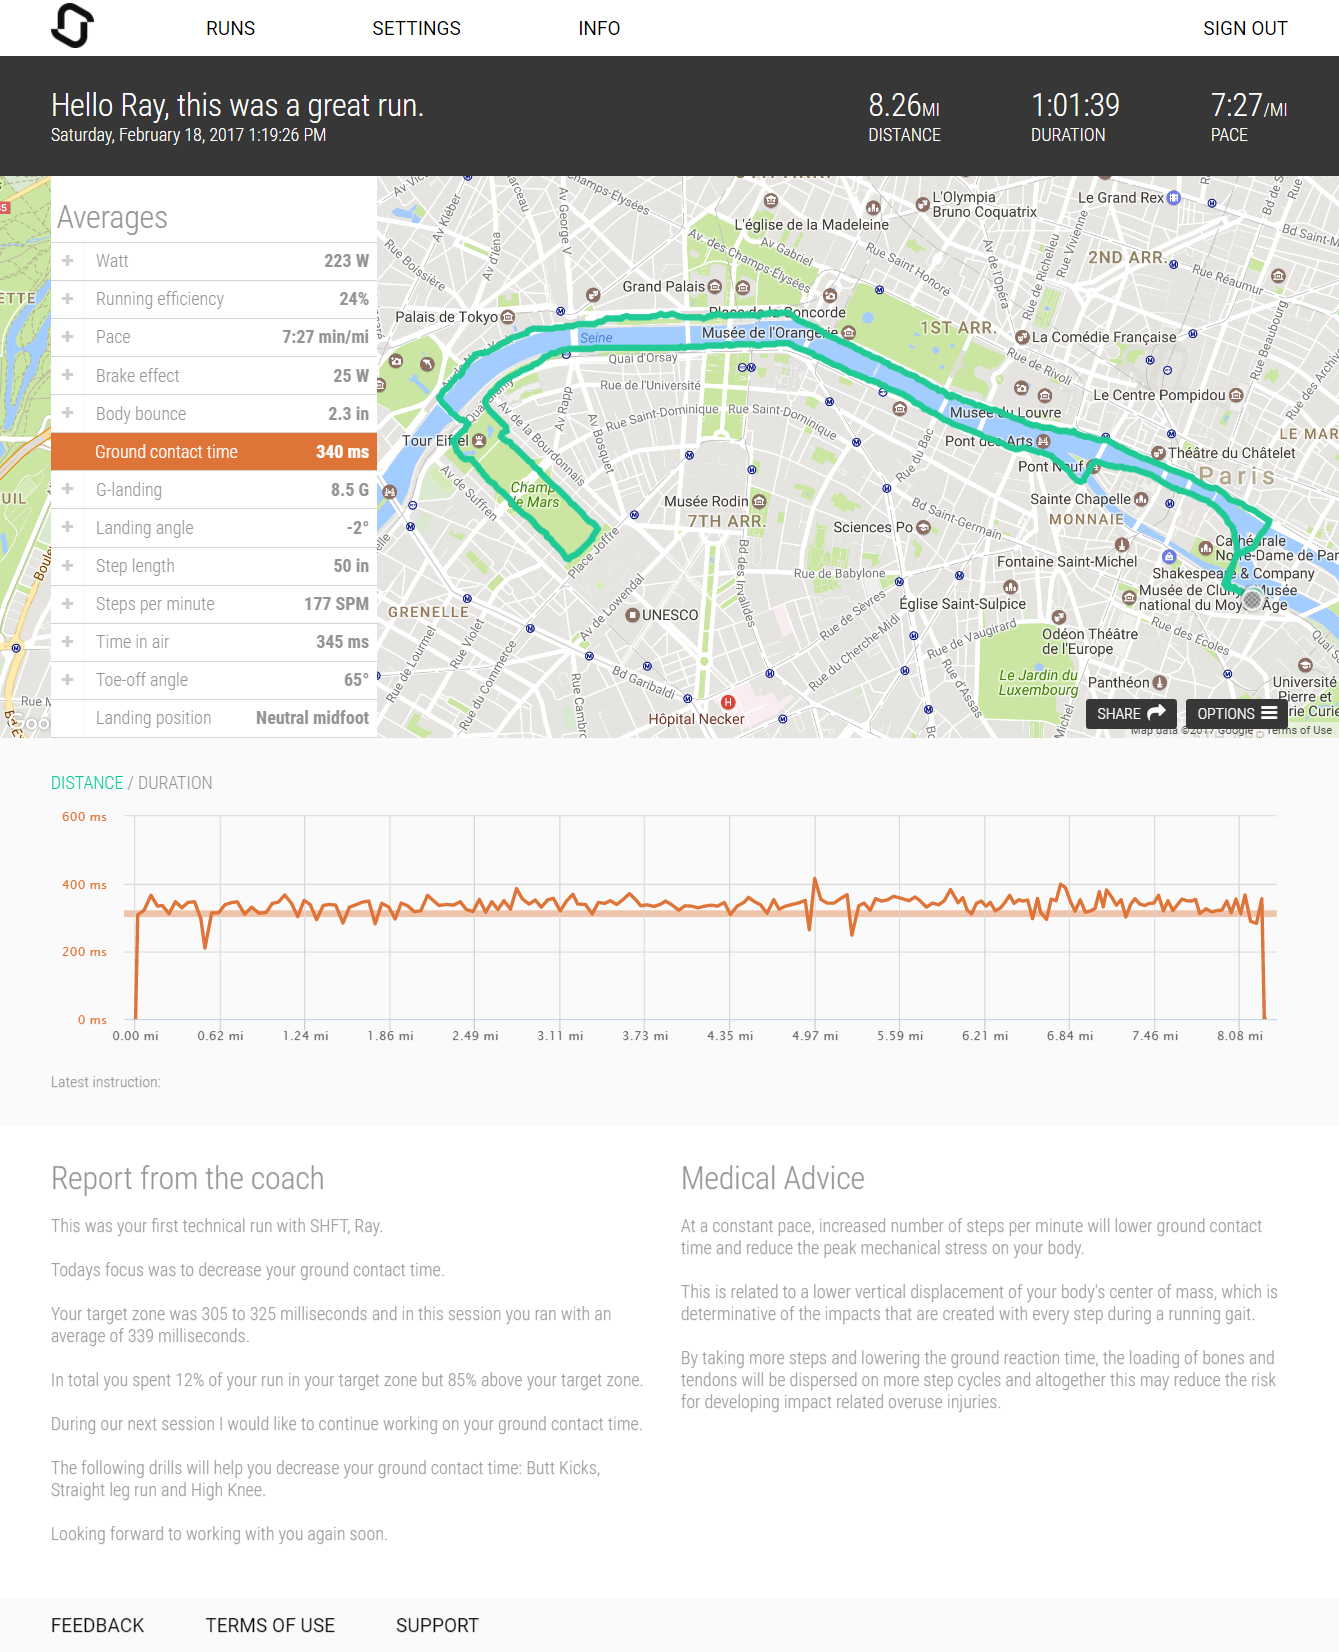
- SHFT Run
-
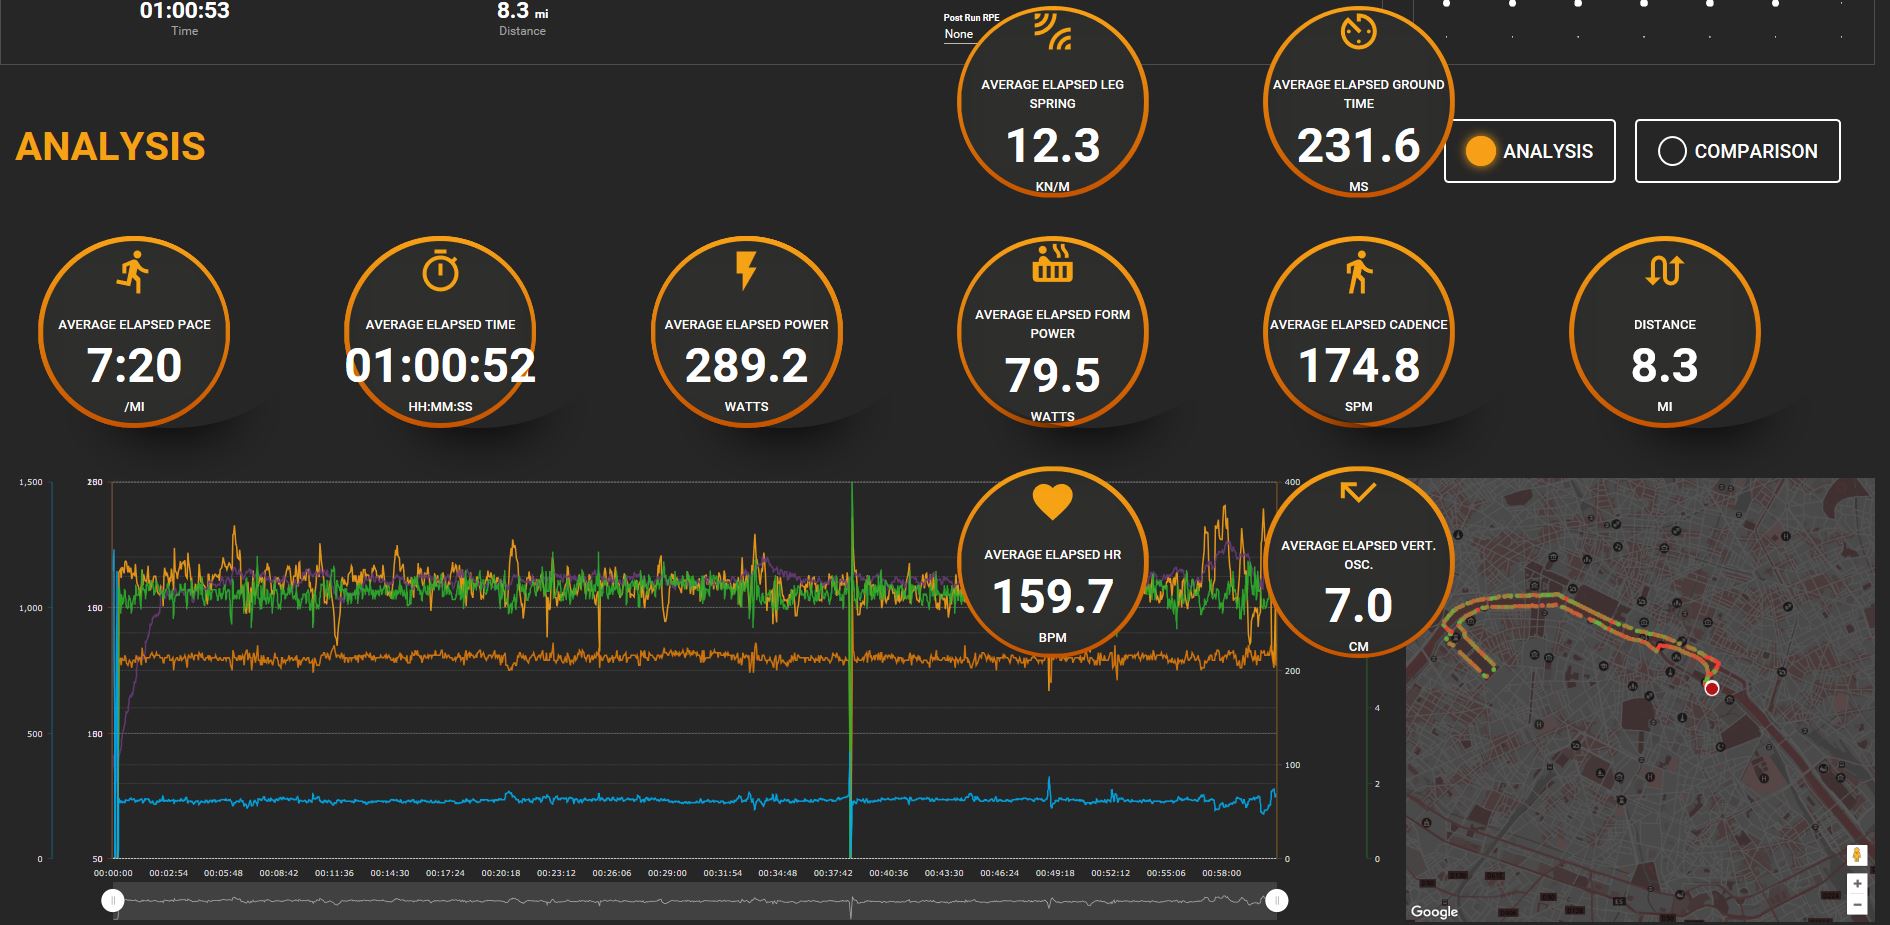
- Stryd Power
-
- Garmin Connect
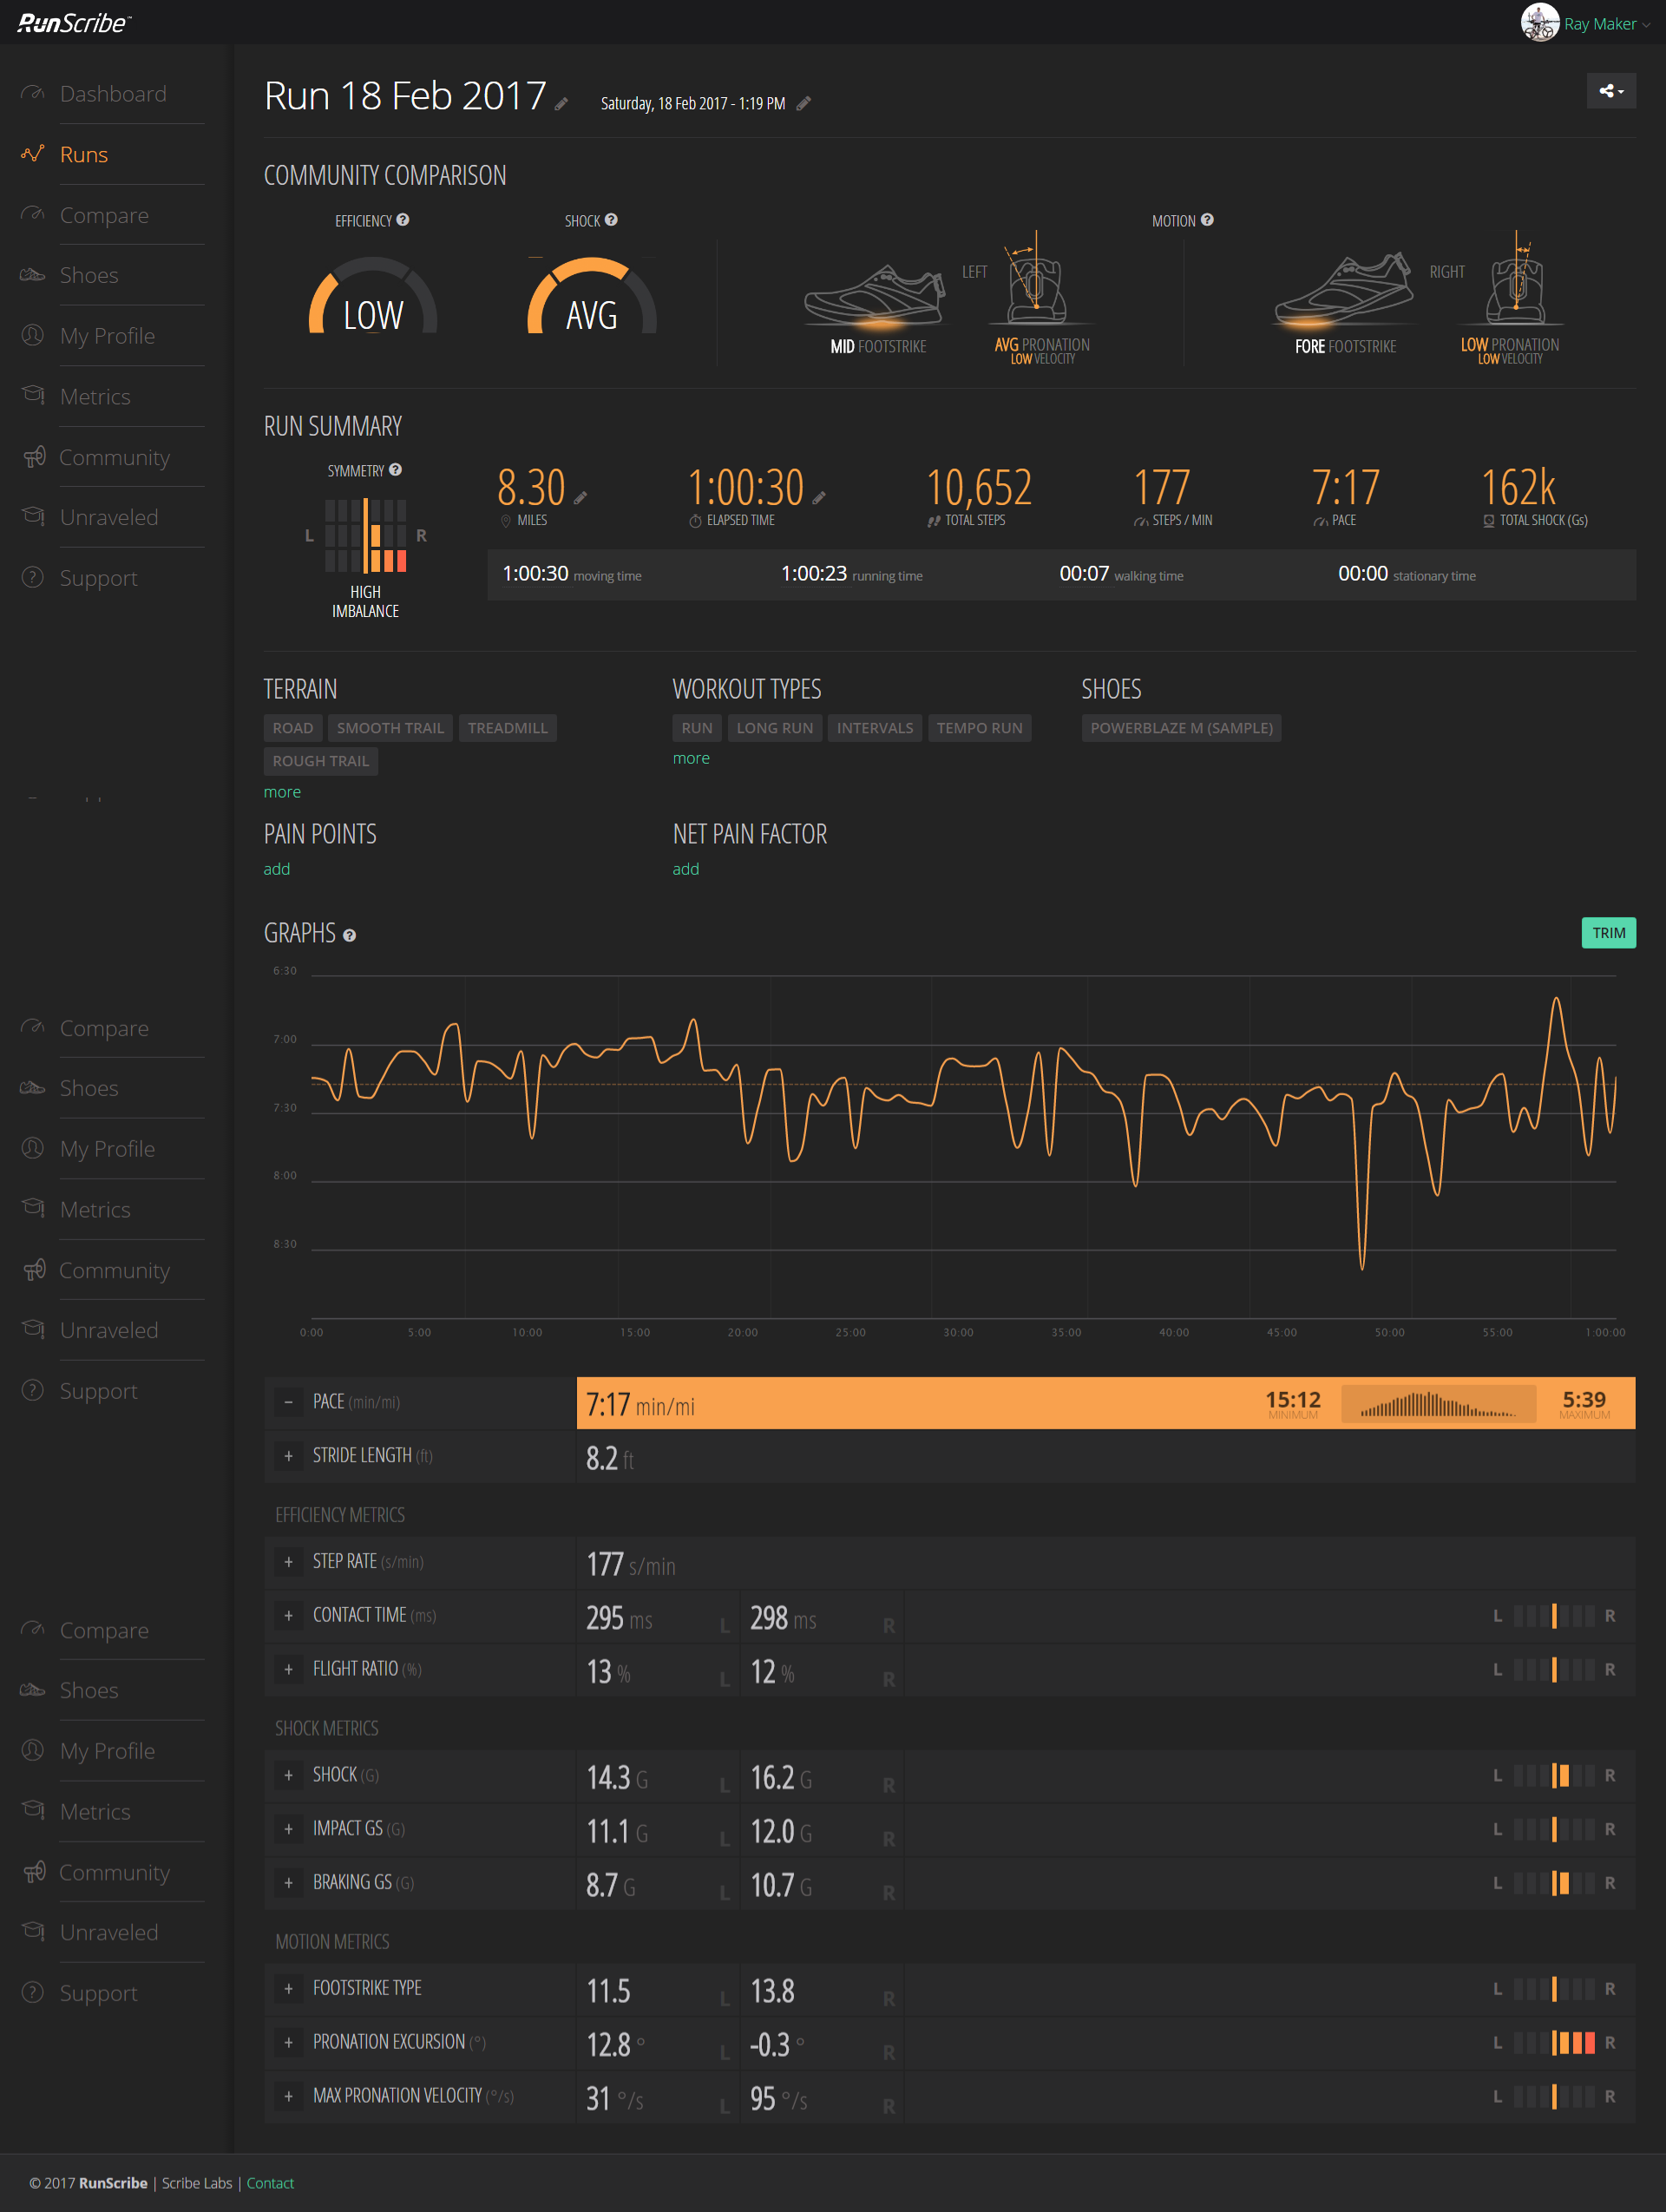
In general, I found that SHFT had the clearest and easiest to understand metrics panel, combining both GPS and pod data in a simple manner. While RunScribe’s data is close behind (albeit sans-GPS). Here are the direct links to each workout, if available:
Garmin Connect
Stryd Power Center
RunScribe Dashboard
SHFT Portal
Kinematix Tune (no shareable link option)
Milestone Pod (no shareable link option)
Ok, with that prettiness out of the way, I decided to try and compare just one single metric: Ground Contact Time. Aside from cadence, it was the lone metric that all the devices had. So next I had to figure out how to export that data.
Oh.
Wait.
That’s not actually possible. Here’s whether each platform supports some sort of CSV/TXT data file for that advanced data portion of the file:
A) Garmin Connect: Sorta, you’d have to manually parse the .FIT file for Running Dynamics data.
B) RunScribe: Sorta. It’s complicated.
C) SHFT: Exports only GPS track and cadence data, not running metrics.
D) Stryd: Sorta, you have to parse the .FIT file – same as Garmin
E) Kinematix: No export available (on phone only)
F) Milestone Pod: No per-second detailed export available (only summary/total data at the 1-minute level)
So then…well…crap. Nobody above provides a simple ‘Export CSV’ option for this data. Now I realize the irony of this, because I routinely talk about the fact that in fitness data, publishing CSV/TXT files isn’t useful. Instead you want .FIT or .TCX files for integration purposes – which is exactly what these companies did. Unfortunately, in this case, all those advanced metrics aren’t easily consumed into any 3rd party application as-is. They would require additional coding. So while it seems year after year of pounding I won the war on getting companies to adopt standards, I appear to have lost this specific battle on making this advanced data comparable.
Nonetheless, let’s back up and compare that average data per run, and see how it differs between the units. I went ahead and manually pulled together the most common metrics for each device into the ‘top-line’ stats.

(Side note: I have no idea why the Milestone pod is so far off on distance, up until this run I’ve seen it no more than 1-2% of GPS distance. Also, for Kinematix and SHFT they use the phone’s GPS for distance.)
Now some platforms make it easier than others to compare the data more visually. For example, with Garmin Connect, I was capturing both the Garmin Running Dynamics (HRM-TRI) data side by side with the Stryd data on the same exact Fenix watch (using Connect IQ). And these days Garmin Connect plots that nicely on the same charts. Even better is that I can drag across the entire timeline and see like data points. So here’s the vertical oscillation at one totally random point:

So above we see that with the HRM-TRI it shows 10.4cm, whereas the Stryd shows 7.50cm. Let’s pick another random point:

Here you see it 9.2cm for Garmin, and 7.00cm for Stryd. Roughly a 2-3cm difference across the board when I drag to most places on the plot (you can drag around here too).
Let’s pick Ground Contact Time now:

You’ll see above it differs by about 22ms. So then I purposefully picked the biggest ‘spike’ I could find on the chart, to see if it would spike on both. And sure enough, it did:

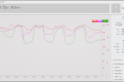
Well that’s positive – at least it’s spiking in the same place. So let’s look at the zoomed in chart on RunScribe and see if I can find the exact same point (48:56) and if there’s a spike there:

Sorta? It’s a bit trickier with RunScribe because there is no start button on the device, so it’s automatically based on a trigger of me starting to run. So in the above case, at exactly 58:56, it starts to climb, but it doesn’t really spike for another 15 seconds. Prior to that, it spikes significantly, but that was some 30 seconds earlier. So it’s possible, but it’s hard to know for certain because there’s no time alignment possible here without a start button.
Let’s look at SHFT then (zoomed in). For that, I start the app on the phone, and then stash it. So we’re looking at a couple of seconds difference likely with lag.

We do see a spike there in that region – but not unlike any of the other umpteen million spikes along the same run. Nothing like we saw with Garmin and Stryd as the biggest spike in the entire run. Further, all of SHFT’s values were well above even the highest of Garmin/Stryd’s values. In fact, for SHFT, it was more or less like any other minute except a spike at 37 minutes:

And looking back across the run, the same was true with RunScribe – it was just the norm with its highest spike at the 20-minute marker:

Now the above points show more than just differences with absolute numbers, but they show distinct differences with comparative data. Is it because they were measured in different spots (though the pods weren’t)? Or are companies averaging differently? Or are they smoothing differently? Perhaps all of the above.
But if we used that same fuzzy-logic when evaluating accuracy of heart rate (BPM) or power meters (watts), or even running pace itself – we’d be laughed out of the room. Results should be accurate, precise, and transferable between platforms without regard for the originating device.
Some will say:
“As long as it’s consistent, that’s all that matters.”
No.
No.
No.
It’s not all that matters.
First, it’s not consistent between the devices. Some see events that others don’t. And some exaggerate those moments (rightly or wrongly) more than others. For example, in the case of GCT above, a ‘spike’ for Garmin was approximately 47ms off run average (299ms vs 252ms). Yet for SHFT, it was 76ms above it’s baseline of 350ms (to 416ms). In the case of Stryd, it was 231ms (avg) vs 284ms (max). At first you’d say that’s numerically consistent (about 16% jump for Garmin and SHFT, and a 21% jump for Stryd).
Except one problem…they happened at different points of the run. They didn’t occur at the same point. So where one unit thought I was running along steady, the other thought it was a spike.
But let’s pretend they were consistent.
I still argue…no…no…no.
Because eventually you’re going to move on to another device. The lifespan of these devices here is realistically 2-3 years. For some folks, they might last a year or two, and for others 3-4. But sooner rather than later, they’ll die.
And then what? Do you throw out all your trending data? That’d be like throwing away all your running race PR’s because you found out every course you ever ran was mis-measured.
So what is it good for?

So at this point you may be saying “Well then, let’s just toss this stuff in the river and move on!”.
And perhaps that’s true. A large part of what I’ve argued for over the past few years is for companies like Garmin, Stryd, and others to actually partner with universities for longer term studies to prove that both trying to change running form with this data and actually changing it works. There are hundreds of studies that show how efficient elite runners are compared to us ‘normals’. But what virtually every study lacks is how to get from point A to point B. Causation vs correlation.
And to Stryd’s credit, as well as RunScribe, they have done a lot of work in publishing data on the peripheral of that. Not necessarily how to get from point A to point B or proving one can change their biomechanics, but at least sharing the data with the scientific community and having some of the fruit of that sharing being published. Which is somewhat ironic given that Garmin has likely hundreds of thousands times more data/runs than either of these two companies combined, but to my knowledge hasn’t published anything to prove how to use the metrics.
To that extent – there’s nothing wrong with gathering data for the assumption that some day we’ll see a scientifically backed book published on running metrics. Nor is there anything wrong with gathering data for the greater good. And finally, there’s nothing wrong with trying to figure our yourself what those trends are exactly. But from a coaching standpoint, today, it’d be extremely difficult for any coach to use data from different athletes on different devices and have much trust in it. As shown above, it’s just a crapshoot.
But – if you’ve got some insights into your running efficiency data experiences – feel free to drop them below. Perhaps collectively we’ll solve this riddle.


Great article, I am a scientist myself and it is infuriating to see all the additional metrics being sold without proper testing and rigorous scientific backing.
In many ways reminds of the withing scales which measure quality of air in the bathroom and heart rate while standing for no reason, features for a features sake…
I completely agree with that comment – feature for feature’s sake.
It really has become the norm that each generation of watch rolls out another pile of ‘features’ without any explanation as to the purpose of that ‘feature’. It’s becoming an exercise of quantity of quality, and I think Ray’s experience above begins to dig a little into what the level of quality we’re dealing with.
I’d prefer a smaller set of dependable data information which I can use confidently to improve my running.
Heck, on a track session last week, my FR630 measured a total distance of 4.1 miles compared to TomTom measuring 3.7 – neither distance was correct (it was 15 laps in lane 3 of a track) and this is a measurement which ought to compare closely (I realise that a track isn’t the easiest thing to work with for GPS). But if there can be such variation on something so common, how much credence can you give for the data you can’t see so easily (at least unless you do what Ray does and run with multiple devices and crunch the data).
Interestingly they really were not that far off. Since if it was a properly designed 400m track then 15x around in lane 3 equals 3.87miles.
Was it Tom Tom left wrist, 630 right wrist? Common for GPS devices to over measure a bit on the right wrist on a track.
how long have you used Milestone? – have found major non record issues. always told new firmware will fix.
Since December. All of my runs have been recorded properly. I’m on the ‘beta’ firmware though. Not sure if you’re on a different firmware or not.
I just bought the Milestone after hearing about it on the podcast. I too am having non-record issues.
Have been using mine for a few weeks now. On all but one of my runs it shows a distance pretty close to what my GPs-watch tell me, without any calibration.
The one exception was a trail run where i did multiple short hillclimbs. I guess the shorter strides on those climbs made for a different distance.
The one thing I do find frustrating is that not all runs could be transferred using my day-to-day phone. For some reason some syncs will end with an error. I have had contact with the Milestone helpdesk. They are looking into this and suggested that in the meantime I should try to sync on a different phone.
I’d argue that most all sports metrics devices suffer from this feature creep.
Reminds me of the megapixel race of digital cameras.
I’ve been using successive generations of Garmin watches since the first gen 301.
Most of the metrics, including heart rate, don’t provide actionable data for the non-elite with coach athlete, or at least questionable value.
That said, if you find a metric motivational to keep you moving, or moving longer than normal, then it’s generally worth it.
I briefly used the foot pod to change my biomechanics and cadence, when I was relatively new to endurance running.
I did seem to get faster as a result, and suffer fewer running-related ailments.
But then again, I have no idea how much of this was just do to increased workload, vs trying to change my form.
Bottom line:
At this stage, metrics are only good for most consumers as a basic comparison of improvement, and potentially as a motivator.
I’d much rather see good execution of a multi-function smart watch than feature creep that leads back to a bulbous wrist computer with poor battery life and a short product life cycle.
Hi,
Great article. But looking at it from the angle of need in stead of offering: What do these metrics (supposedly) mean? Or in other words which metrics should one focus on?
Increase cadence, lower ground contact time and lengthen stride. If that is all a basic foodpod seems sufficient…
Would love to hear your thoughts.
“That said, if you find a metric motivational to keep you moving, or moving longer than normal, then it’s generally worth it.”
I couldn’t agree more – a very important point that regularly gets overlooked.
Why I like MilestonePod. Low upfront investment. I think there is universal consensus you get faster through increased cadence and improved leg swing (kick). Those 2 alone make the purchase worthwhile. All the rest – interesting (I think) but agree need better research on causation vs correlation.
There’s some consensus that cadence increases with spread but that’s about it. Nothing about an ideal cadence or that improving cadence will make you faster.
I use the garmin hrm run and the RunScribes. The strap is always lower GCT wise, but is fairly consistent with the L/R balance to the pods. I have mine heel mounted not sure how that would factor in to your measurements. I like the runscribes mainly for the foot strike, and the ability to easily jot down issues I have during the run, by selecting pain points in the app. I’ve been able to pick up issues by comparing runs, and have been able to move from a very predominant heel striker to a mid foot over the course of the last 2 months. Having a number to back up what I thought I was doing let me put a picture on it, so I could try and change it. Most of the other stuff isn’t useful to me currently, but it might be as I learn more.
Interesting take-down of the measurements of running dynamics. One less factor to take into account when getting a pulse watch. Is it the same inconsistency in the measurement of Lactate threshold?
It is a bit variable, in part because even aspects like where you measure it will have quite an effect.
Ironically, I actually wrote the majority of a ‘Riddle Me This’ like this, but on HRV data, but just happened to do this one first after this weekend’s stuff.
Thanks! I’m considering a FR 735xt partly because of the lactate threshold feature. I don’t take it too seriously, but it could be fun to play with. The price is getting competitive and it’s soon time to replace my Polar RC3 GPS. The straps are wearing out.
Funny you should mention measuring lactate threshold. Even the devices designed for blood sampling of lactate suffer from these same kinds of errors and inconsistencies. They have a single function and aren’t the end all, be all and aren’t consistent between brands. These watches and devices are even more like a jack of all trades, master of none. link to ncbi.nlm.nih.gov
Just as a minor point of clarification (mostly because I slightly misread your question).
If we’re talking LTHR as a pace value (i.e. defining a value like 6:50/mile), then I actually find that the Garmin’s LTHR values (after a few runs of stabilizing) tend to match what I got from BSX and their sensor, which in turn tend to match what I’d say is a reasonable value for me at the time.
If we’re talking comparing various LT device data points second by second for stuff like Muscle Oxygenation (i.e. BSX/Moxy), then that’s where the variability is much higher.
I’m very interested on what you will say about HRV, since I just found an article of trizone where Daniel Plews and Paul Larsen (two rather famous tri-coaches) mention their (heavy) usage of it. Unfortunately, they just quickly mention it and don’t dig into any details.
The really short version: Holy balls nobody matches each other.
*Specifically referring to the data collection side – i.e. using a Garmin strap vs a Polar strap vs a Wahoo Strap vs even two different Garmin straps.
well… damn. looking forward to your review!
(more specifically the differences in between same-brand straps (e.g. Garmin HRM-TRI vs HRM-Run), so if there’s any data “intepretation” in the broadest sense going on (e.g. smoothening, sensitivity of the strap etc
But I don’t want you to post your whole “riddle-me this” post here.)
Thanks for the reply!
For reasons that I can’t remember (multiple web searches over the course of a couple of weeks) I had selected the Android App Elite HRV to check my values in the morning. In general I found that the ‘score’ did seem to reflect my recent stress (airline flights, running at ‘maximum’ for me the previous day and unexpectedly getting 1-2 days notice about a coming cold).
I am writing this to ask you to include Apps not just watches if you are doing a HRV testing protocol. Thanks for all your reviews.
where is Runteq Zoi?
I don’t have a unit, though I noted it earlier on in the post.
I’ve noted a strong correlation of overall fatigue with stride frequency on recovery/easy runs. So it could be useful for beginners who have difficulty assessing their freshness.
Other metrics… blah… anyway, how can a footpod measure the vertical oscillation of the centre of gravity of the body?
It’s not easy to tell from your pictures, but are you certain the pods weren’t touching during your runs? These units rely on accelerometers and if they hit each other, the data will get skewed. At least this may explain spikes in different places. However, it won’t explain all the differences.
I tried the Stryd chest strap version last year and use the Garmin HRM strap daily. I find them useful for trending only, and the impacts when I make small changes in my form, not final values. The power metric is the one that worries me the most. It sure does sound nice, and I see people jumping on board, but when you look closely and understand the technology and what is actually being measured, you’ll find there are big holes in trying to measure power this way. Again, possibly for short term trending only.
BTW: If I found out the courses I ran before were all off, I’d start with a clean slate and have to redo all my PRs.
@martin. runscribe was prob worn on the rear. the phot might have been just to look nice (it does). I had possibility of shft chest pod banging my hrm-tri pod
FWIW: fellrnr highly recommends the milestonepod (amazon have run out)
consistency: what about machine level variation? swapping a 2 year old pair of vectors for a new one may well not give ‘consistent’ results. Then what about your historic data? does everyone really look way back at their historical data? I admit, I DO but only VERY VERY RARELY .. eg after 2 years of training I hope my FTP was moving in the right direction. I guess with GCT there could be an argument here for real longterm historic data…maybe…perhaps.
The pods don’t touch once my foot is within the shoe. Taking pictures sans-foot condenses them a bit, but once I slip my foot in then everything stays apart due to being pushed outwards.
I’ll toy around with the Milestone going up a bit, though aside from this distance oddity, I haven’t seen any other distance issues once calibrated.
Generally with power meters, assuming one does a zero offset accordingly, things stay very solid. It’s a main reason why many push for static calibration options – as it ensures that the device is repeatable long-term (i.e. even 5 or 10 years later).
I think when it comes to historics, it’s more around trending. For example, in power or HR or pace you see ‘bests’ such as FTP or mean/max numbers. With some of these metrics that may not make sense (and that’s fine), but if/when some companies push that something like GCT is best if lower, then that’s effectively arguing for a PR-style dashboard.
Ray,
Milestone says this about the positioning of the pod:
‘Ensure that your Pod is placed in the most ideal position for accuracy: about 3/4 of the way down towards your toe. Specifically, if your shoe has a drop of 8mm or above, use the second lace cross from your toe. If your shoe has a drop below 8mm, use the third lace cross from your toe.’
From what I see in your pictures, it might be a bit to much to the front (first lace cross?)
Not sure if you really wore the Milestone on the 1st lace from the bottom, but it recommends (depending on the drop of your shoe) that you wear it on the 2nd or 3rd cross lace from the bottom. I have to calibrate it often for accuracy on the distance but I didn’t buy it for that reason; I bought it for the other metrics like Ground Contact Time. Great for it’s price, IMO.
Your revelations about these devices show you are on the path to enlightenment. Just run, just ride, just swim. Don’t worry about numbers focus on effort. For form find a friend to help not a computer. It’ll be more fun and better for you and the world! Enjoy!
So Ray to me its pretty simple… For the individual, self coached or even coached a single metric like VO or GCT are primarily useful when tracked over a long period of time, same like ftp, hrth, or even Garmin “vo2 max”… Sticking with a stupid little Garmin footpod one can easily see how their stride improves over a couple months if ur goal is to work on it. If you are going out with ur tons of devices (which I love) you’re going to see infrequencies across the board. Its same with power meters on a bike except the data is more closely related in the latter. Running dynamics have ways to come, with tons of different companies competing in the field all the brains behind the infrastructure are dispersed.
There is probably a good reason for these companies for not involving in clinical trials with these gadgets, it is obvious that they are too inconsistent when measuring various metrics. Without a consistency you will loose validity and the variations in measurements would mask potential real differences. These devices have may have a role at the individual level without comparing, for instance, watt between athletes.
Interesting… But you’ve chosen a crappy metric, likely because its the only one commonly supported – GCT.
Something like footstrike type I find far more useful – but admit I have no way of validating accuracy and repeatability of the runscribe data.
By chance I was actually working on dhcp lease logic today! In the context of supporting dhcp over layer 2 within an EoGRE tunnel for wifi traffic. I’m not into the riddle me depths tho!!
“And then what? Do you throw out all your trending data? That’d be like throwing away all your running race PR’s because you found out every course you ever ran was mis-measured.”
It’s certainly annoying, but i don’t think it makes the measured trends utterly useless.
A few months ago I got a power2max installed & found a 30W delta between it & the Kickr I’d been using to measure my FTP for the previous year. The gains from raising my FTP were still there, it was just the absolute value that was wonky.
So whilst I’m not sure I believe the power reported by the Stryd footpod, it is a useful way to record relative difficulty of a run for TSS calculation as incline & pace get somewhat merged into a single metric. That’s trackable over time & whilst it might be 30W’s off real there’s nothing I know of that’s more accurate…
Totally agree! And most gadgets you’re going to keep for a minimum of a couple of years, so within that time you’re going to get some good trend info.
Thanks for another great article Ray!
Apart from HOW the metrics are measured, what about the opposite – do you have (or know of) a “Primer” on what the heck all of the metrics actually MEAN?
FWIW, I recently got a Wahoo Tickr, which is great – but what is stuff like “smoothness,” “Left-Right,” etc., what are they telling me? Is a higher/lower score better or worse? How do I improve? I’m guessing a low “Ground Contact” time is better than a high one (everything else being equal), but what should I be doing about “Oscillation”?
I set it for Audible prompts for HR Zone and Cadence – the two that I understand!
TIA!
Cheers,
Tim
Great article as usual. But I have a slightly different view on this topic. Been using the HRM Run since its release. Using the oscillation and cadence metrics, I have significantly improved my running style. Back in 2013 I used to run with 11cm VO and 160 cadence. Did a bunch of drills and really focused on a few things on each run. Today, I am at 180 cadence and 9.5 VO. Running has never felt better before. So, that’s a small victory. Also, I can always tell that I need a rest day when my running metrics are off – low cadence, high oscillation. My best performances happen when cadence is high and oscillation is low. GCT is a different topic. I find that it’s mostly dependent on speed.
Last year I started with Stryd. While the metrics don’t really match, I really enjoy having power when doing intervals on the track or when running hills . GPS speed is useless in those situations and Stryd power has been super consistent for me. I manage to nail lap times over and over again. But at the end of the day, it’s all good fun. As a traveling exec with a running & biking addiction, all this data is fun to play with. And the data has motivated me to improve things.
Good to change your cadence so much – that is difficult. Out of interest has this actually made you faster though? And of course fitness will vary anyway with training load – however you run.
Congratulations.
But you don’t need advanced metrics to achieve this.
If you throw two things in the air, one of them not as high as the other one, it will return to the ground quicker. That means if you increase cadence you will also reduce vo and vice versa. It’s just physics.
It makes sense to do this. It will save energy because energy grows quadratic with high gain but only linear with cadence. It will also put less strain on your joints.
But you don’t need anything new. Foot pods that measure cadence have been around for many years. I think they were available even before GPS. It’s also common in cycling computers for a long time…
Keep going!
Good question. The honest answer is: Maybe. My lap times and tempo pace has improved a bit over the years and feels easier. But most importantly I have been able to run injury free for a number of years.
I believe the Stryd pod should be as close to the toes as possible, and it should be securely fastened (not wiggle in any way).
If you wore it as in the picture, I am surprised you got such accurate results. If anything, that particular device is very sensitive to positioning and security of attachment.
No wiggle on my Stryd unit once my foot is in shoe.
I haven’t seen appreciable difference for my running style/etc in putting Stryd in a few different places on the shoe (or different shoes). Still, I think that speaks a bit to some concerns I have on accuracy, my bigger concern there is differences I’ve seen between chest strap and footpod.
I put one Stryd at “top” of my laces (nearest toes) and another at opposite end on other foot. Power was more or less the same but the “foot pod” pace was markedly different – 500 metres over a half marathon – enough difference for one auto calibration to be more or less the default 100 and the other about 97.5. At least it showed their power calculations appear to be more sophisticated than just a function of pace!
So perhaps in my little rowing world we are lucky that there really is just one manufacturer for each type of device. There is NK for on-the-water metrics and Concept2 for the indoor rowing metrics. We see a couple of new kids on the block and we haven’t even agreed on which metrics we are supposed to look at, besides from the obvious cadence, power, pace and heart rate.
This was a great blog post. I really liked reading it and I fully agree on your points on partnering with the Academic world to start to make sense of the data. For rowing there is some hope, because the distance between elite and normal human beings is not so big. It’s a small community.
I last rowed competitively in 1983 so I’m way out date on rowing tech. When I finally retire and buy the sculling boat I have promised myself, I have a lot of catching up to do!
Finally new shoes. Funny, since I also replaced the blue by the yellow.
Been using Stryd footpod and Garmin HRM run for a while now. GCT is consistently lower on my HRM run than the footpod. Also Vert Osc is also consistently higher on my HRM run than the stryd. This though I put down to the chest strap placement being further away from the ground meaning increased movement in my upper body. One other thing i noticed is that there seems to be a slight delay, sometimes up to 10 seconds in data being transferred or recorded from stryd to the Garmin. Maybe it’s an iq connect thing?
When made some enquiries about GCT variability that was one of the reasons cited – measuring at the chest and from the foot is not necessarily a like for like comparison. Just looking at my HRM-Tri GCT and that from the Stryd foot pod from my run today I see a reasonable correlation but an offset with higher values from the Stryd. Similar the other day when did some intervals, my VO is also a lot higher on the HRM-Tri (same as HRM-Run) than the Stryd. Then again the HR strap is a lot higher to start with! So we seem to be seeing the same things…
I use the Milestonepod for some time. It is possible to export details per run, with totals per minute. From the run log you can either delete or export a single run.
Interesting, I didn’t see that option – only summary. Though, even per-minute is just not granular enough for what we need here unfortunately. Which is funny, because I’m just not sure who would want per-minute level details of something like a 60-minute run. Would seem to be a whole lot less work to just give second by second data.
Hi Erik,
can you tell me how to find this option in the App?
Well, I’m glad I have only bought the Milestone for $22 as it appears you say none of them are worth a **it. Although, the Milestone is well worth $22 as it tracks cadence, is a bluetooth pod, tracks mileage, and shoe life. I think milestone is worth it for just a bluetooth footpod but the other is icing on the cake. I don’t intend to pay much attention to the other metrics.
P.S. I curious, Ray. Do you ever long for the days prior to the 305 when you just strapped on a trusty Ironman Timex and went for a run? Then, after the run you jumped in your car to measure the distance while swinging by Sonic for a Cherry Limeade. The important metrics those days were, time, distance, did I feel good, did something hurt, and was that blond really waving at me.
I long for the days before I even got a Polar HRM in the mid 90s as the fact that I was in my 20s not my 50s was the major reason I was way faster then than now despite an armoury of gadgetry at my disposal these days! And then every “easy” run was 6:00 min/mile pace (at least) even it it wasn’t! Mind you would be interesting to put these gadgets on my younger self to see what’s changed over the years. That said off to see if I can find some cadence data from 10 years ago when I first started wearing foot pods now and again…
I longed for the days a Sonic would be built near me. Regrettably, it wasn’t.
Hi Ray,
Thanks for the great info as always.
Any reason why the Lumo was not included in this roundup? I have one and am curious what you think of the final product.
No reason it was excluded other than I ran out the door and forgot it on the table.
I use the Runscribes and have found a couple of items worthwhile.
1. I had an imbalance between left and right. Went to a therapist and got better range of motion on my left side and now I don’t show the imbalance. Caused me to speed up about 5% due to left side now carrying its weight.
2. Shoe Selection. I have tried various neutral shoes and felt like a few were best for me. The data from the runscribes confirm that my efficiency is higher in the better shoes and one pair of shoes that I was having difficulty with actually has me heel striking.
Great, honest, independent report. Respect. A pleasure to read. Thanks Ray.
People usually think they need to increase their cadence but having been monitoring mine tend to think it is a bit high and might be swopping faster cadence for lack of flexibility. Indeed with a current left Achilles injury have been tracking this by very “unbalanced” Ground Contact Time Balance in the first few miles (see link to connect.garmin.com where took me 10 mins today to get my sore left Achilles loose enough to get “even” and want to put full weight through it). In fact this is so obviously “bad” that have agreed with my physio to stop for running for a bit to try and shake it off. So some of these metrics do tell a tale if you look for them.
That said, I did look at the cadence on Strava of the leading runners in some reasonably good standard races been in recently. To my surprise literally “anything goes”. One leading runner was as low as low 160s and another up past 200s with people in the 170s, 180s and 190s. Of course if you average all these you get the “magic” 180.
Spot on. Cadence varies a lot, and 180 is only an average for good runners.
There are a lot of problems with studying running economy, and the accuracy of these toys is the least of them. Perhaps the biggest is that any intentional form manipulation typically leads to reduced economy in the short term. Which makes sense. People have figured out their own stride over millions of repetitions. Neural pathways have developed to facilitate that particular stride. It doesn’t necessarily mean it’s the best stride for the individual, but any changes have to be given lots and lots of time before they could ever be skillfully implemented. It’s sort of like getting a new swing in golf. A six week study with 30 individuals isn’t going to cut it.
My rule is always to look to what the best athletes in the world are doing. They’re always light years ahead of the science, which typically comes around after the fact to explain why something works, after everyone has figured out that it does. So do elites mess with their form? By and large, no. Some do form drills, some lift weights, and most do sprints and hills, but conscious, intentional manipulation of form is very unusual for high level runners.
I will say that the one good use case I’ve found for Garmin’s running dynamics is to look at the onset of exhaustion during a race or workout. Sometimes you can pinpoint a moment when your form starts to radically change, even though your speed isn’t. It means you’re approaching your limit, and your body is trying to figure out some kind of way to maintain. If I notice it in the data, I’ll flag a workout or race as a particularly hard effort in my log. Sometimes I think it’s more reliable than my own subjective perception after the fact. It’s definitely more reliable that heart rate (which is always through the roof in any of these efforts).
Ray, I think you are right that running efficiency metrics are a bit overhyped. But I wouldn’t discount the main benefit: measuring power.
I have only run with Stryd, but it’s reliable enough across the curve that I am able to pair it with Xert and design intervals that predict failure points precisely, letting me know exactly how fast and how far to go and how much rest to take. It’s uncanny how well it works, and only will get better as their platform adapts more from cycling to running.
I respectfully suggest this is the real point and value of these devices: not running efficiency, but more effective training.
I think I agree with you, but that may be confirmation bias, given I’ve bought a Stryd and might want to justify my spend. Which means I’d disagree with Ray’s demand for long term comparability of the metrics that are produced. (At least for power – most of the other running dynamics always felt like vanity metrics for 90% of use cases)
If the value of power meters for running is that we get better TSS measurement, is that something that’s been confirmed by comparing TSS computed from lactate threshold vs critical power? I’m assuming this is a question already answered for cyclists but haven’t found anything in the literature
I’m sorry – but I just dont get Stryd running power. I’ve just done an 18 mile long run in a significant storm – rain, wind, the full works (loved it, but thats another story!). If I understand correctly, Stryd cant compensate for wind ? If that’s right, it would be useless in 99% of my runs as they are outside and its rarely still enough to discount wind as a factor. As for other running metrics such as footsrike type, they are generally a direct measure of something and so are impacted by all factors including wind etc.
A quote from DC last year: “it doesn’t yet account for wind unfortunately”
There was a q&A on the stryd site last year in which Stryd told the same but i can’t find it anymore.
This was the only reason for not buying this unit.
They may have found a way to “fool” some measurements so it looks if they measure it but that would always be an estimate. I have seen a lot , and worked with a lot of sensors but with this pod i can’t see a way how they could ever measure it.
Yep – as I thought. It never going to mean much to me when a device is measuring loads of things in order to try to estimate another. Its like having a peep out of the window to try to see how warm it is. Is there snow on the ground, is it raining, does it look ‘nice’ ? Meaningless really – you need a thermometer ! Same with these power meters – I can see the benefit of something in the sole of the shoe (or somewhere else) to directly measure a force, but an indirect measure would never be good enough for me.
Ray, Thanks for this post.
I have been thinking about a food pod with additional metrics for the last 9 months or so, mainly RunScribe or RunTeq (later also SHFT). Whats kept me off from buying any has always been the data, or rather usability of the data. RunScribe has lots of data, but so far I have seen very very little showing how to actually use the data, or hov to make changes. As you say, there exist very little research on this – actually, does any published, peer-reviewed papers exist even on ideal cadence?
In the other end from RunScribe is RunTeq, with coached trainings, and I believe SHFT is similar in that way. This is what i would be most interested in since it actually connect the numbers with action. Unfortunately the link between the numbers and the action is weak so the end result might very well be the same as for RunScribe, or worse if the exercices RunTeq suggest actually makes things worse.
In my case I am now at the end of recovering from surgery of a ruptured appendix and 40 days in hospital so unbalance in the hips and legs are closer to fact than a possibility and I had hoped that there would be some pod that might keep me from adapting bad running habits.
In the end I got a Polar Pod, its big, ugly and clumsy but it got replacable batteries and at least it give me instant pace and distance when the reception is bad and on treadmills. For me Polar is like a Volvo (Im Swedish). Boring, but reliable and I got to stay in the same ecosystem so when travelling I can just use the footpod and Polar Beat app on the treadmill in a hotel if I don’t bring the watch.
Still, if there had been more connection to research, I would have loved the RunTeq from all i seen in the apps and interfaces. Also somewhat missing form a balance point of view that its not one pod on each shoe since thats where my main worry lies.
So, all I have is Garmin running dynamics. Mostly, I have not found a use for the data, except… About 18 months ago, I developed some running-generated tendinitis. The location suggested that landing midfoot or fore foot would help, compared to my heel-striking form at the time. And, with that, a quicker cadence might help prevent reinjury. So, I started running on my forefoot. Calves? On FIRE. Eventually, faster cadence, forefoot strike. Not a whole lot faster overall, but no sign of recurrence of my tendon problem. Could I have tracked cadence with a watch and counting? Sure. Did the Garmin do it for me while I was concentrating on form and not getting run over by traffic? Yup. Running dynamics were useful in this circumstance b/c I was comparing yesterday to tomorrow, not across devices. Like some others here, I’m also a scientist (engineer, actually) and agree that – in general – these measures are not valuable since they are – in general – not actionable. The lack of consistent data across devices is a real concern – thanks, Ray (I think). Running dynamics was something that Santa delivered; I’m not sure that I would have purchased it with my 920xt if I were buying. But I’m pretty cheap (fiscally conservative), so Santa wanted to make sure that I had the *best* HRM for one of the few leisure activities I engage in regularly. Still, when I run, I’m sure to pull on the HRM-Run and not the old school hard HR strap that I’m happy to use for cycling. But why?
Good post, Ray. I was a MS Windows Advanced Server 3.0 alpha tester back in 1990 so can relate to the DHCP inner trappings.
Anyhow, we need to keep in mind that all of this data has a limited use and meaning, depending on its usage and by whom. My wife who does care about anything but getting her half marathon finished before they close the course (time-based goal) would care any less about much of this.
I have used Garmin Run strap since 2014 and dont analyze my data much either. What I really want is something as consistent as a power meter, but also have it be meaningful to running as a PM is for cycling. I have yet to see the product that fulfills that need, tho Stryd comes close. But, its not good enough.
It reminds me of the early days of power meters and cycling. Until a PM came along, we had heart-rate, somewhat reliable GPS and timings to analyze our efforts. PMs changed how we train and race. Heart-rate, speed, and to a degree even cadence took a backseat to our watts being measured on the bike and post ride/race analysis. Eventually PM accuracy and data collection became more and more prolific and accurate, making HR and time/speed metrics pretty much inconsequential to training and racing.
I want the same for running. I want to go out for a run with power goals in mind to hit on the flats, hills, intervals, etc, just like I do on the bike. I want to maximize my time on the road/trail. Until I have the device that can accurately, consistently and meaningfully make that happen, I will just do the best I can with one of these devices, knowing that each is merely a stepping stone until we get to a true running power meter device.
Just my view.
Dennis
Am not clear if you have used a Stryd but, if so, am curious what is not good enough?
With 60 fps cameras readily available it’s feasible to set up a test on a treadmill whereby GCT, vertical oscillation and left/right bias could be investigated…
Dan
That’s exactly what’s done if you go to a proper “runner clinic”, but with a much higher frame rate camera and a pressure-sensitive mat.
Just a small note on the table,
Garmin can tell you the number of steps in an activity. It is just well hidden :)
on the connect site you have to go in the menu on the left to activities (names may be off a little, too lazy to find the setting to change my connect to english) so that you get a list of your activities.
and there is a column named steps (which may not be visible by default, but clicking on an arrow next to the name of another column allows to add it)
otherwise very interesting article.
hans
Funny, I thought I had seen it somewhere before. Nice re-find!
I am not too surprised.
Accurately measuring such dynamics would require carefully and repeatedly calibrating measurement devices which, as far as I understand, is not possible.
It would be interesting to test several samples of the same device. I would not be surprised if they diverged as much…
Pretty sure I spent more time tonight researching DHCP leases than reading about running metrics.
As far as Garmin HRM Run does actually record reliable data (such as optical HRM…, and this is the true point),
I’m glad to know my ground contact is almost perfect 50%/50%, despite a nagging injury that often causes me to land with a poorly balanced stride .
The other parameters are just for fun, so far.
When I’ll be completely healed I’ll try to get a good feedback from them too.
Great Post Ray!
There’s two fundamental issues in measuring and improving performance- 1.) what to measure and 2.) how to measure it accurately. As your article points out, there’s still a lot to be desired with respect to #2 but this should become less of a problem over time. As for #1, I haven’t seen anything definitive showing causation that if you improve X by _% your peformance will improve by _%. There’s simply too many genetic factors and physical variables.
Intellectually, studying causation is much more satisfying than studying correlation, but in practice correlation may be the better method if the data is at a large enough scale. (See this article on Google Translate for AI…its one of the most inspiring tech stories I’ve read over the past 20 years: link to nytimes.com)
It opens up an interesting opportunity for someone to coalesce several hundred thousand athletes and do some controlled studies…
Just a thought – could you extend your analysis software to enable the comparison of any one data stream in the same or different FIT file with another?
link to analyze.dcrainmaker.com was useful when was looking if got different power with a Stryd on left and right foot. My conclusion was that I did not.
Yeah, I was going to circle back and see if we can get some of the developer fields supported for RunScribe and Stryd, since they have .FIT already (which would also take care of Garmin’s Running Dynamics too). That sort of config might then allow a free-form picker of sorts.
Recent builds of Golden Cheetah deal with arbitrary (I think) fit developer fields as “XDATA”. I seem to recall a recent commit that even makes them available to the integrated R environment.
My thought would be that none of the devices are claiming to be scientifically or statistically accurate to the highest known standards. As consumers we expect a certain level of accuracy, since we are paying for the devices, after all. It’s great to see this kind of research work: link to ncbi.nlm.nih.gov . If these devices can be used as one tool in a toolbox to obtain a goal, that’s great. Should an average consumer be deciding what that goal is though? The average person doesn’t have the body movement awareness required to fix every mechanical flaw in their technique. They can’t feel the flaw, even when informed of it. Many can’t change movements (like running) much when cued in person, let alone just from looking at bunch of numbers. And they shouldn’t necessarily always try to make tons of change in either case. But what is the user’s end goal? Run faster, longer, remain injury free? It’s possible to achieve all of those things without these devices. But if the device’s information can be used in a routinely monitored system, especially with the help of a professional interpretation, then it can be worthwhile when compared consistently to itself. If the device is measuring a factor that seems to help when placed in a biofeedback loop, fantastic. Part of that loop may require another set of eyes to help interpret that data. Some people, like myself, are intrigued by the data. If it’s 5% inaccurate, I’m not offended. To live and die by the data misses the point of amateur participation. We have to consider it all with a grain of salt. At a certain level of accuracy we have to ask if the device should actually be capable of collecting the super accurate data that we might be craving. If super accuracy is the requirement then go to a running lab to use a force plate treadmill. But that data then isn’t 100% generalizable to the outdoors – because it’s a treadmill. There’s a reason those treadmills cost several tens of thousands of dollars and these devices are $200 or less.
I certainly wish all devices were within a small margin of errors of each other, but I can understand how unlikely that is to happen, since there is no gold standard that produces reference measurement values.
Then again, I go back to one thing that should be trivial to measure: Weight. And I remember it’s nearly impossible to find 2 bathroom scales that will agree with each other to the 1/10th of a pound.
I have to say that while the metrics might not be consistent or comparable across devices, I still found that the Lumo run metrics helped me greatly imrove my running form and economy. Would not have happened without except spending tons of tine in a running lab. Found stryd or Garmin much less useful. Thanks for zhe overview.
The Information that interests me most is the recovery time and the training effect. So I really hope they use all the sophisticated data to tell me if I put in enough work and better rest a bit more or not. (I guess they don’t)
Leaving the interpretation of data to people like me with limited interested in data mining is not useful.
Great article. Somewhat provocative but not in the Milo Yabadabaduopolus kind of way. To me, it’s kind of like diets. It’s not that South Beach beats Atkins or Paleo or whatever. It’s that if you get folks focusing on something, they tend to improve. Once you focus on what you’re putting in your mouth, you figure out a lot of that is crap. I don’t believe it really matters which device is more “accurate” vis a vis a given metric. The more important thing would be reliability. Does the device give consistent feedback day to day so I can track my progress over time?
Hi Ray,
It would be good to consolidate measurement units… some records are in min/km some are min/mi.
There are differences even on on measured pace, a variety from 06:58 min/mi through 7:20 min/mi up to 7:27 min/mi.
Avg Ground Contact Time has a huge variance, that’s a failure even if the Cadence seems to be consistent to +/- 2 steps.
I would physically measure and verify the Stride Lenght, the 1.25m is more like long jump.
And finally, the Export CSV on GC is corrupted since Sept2016. The option is there, export is working, but the values are fake.
Long jump? What are you talking about.
As long as the pace is about right you can quite simply get stride length if you calculate step rate vs speed. Why would you need to verify it? It’s not a value out of nowhere. I don’t see anything out of the ordinary there.
It’s true the pace readings will also effect this, some of the pods may be less accurate at this than others. Especially if calibration is a bit off.
GCT on other hand is more difficult to calculate without actually measuring it (say with a high speed camera), still I’d say for that pace +/-250ms range rather than over 300.
I also feel that pod placement may have a slight effect. For example I’ve seen the Stryd report some 10ms lower values if worn high up like that.
If all were within 10ms…then honestly this post never would have happened. I have been toying around with different pod placements to see how things might change, and haven’t seen much difference. Obviously, that may vary by person/stride/etc…
As for mixing metric with statute, a large part of that is simply the screenshots and how they present the data. I normalized as best as possible, but different sites display it different ways. On the bright side – this way nobody from either side of the pond gets upset when I use one or the other. ;)
Of course, that some values are calculated and some are directly measured… And it matters, from which value you are calculating what.
I can speak only from Garmin and Connect perspective, but let’s compare Ray’s metrics vs mine.
Conditions were not the same, I did this run at icy, snowy, cold conditions on a rough road in forest in a Salomon trail runners, so I will repeat it under similar conditions like Ray in Paris.
But our height seems to be similar, I am 183cm tall. So the comparison:
Run Cadence:
Ray 176spm, A 173spm
Max cadence:
Ray 256spm, A 182spm
Avg Ground Contact Time:
Ray 252ms, A 260ms
Stride Lenght:
Ray 1.25m, A 1.09m
Ray has a very consistent pace, however very diverse Stride length.
I have a very variable pace, but very consistent Stride length.
And this indicates to measure the Stride length, rather then calculate. To get a real picture… Will do it and post it here once the weather got warmer (with a GC activity nr as well).
Not quite sure what you mean about stride length variability there? The vertical axis on your graph is wider than what comes up for Ray than when I open his GC link so that may give a different impression. Both graphs look fairly normal to me.
It doesn’t actually matter what each step measures exactly, but what they measure as an average for a given distance. It’s granted you can have longer steps and shorter steps, but the net result will still be the same.
Ray has nearly 1min/km faster pace so it’s no wonder his stride has to be longer with a similar stride rate. I can further demonstrate this converting paces to meters/minute:
Ray: 219m
You: 187,5m
Simply divide this with strides per minute, and there you have it, stride length. There’s no way to cheat with this unless you step your foot into another dimension or something. ;)
You are too much focused on pace. And your calculations are related to a completed activity, not to the methodology and accuracy.
I assume, that the accelerometer is calculating the stride length based on the ground contact time and vertical elevation and it’s direction/force changes. But definitely not from distance ran and strides per minute.
And you might noticed, that Ray mentioned the discrepancy on ground contact time was (>10ms). If the ground contact time is not accurate, will affect the calculated values accuracy as well.
If you check his graph on stride length, you see the average 1.25m. But notice the min and max values also. Min. is round 90cm – 1m and the max just under 1.5m.
This means a variance on average +/- 25cm and the difference between max and min about 50cm.
Now, try to maintain equal pace for 10km with a stride variation 50cm. And tell us how it went…
Just the comparison (no matter what the pace was), mine stride length had a variation of +/- 5cm. Used HRM-Tri with 920XT.
Dude, what are you smoking? I just told you the answer but you insist that ground contact time gives a more accurate answer? A measurement that is proven to be very shaky at least by this very test?
And frankly 1.5m is well within human limits, best runners can stride closer to 2m.
Just because you can’t doesn’t mean others can’t. I can’t either, but that’s another story.
He’s right, stride length is simply distance/no. of strides. Pretty easy to check from the average cadence, time and distance. Obviously if the cadence is wrong then it will be wrong but it definitely has nothing to do with ground contact time.
Dear Sportmates,
I am not smoking, neither taking drugs…
What I am trying to explain, is that you all are calculating from known results. Distance/strides.
But all equipment tested here doesn’t have information about distance (except Fenix3 which collected the data or the application in smartphone). Where would it come from?
There might be a timer inside and motion sensor, so values such stride length are calculated. Probably from ground contact time and vertical oscillation and force direction change… Correct me, if I am wrong…
An accelerometer can be used to capture information in all dimensions, with varying success it seems. Anyway distance estimation has been there for some time now, starting from the first foot pods and with calibration it can be quite accurate. Even close to GPS in distance accuracy.
GCT and VO are observational metrics, time your leg spends on ground, how high it goes each step. That sort of thing. You could theoretically register both metrics just by jumping at place. Not much use for calculating stride length then ;)
Hi Ray,
A comment on metric/statute I just recognized…
If somebody who is not a Garmin Connect user (or GC user logged out) is checking a public activity, then the units are displayed based on an activity owner’s unit settings.
Profile –> Settings –> Display Preferences –> Measurement Units
If a logged in GC user is checking other GC user’s public activity, then the units are displayed based on a viewer’s unit settings.
and this is good this way…
Had some spare time during the weekend to look closer at the graphs. Well at least the ones that provide a direct link to website.
To me it seems that at least Garmin, Stryd and Runscribe seem to agree most of the time. I.e. that the shape of the graph is similar. Runscribe seems to add a lot more smoothing, so where there are big spikes for others only a small bump for Runsribe. But at least I could find them in the same places.
As for SHFT.. It seems it’s all over the place. I didn’t even bother to find links to other graphs. The data resolution of the graph is horrible not to mention even the averages are miles apart from anyone elses. It’s a shame as seems they’ve actually put most effort in presenting the data with advice and all…
Another question is, whether a metric like GCT is any useful. It basically just tells you how long your feet touch the ground. Same goes for VO. You don’t really do much with the information. VO doesn’t tell you much about efficiency until you add forward movement, and as such I think vertical ratio that Garmin presents on their own site is probably much more useful indicator of efficiency. Yet GCT and VO are the only “advanced” metrics that are currently supported by any of the other sites (spottracks for example).
Still getting back to GCT as a measured value, would seem to me there is at least some ground truth between some of the devices and I guess the best practice is to use the data in context, and hope you get at least repeatable results from the same device…
Perhaps the only way to overcome this would be some sort of calibration to improve the consistency of data between different devices/users? You actually have to do this to get best results for distance (even for Stryd), why not for other data? The problem with calibration is that applying it accurately depends on user. So creating applications for this would be practically a nightmare. Imagine instructions for measuring every cm of your shoe, not to mention different running styles and other possible things affecting this. For example Stryd with their latest state of the art accelerometer have tried to improve their distance accuracy and aim for calibrationless technology, yet a small calibration factor is still needed on watch side even after the latest firmware to get the best results. This creates a fair bit of confusion among new users.
Having said that, I’m still quite impressed with my Stryd. The data seems accurate and repeatable at least against itself and I can get stable and fast reacting pace with a bit help from calibration. I feel it’s probably one of the best, if not the best, running sensors around currently. :)
Guess why garmin didn’t publish a thing …
Still no idea ?
They are warning customers on the non causation relation in the damn notice they provide with it.
They know that it’s not because you increase your cadence/efficiency that you run faster IT’S THE OPPOSITE. Just put those device to a variable speed VMA test and dive into the data, just like many people already did. And there are your answers.
Once again struck in the “effet réverbère”…
Inspired by Ray and some of the comments here, I can add a few thoughts for what it’s worth. My own background is in motorsports where data acquisition and suspension telemetry have long been used to improve a car’s handling characteristics and reduce lap times. This field also went through a long period of ‘features for features sake’ and subsequent ‘paralysis by analysis’… which still lingers today but in general, after 20 years, specialists have a better grip of the data and know how to use it with positive results.
The guys at Stryd were kind enough to meet with me a few weeks ago when I was in Boulder and I gained a much better understanding of their project and where it stands. It shouldn’t be lost in the details that Stryd is first and foremost a power meter, which only one other device in the article claims to also be… so you get watts. It’s very impressive the amount of work and detail the Stryd guys have put into getting this right.
So the first and most obvious plausible benefit here that I see (IF an athlete has tested their critical/threshold running power properly AND they are using TSS in TrainingPeaks to plan their training) is that the athlete can plausibly get a more accurate power-based TSS as opposed to pace or heart rate derived figures. So this could be a legitimate and usable feature right out of the box.
Second – regarding the riddle in question – the Stryd guys are working on a methodology to distill their voluminous data into a simpler running efficiency metric that actually adjusts for pace and doesn’t simply state the obvious that an Ethiopian 2:06 marathoner has less ground contact time than a Texan 3:16 age-grouper. Such a metric in and of itself doesn’t do much good (feature for feature’s sake) – but creating a measurement is a requisite step in the process (towards improving running efficiency).
Third – again… the riddle… well, it will be interesting to see in what form a tool can be developed to actually help coach runners on efficiency. Constantly looking at ones watch or phone while outside running won’t likely be practical… but perhaps an app that can be used while on a treadmill, showing efficiency dynamics in real time, would enable runners to play and experiment with their stride and possibly re-train their form and technique to improve their efficiency. This would be an interesting feature indeed. Hopefully the guys at Stryd will develop something of this nature, they seem to have an energetic and competent team behind the project.
Thanks for the article Ray.
Being quite active at their forum it seems they are well aware of current short comings of the product and are constantly doing work to make it even better. For example looking more into different running styles like glide / gazelle and improving their model on that.
Waiting with interest what they have come up with.
I think perhaps it is still too early to compare these metrics – it appears before you can say that one device is better than the other, companies need to agree on some basics definitions.
A heartbeat is easy to define: it is a clear signal, and you either pick it up or you don’t; the same applies to cadence: your foot hits the ground or it doesn’t. GPS is a bit harder, because yes, you move or you don’t ( which you don’t need gps for to detect), but gps needs to decide not just that 0 or 1 question, but the answer to ‘how much’. That is relatively easy as it can be measured and there is no discussion about what actually counts as a shift in position IRL, even a mm is a move, so you can focus on GPS accuracy. But with something like ground contact time, you need to decide when there is no contact anymore, and when there is: what force needs to be applied to a footpod or sole to count as the starting point of ‘foot hit the ground”? I imagine that is not a 0 or 1 question, as force it felt by the pod with any foot movement. And I imagine that with a higher cadence, comes more force to at least the pods in all kinds of directions than with a low cadence, since your legs move faster, so perhaps the starting point for ‘foot hit the ground’ has to take cadence into account? But what is hitting the ground, really? How many g’s should be measured? How much weight as percentage of body weight should be felt to count as impact moment? The devices cannot be seen as good or bad, accurate or not, until they agree upon basics like that, industry wide. Perhaps that is where science can come in.
One final thought: I think you would actually need the raw data, not the smoothed, processed numbers, to really compare the devices. Then at least you could see whether or not there is some consensus about what is actually measured.
Usefulness for the average runner seem indeed limited, but what about specialized use? For example, someone who has supination problems and want to try different techniques to see which one works best for him/her
Ray,
This is an interesting comparison of different wearable sensors and I enjoyed reading it and appreciate the effort put into the analysis. I just wanted to point out that my lab recently published a validation study for the Garmin Forerunner 620. The article can be found here:
link to journals.humankinetics.com
Overall, measures of vertical oscillation (VO) and ground contact time (GCT) were found to be valid. I hope this research is helpful.
Cheers
Reed
Next generation of SHFT is at Kickstarter in early bird stage at 59$
link to kickstarter.com
Some observations :
1. Comparison amongst devices without a lab worthy gold standard to compare to is problematic. If all devices say you’re heading north but the true direction was south, it does not matter if you’re headed north east or north west, you’re wrong in both cases. Therefore, any claim that data should be ‘accurate’ as you compare across platforms is misunderstanding what accuracy really means. Precise yes and you can be precisely wrong. But on accuracy for all variables being measured, we’re not there yet. Not in this blog post.
2. Real world production processes mean you’ll always introduce some variation into mass manufactured commercial devices. If you need six sigma level quality for error reduction, you’ll probably pay a hefty price on the device. Device manufacturers most probably have to make some cuts somewhere to target a sale price, either in different suppliers, different processes, different materials, different resourcing for analytics processing etc etc. So between different platforms, you will see variation. Within one platform itself, you can see variation. If that error is repeatable day in and day out, that’s consistent and a user could care less while comparing two runs. If random errors pop up day in and day out, that’s a problem.
3. Without numerically accounting for how much measurement error is within a device itself day in and day out, is comparing economy metrics among different runners wearing the same platorm valid? We need to put some more thought into this. A scientifically valid approach would be to pull out two Stryds randomly from a bucket of production batches, give it to two runners, have them run prescribed workouts (also randomly) and then we can start to sit and account for uncertainties in the measured data and express calculated economy variables with that uncertainty. Currently, no one is doing this and I suspect no one has the time for it. But people are busy writing books taking everything at face value. Hang on… we’re moving too fast.
4. Also problematic, as one comment pointed out, is that lack of standardization on reported quality of measured variables. Take average running pace. I’m not an expert but even for a fundamental GPS based measurement such as speed, I understand there is no international standard. And how will one watch manufacturer interpret what the average needs to be? Harmonic mean? Arithmetic mean? Or something else? Whats going into the algorithm? These aspects of measurement and reporting are not truly transparent to the average user. Economy calculations that feature average pace must be taken with some grain of salt.
5. Different platform OEMs have different kinds of ‘juicing’ done on the data. What you get on a screen in front of you is not the real thing. So one OEM could interpret a spike as a spike, while another may report it as is. But basing calculations that are sensitive to those spikes and troughs in the data maybe a problem. An amusing example is how Polar reports the so called “Running Index”. Users tend to report abnormal spikes in HR (beyond 200 bpm) on the blogs, Polar being Polar takes HR data at face value on their web interface and reports a Running Index, which can be underestimated when HR spikes are present or overestimated when HR data ‘drops’. Again, this is due to lack of standardization on how sensitive a dervived economy calculation should be to abnormalities in the data.
Currently, we lack a proper structure to guide the use and interpretation of sports metrics. I don’t expect it to change soon.
Ron
http://www.georgeron.com
Hi Ron,
Take a look at this persons exhaustive research in GPS accuracy: link to fellrnr.com
It’s actually quite complex and he goes into far greater detail than even Ray does.
I believe he’s currently evaluating stride. I think you’ll find his site interesting.
Cheers
I think there are allready more “guestimations” around than we need.
My Vo2Max according to a Garmin watch is 45. According to a Polar watch it is 69.
Beginner or elite? That’s just crazy.
On the Garmin my marathon time estimation may change from 3:25 to 3:50 just because the optical hr has failed during a single run in cold weather. Sometimes it seams to measure cadence instead of hr (much too high).
Calories also tend to differ widely between devices. I have seen differences like 500 vs. 800 calories when wearing two watches on the same run. That’s huge. I don’t care personally, but many activity trackers are bought because people want to loose weight.
Christian
Ron I think you have some good points, but I suspect the greatest part of the difference is not in the quality of the sensors (accelerometers are very cheap these days) but in the processing of the raw acceleration data.
What really has to happen for us to see a graph is:
1) data is collected as an analog signal
2) it is converted to a digital signal
3) it is then processed into a metric such as ground contact time, braking, etc.
4) it is relayed to the ‘computer’ (whether that’s a watch, phone, or other is irrelevant) where it is plotted against a time axis which is common to all the metrics.
The last point is kind of nuanced – just because something is written down as occuring at time ‘x’ doesn’t mean it actually occurred then – that’s just when the computer received the data.
I’d be interested to see if that last step came into play for the HRM-TRI vs the Stryd, because the data seem very close compared to some of the other sensors. Keeping in mind that Ray was taking about 3 steps PER SECOND, it becomes very important where in that second you look at the data. So while looking at the Garmin plots of STRYD vs HRM-TRI they seem to track, in reality the time axis is far too coarse for such a comparison. To do a real in-depth analysis it would be worth looking to see if the data for one device was shifted even by a few hundred miliseconds vs the other – that could explain a lot of the difference between those two devices.
Andrew
I think it’s important to separate what is being meassured and the popular interpretation of that metric. None of the devices measure GCT the way we interpret it (the time a foot is touching the ground), I assume that the devices meassure the time the pod is in its lowest position and calculate GCT from that. It’s therefore no surprise that a chest pod and a foot pod give different results. To say that the foot has left the ground It is also necessary to specify how high from the lowest position the pod needs to be. Since this distance is not standardiserat it is no surprise that the pods placed at the same position will give different results.
Since there is an explanation for the discrepancy it is, for me, not problematic that the different units give different GCT. The important question is instead what metrics like GCT (and others provided by these units can be used for). Unfortunately, I don’t think that neither the industry not the consumer really got any clue but I think running power could be a good first step.
Actually GCT would be more easily measured/determined by acceleration in a certain direction, the forward one, of cause it is more complex then I just state here. but fast deceleration indicates landing and fast acceleration of the pod points out that the foot is lifted and moving towards the under the torso. Since an accelerometer can measure accelerations and deceleration that would be the way to measure, not the “position”
Fred : As I understand, these footpods measure GCT from the timespan of detection of a distinct rise and peak in acceleration (landing) and another marker for toe off which is set by a threshold value of g’s. Establishing the threshold is probably by cross-checking with a video camera motion study on the treadmill. Perhaps different companies interpret that marker differently.
Please see Appendix figure 4 in my post, which leads to a IEEE study on impelementation of an accelerometer to study running kinematics : link to georgeron.com
Ron, thanks for the link. Interesting reading. You are right, of course since the pods meassure g there is no need to integrate to get a distance. The landing should be pretty easy to determine. Determine when the foot leaves the ground must be way more complicated as different threshold g:s would give very different GCT. I would imagine that making comparisons with video recordings would be hard. I mean, couldn’t GCT also be defined based on when the heal leaves the ground??? Without a common threshold, all pods will give different GCT and all pods will, unfortunately, be as accurate.
It’s a real pity that de Milestone Pod only gives minute by minute results instead of second by second. When I ran 10 * 100 meters a few days ago, it appeared in the graph as three low pace bumps in stead of ten sharp peeks. Apparently the parts where my pace was below 100 spm were deleted.
This means that short intervals cannot be analysed!
Milestone replied that they were not planning to enable setting the pace threshold of what to delete yourself.
Is it known whether the detailed data gathered are present in the pod before they are send to the app? Is there anyone who’s able to extract these data?
Lumo Run anybody?
Sorry, I thought the Lumo run short was a different product…
Anyone have any thoughts on the Milestone Pod vs Garmin Footpod for general accuracy of instant pace, cadence, distance data, when used direct to a Fenix 5 over BLE with the Beta firmware? I’m looking to get a pod and trying to choose between the two in order to get improved outdoor instant pace and indoor treadmill use. But I’m confused as to whether with the beta firmware the Milestone can send data to and be recorded by Garmin Connect. As well as what this “Per minute summary only” means in that context. Would I be better off with the Garmin footpod? I don’t really need data like GCT etc.
The official firmware for real time tracking was released a few days ago. I don’t have experience with it or with the beta release. In the next link more info is avalable:
link to milestonepod.com
What running device for power should i choose?
Honestly, really only one choice – Stryd.
Nothing else really does running power accurate or repeatably.
Hi Ray.
I think you need to update your chart with Runscribe Plus. On the paper it looks better than Stryd!
This does look incredibly exciting. The ANT+ broadcast of the running metrics could be a real game changer. I have been hoping for this from the moment I backed the initial kickstarter. I’m not so sure about power (could you compare Stryd and RS – will they measure and report the same metrics defined as the same thing – like cycling power meters??). However, being able to see live footstrike type, during an interval session or a long tiring tempo run for example, would be a HUGE leap forward in running technology.
Also note that this will go into the FIT file and be shown in Garmin Connect. I really really hope sporttracks are listening to this, and the pull the data into there too. Seeing everything in one place would be awesome.
(but the RS plus isnt likely to be available for a couple of months…. so I dont expect Ray to add it here unless he has a pre-prod version).
Indeed, looks very solid. I’ll add it in once I have them in my hands (my general rule, so I can sift through marketing vs reality).
realtime footstrike metrics does look exciting. agreed
and dual-sided too for power will be tempting for others. It seems that power will be in beta when the product is released.
sporttracks [3.1]: you can, supposedly, get any/all the CIQ metrics already. however, in the case of running power, I think you have to read it into one of OMB’s fields using his FIT importer and one of the custom tracks plugins. Then you have to copy it manually to the regular POWER field. There is a one word summery to all of that…SIGH (note use of capitals)
Did you see the RunScribe Plus announcement? link to runscribe.myshopify.com I’m curious how they’ll stack up to Stryd? Hope they send you a pair of the new model to review … sounds like they’re finally integrated with IQ.
Indeed, I think it’s fantastic.
Fantastic news, or fantastic following some time with them??
Dual sided power could be a big swipe at stryd!
It is interesting that for the same pricepoint as Stryd, you get dual sided power with Runscribe. (Accelerometers must be stupid cheap to purchase) .Not a bad strategy to attack the competition.
However, you’re still not measuring actual power with either of these devices. I would imagine that Runscribe bought a few Stryd devices to benchmark against and if the science is sound, both the devices should indicate *nearly* the same wattages. Differences are subject to inhouse algorithms, ultimately its about who has better mathematics. Stryd has undergone two firmware revisions which have corrected the way they compute hill power. This is where the gold is.
I don’t really care if the numbers are the same as stryd, or even if they’re accurate. As long as they are consistent, and consistent across different running conditions and surfaces.
Any new news on running with a power meter? It has been over a year since Stryd released gen 2, and I haven’t noticed much news or many other product announcements. Is the power meter for runners a bit of hype, or is there something to it and the market is just gearing up?
Also, you talk about how hard it is to get into the power meter market for bicycles due to the challenges associated with accuracy and consistency in accuracy. Is the running market analogous?
Finally scrolled through all these comments here and saw the RunScribe Plus announcement. I’ll keep watch. I suspect you’ll have any early one, maybe already, or at least right away in October. Thanks Ray!
Hi,
Way too late to comment on annoys post… But than again, it will not harm :-)
Regarding the difficulty in time alignment. If you are lacking a start button, we are only talking about a systematic time shift, so you could „create“ an event in your run you can easily recognize, e.g. jump for five times, stand still for 15 seconds with a jump innit, whatever… you get the picture. The more abrupt the better. Than you should be able to identify the lag easily. At least that is the case in my imagination.
Take care
Stefan
RunScribe have said that they will very shortly (next few days/week) be using the bidirectional ANT interface between the watch and the pods to start and stop recording. That should solve the issue there.
Hi Ray,
I would recommend to read a little about measurement theory, especially discrete-time domain measurements, analogue-digital conversion and sampling theorems (what is the Nyqvist frequency of data sampling), etc. Many of the artifacts you have seen are in fact inevitable due to unsynchronized sampling clocks, digitization delays, packetization and packet-scheduling delays in the ANT+ communication, then similar delays in message processing and GPS signal processing in the respective receiving devices
Nah, not really. That’s sometimes true in power meter measurements, but not here.
None of units I tested rely on GPS signal processing for most of their data. And even if they did, when I look at trending over a given time period (i.e. 1 minute/5 minutes/etc..), then we’d remove any sub-second issues that you might see with ANT+/BLE. All of which show that at the end of the day, nobody is like one another.
I don’t really care about all of these running dynamics/efficiency scores. I just want the most consistent/accurate pace and distance information. Have you ever done a shootout for those metrics between all the foot pods? I’m really curious to see what provides the most consistent and accurate info for pacing. GPS just sucks for pace.
In general, I find my calibrated Stryd consistantly with a 1%-2% error depending on wind and how grippy the running surface is. GPS is about the same but much worse when running in canyons, forest trails, near tall buildings, etc. Real-time pace on both aren’t great. I always set the pace metric to lap pace. It wavers far less and is arguably the more useful metric when trying to adhere to an interval or race plan. As an aside, I find that using power is more responsive and helpful than using HR to keep constant effort on undulating runs. HR will always be important…and I think power will be equally so in a few years.
…argh!! After spending the past few weeks of light research, I’m making my first investment in collecting running biometrics beyond HR in Stryd. Why Stryd? Primarily for the integration with Zwift. In the midwest of USA, winter running can be problem…..having something to make the treadmill more inviting is a plus for me. Also, per Ray’s observation, these various units have a 2-3 year life. That is an eternity of technology improvements. So rather then sit on the sideline and wait for the perfect technology, I figure I’ll give Stryd a try and then re-review the best option again a few years up the road (hopefully that will be Stryd for normalized data).
Just one guys rationale of choice. Good luck with whatever you decide.
I find Runscribe the most compelling.
For me, RS has been very valuable in tracking efficiency differences b/w one side of my running form vs. the other. This functionality is especially helpful if you feel like you tend to have a dominant side in your running form and/or if you feel like you’re more vulnerable to injury or inefficiencies on one side more than the other.
Of course, Runscribe’s metrics cannot interpret or diagnose the cause of any efficiency differences b/w L vs. R that you might see. Nor can it tell you how those differences are related (or not) to your niggles and/or injury history. But RS sure can help you see how those differences are manifesting, especially if you can correlate them over time with what kind of feedback your body is giving you.
Hello, Ray. Very thorough and interesting review. That being said, if all I want is a thing that will let me run on Zwift, is there any reason not to just get the $29 Milestone? Thank you.
Went to a talk by one of our great local sports therapists on achilles injuries… and he starts talking about how it’s not the amount of Pronation that’s correlated with injury as but rather the Pronation (angular) velocity. And, because I use RunScribes- I now track my pronation velocity! which apparently can be slowed down with specific strength training.
I was wondering what I was going to do with all this RunScribe data… and now I know. I’m going to train and see if I can slow down my pronation velocity.
The RunScribe Pro’s are very slick devices. Super easy to use- the app, web site and devices all work flawlessly and give me consistent data. Seems accurate, but hard to tell. Major kudos to Tim Clark for all the work he has put into developing this product. Two local coaches seem to be very interested in them as well.
so there- I’ve found a direct use for the data.
Interested in Milestone pod precision
Don’t – Zwift killed its use completely.