In December a Boulder based company with only a handful of employees announced that they had put together a running power meter. They’d taken the same concepts from the cycling world, but moved it into the running world. In doing so, they’d be the first true consumer running power meter.
For those not familiar with power (in cycling anyway), it’s a metric that normalizes effort expended. For example, on windy days your pace would be impacted by a headwind (slower), whereas your HR would be higher. How do you easily compare those across multiple runs? That’s where power comes into play. It removes the variables of HR or wind and is one standard you can validate against. Power is typically expressed in wattage (i.e. 215w), though you often compare different people using watts/kilogram (to account for weight differences).
Of course, there’s been many thoughts and ideas put forth on running power. But all of these ideas have centered heavily on a measurement device at your shoe. Such as an insole or the like. Not with Stryd. For that, it’s merely a little pod that you clip on your running shorts.
I had the chance to run with it earlier this month, and then get both the raw data for me to poke at, as well as it analyzed by the Stryd team. Obviously things are still in beta – but this shows you where they are and a bit about their plans moving forward.
The Hardware:

To begin, the hardware is a simple as you can get. It’s just a little pod you clip onto your running shorts. Currently the pod has staged an Occupy movement inside what appears to be an old Fitbit Zip rubber clip. But that’s perfectly fine – it’s a well proven mounting home, so perfect for testing.
The pod itself is effectively not much different than your average modern running footpod, similarly with some accelerometers in it. In many ways, the magic here isn’t the hardware. It’s the software. It’s the algorithms that enable the company to see through all the noise of running and produce something that feels and looks like regular power meter data that you’d see while cycling.
Like most other coin cell battery powered devices, the battery on this should last about a year or so. For the day I was there it was using Bluetooth Smart, but they also support ANT+ too on the same hardware. It was simply a case of them working on BLE first because the Suunto Ambit3 supported power meters in the running profile, whereas most other watches don’t. For example, if you wanted to use it with your Garmin watch today, you could do that – you just need to be in cycling mode (and that it supports ANT+ power meters). If Garmin were to enable power meters during the running mode, then that’d work just fine.
Speaking of which, you’ll need some way to capture the data. Right now there’s two options. The first is pairing to a capable watch. That would mostly be limited to the Suunto Ambit3 today, again, simply because they left it open to pair to power meters while running (most other companies disabled that to minimize confusion). But I suspect that’s going to be less of an issue as it’s relatively easy for other companies to re-enable that in their products (i.e. Garmin, Polar, etc…). Of course, you can certainly use it with a watch using that watch’s cycling mode and collect power meter data that way instead (i.e. a Garmin FR910/920XT/etc…). It’s just that it won’t then show you things like ‘Pace’, rather instead giving you ‘Speed’.
In addition to using a watch, you can also use their app – which will collect the data and also broadcast out updates in real time using a pair of headphones (wired or Bluetooth is fine). So it’ll give you real-time stats as you run, similar to most other running apps.

Because they’re using the two standard protocols (ANT+ and Bluetooth Smart) for delivering the information – it’ll pretty much work with any apps that allow you to connect to a Bluetooth Smart or ANT+ power meter. So you could just as easily use the Strava app as the Stryd app.
Running with it:

When it comes to testing things, the track is a great place to start. It allows a very controlled environment to figure out exactly how a device works before you take it somewhere more challenging.
After a brief overview of the pieces at play, they got me all setup on the unit. Getting the unit installed is silly easy. You just clip it on the back of your running shorts. At which point you’re done (unless you iron your running shorts, which I probably should consider next time I have a photo taken of my running shorts).

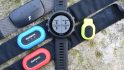
I was wearing two different watches. The blue one you see to the left is the Suunto Ambit3. While on the right side I’ve got a FR920XT. In this case, the 920XT wasn’t doing anything related to the power from Stryd. It was just along for the run. On some of the runs they also outfitted me with a phone in a small armband. This was to demonstrate the phone app capabilities.
With that set, after a bit of a warm-up we had two different structured tests they wanted me to run through. They were as follows:
Test 1: Interval test of 1-minute hard, 1-minute easy, repeated four times.
Test 2: 10-Minute test sustained 5K pace
The purpose of these tests were to show me how the power would vary depending on what I was doing. The shorter ones make it easy to see the on/off aspects of running hard, as well as to see the stabilization on each interval. Whereas the longer one shows a bit of the steady-state pacing aspects.
With that…I got running.

While running with the phone app, it’d audibly tell me my real time stats including power. Unfortunately I was having a bit of trouble with the headphone staying in my ears – so this part was a bit finicky. Of course, that has nothing to do with the Stryd system, but rather just the headphones that we collectively had in our bags. It worked enough that I got the gist of it though. And, for how the app works, it’s perfectly acceptable.

As I noted to them though, most runners that are running at a level where they’d be interested in power meter data are probably more of the watch (or nothing) type. So while I appreciate the app, it’s just not something I’d typically use myself.
Next, we move to the watch connected mode.
For that things get super simple and much more comfortable. One of the data screens had been configured to show power (instant/current), while also showing max power along the bottom.
As I ran, this value would update with my current power. The harder I ran, the higher the values. The easier I ran, the lower the values. What was cool here is that the algorithms they’ve used seemed to roughly jive with power values I’d get while cycling from a perceived effort standpoint. Whether this was by pure coincidence or mathematical ingenuity is something that probably takes more samples than just me to sort through. For the most part, when my pace was consistent time-wise, the power values were consistent on the display (there was no wind).

Like while cycling, you’ll see slight variations in power as you run. Meaning that one moment it might be 258w, and the next 252w. You can see the above and below photos take a couple of seconds apart with a slight variation in power. Again, that’s completely normal as you’re putting out slightly different levels. Most cyclists take care of this by using a smoothed data screen such as 3s or 10s power, which shows you the average of the last 3s or 10s (seconds).

Also like cycling, when you stop, you stop producing power. You can see it’s now showing a zero value power output. If I walk, it shows low double digit values instead.

To get a feeling for what this looks like, here’s a short video I shot running around the track. You’ll have to forgive the camera work, obviously I was trying to hold and run at one time and keeping it steady. You’re focusing on the top number, which is instant power.

Now, what’s interesting with Stryd is to actually look at something like running up or down hills. In this case, there aren’t too many hills in Las Vegas proper, so we had to use the very small hill (mound?) near the track – but it was just enough to demonstrate the concept.
Typically if you think about running you’d have a slower pace for the same perceived effort while going uphill. In other words if you kept your HR the same, then your pace would be lower. Inversely, if you increased your effort (and HR) you might be able to maintain the pace up a hill. However, in both cases you tend to get a bit of normal HR lag – and you also tend to have troubles comparing that effort to flat-land efforts.
But how would power work?

Well this is where it’s fascinating and starts to ‘prove’ the concept. In this case I ran up and down a few times at different paces and intensities. I was able to clearly start to see the detachment between pace and power, as you would want/expect. As I ran faster up the hill the power spiked, despite pace significantly slower than on the track. And yet, as I ran down the hill, the power dropped significantly, even though my pace was faster. That’s because I was putting out far less effort running downhill at pace, than running on flat ground at the same pace.

Between these track tests and the hill I was able to start getting a feel for the concept of it. Or at least, the beginnings of it.
Just like when you start cycling with power, it often takes months to understand different scenarios and how your body reacts to them. So I’d expect the same for running. It’d likely take me months as well to really get a feel for things and really understand what you’re being told and how best to use it. Still, at least initially the data being shown seems consistent.
Of course, when it comes to racing and training the value will likely be similar to cycling. People use power targets for different sections of the race, often depending on terrain and the length of the race. This helps to ensure you don’t go too easy or too hard.
Analyzing the Data:

There is perhaps no better place in Las Vegas to analyze running data than a concrete picnic table on the side of the track. Unless of course you add a small green metal tea bag container to the table…then you reach scientific geek perfection. In case you’re wondering, they use that tea container as a portable faraday cage (better than a microwave) to isolate wireless devices during pairing.
First up, let’s just quickly run through the phone app – and then we’ll talk raw data. The app itself shows some basic stats from the run on the summary screen. This is of course in addition to the functionality of real-time announcements during the run over headphones.
You can see this histogram of my power during the run itself, along with some summary information up top. You’ll note that it’s also capturing cadence as well.


Let’s move onto the data recorded though and take a look at it chunk by chunk.
First up is the interval session. This was where I was doing 4x(1-min hard, 1-min easy). In this case I had a brief warm-up at the beginning just to get into the swing of things, before I started in on it. Below is the data shown on their site and collected from the unit. Note that you can of course use other sites (and I’ll show that in a moment).

For the above focus on the final four bumps, which are the four intervals. Higher up is faster, lower down is slower.
What you see is that that the red/orange line is power, and that it tends to correlate pretty closely with pace, especially at the beginning and ending of each interval. This makes sense, especially given the flat nature of the track. Where you see more interesting data though is when you overlay the HR in there (blue) in that there’s the clear delay as you usually see on HR data (just normal body reaction time). So while I stabilized pace and power reasonably quickly, HR takes a while to stabilize.
You do see on each instance at the very beginning that my effort spikes as I start each 1-minute chunk. But despite that happening, the pace actually is still ramping up – a good example of the natural ebb and flow that typically occurs at the start of most intervals.
Next we look at the 10-minute steady state run. For this we see a pretty solid correlation between pace and power. It’s interesting to see that despite me being pretty consistent (I was timing each 100m chunk and subdividing seconds per 100m against a known 5K pace), there is still slight variation during each chunk. This is especially obvious at the beginning, where you see more variation. Whereas in the middle it’s pretty even. It’s here that when out on the open road with rolling terrain you could use a power number to pace by (especially in a longer event), rather than straight pace or HR.

Now while the above examples are interesting, I think the most valuable one is actually the small hill repeats. I ended up doing four runs on it, one the long-ways over the hill (shallower), and then three with variations on the shorter/steeper direction.
First, notice that my HR is pretty much stable across the entire effort – regardless of whether I was going up or down. Again a good example of HR lag here, and something that’d be pretty common in a hilly race.

Now if you look at the last two ups/downs you’ll see the really interesting alignment there where power follows the hill profile almost perfectly (just like it would when cycling), whereas pace is inverted. It’s of course slightly hard to see due to the size of the hill, but it’s there. Now obviously if this were a bigger hill then you’d expect that once your power stabilized (likely as the grade stabilized) that it wouldn’t ‘follow the hill’ anymore, but rather flat-line.

Now in addition to this you can also pull this data into 3rd party sites, like Suunto Movescount. They had their Ambit3 connected to their account and were able to run through the data during the workout.

Afterwards however they sent me the .FIT files, and from there I could upload it to other sites, such as TrainingPeaks or Sport Tracks. In the case of Training Peaks I wasn’t getting the exported data to plot (Updated: Found my issue!). Below you can see the results, first on Sport Tracks, then on Training Peaks:


Ultimately, plotting this data is super easy for companies to add since it’s largely already supported by them for cycling power meters – so it’s something that I’d expect to quickly catch on.
Of course, from a large standpoint there’s a lot more analytics that probably need to go on, and ideally on longer runs. For example I’d be interested in establishing the relationship between cadence vs power, or power vs fatigue. There’s obviously been a lot of focus on running efficiency, with many companies getting into those metrics. But this helps to have a more specific data point than just pace (which is impacted by terrain), or heart rate (which is impacted by fatigue).
One final note on ‘accuracy’, and how ‘accurate’ is the system. Obviously, given there’s nothing out there to compare it to today from a consumer standpoint – I don’t have any method to independently validate that.
Stryd however has gone to some university facilities that have force plate treadmills that can measure power output of runners. From that they showed me data exhibiting that the unit had near perfectly matched the expensive lab based system.
![Stryd5_thumb[8]_thumb](https://media.dcrainmaker.com/images/2015/01/Stryd5_thumb8_thumb1.png "Stryd5_thumb[8]_thumb")
Of course I have no way of proving if the charts they showed me of near perfection were normal, or if the remainder of the data they collected was more scattered than a game of Twister. But I suspect that it’s probably at least in the ballpark of what they showed.
![Stryd7_thumb[6]_thumb](https://media.dcrainmaker.com/images/2015/01/Stryd7_thumb6_thumb.png "Stryd7_thumb[6]_thumb")
Down the road once they release a product – I’ll see if I can sucker find some other university to let me utilize their fancy treadmill and do some similar tests with a couple of folks.
A few final thoughts:

There’s no doubt the potential for running power data will be huge down the road. Anyone who thinks otherwise is just repeating the historical misbeliefs of people 15 years ago saying cycling power meters will never catch on. And in the case of cycling power meters the cost barrier has been mostly massive until the last few years (upwards of thousands of dollars). Whereas with this device – their raw materials cost is tiny – with the retail cost in the $150 range.
The trick however to running power will be to demonstrate to people the value of using power over pace (or heart rate), as is done today. As you can see in my first two examples on flat terrain those correlated quite well. I’m not convinced in a flat windless race that you’d get a whole lot of additional value from running power than pace/HR.
Where the much greater value is on courses with more terrain, or with substantial wind. For these power (just like on the bike) can be incredibly beneficial, especially in pacing longer efforts like half marathon or marathons. Or especially in cases like an ultra through tough terrain.
But perhaps I’ll change my mind on the first part and find it more valuable in flat terrain than I think today. If and when they send me out a unit to use more long term and really get some good data collected across a variety of scenarios, l’ll be able to make a better determination (plenty of flats in central Paris, and plenty of hills on the edges).
Still, despite all that, for a beta product what I saw is very promising. They gave me the raw data afterwards – and of course I got to see it myself while it was collecting data. The results in both cases were consistent and appeared logical. I would point out that this is an example of a product that appears more mature than most pre-launch products are. I put this very much in the same maturity level as when I tested the Backtracker system this past summer (who were just acquired by Garmin). Thus, based on the limited data I have, I wouldn’t hesitate to back them in their upcoming product launch next month.
Speaking of which, here’s the details you’ve probably been looking for. The dual ANT+/Bluetooth Smart capable unit will sell for $149US when they launch in February. Right now they’re looking at leveraging crowd funding for the initial lot (i.e. Kickstarter). They’ll deliver those units in April to your running shorts.
Then by summer they’ll be in regular distribution mode, where you can buy it through more normal channels. As part of the purchase you’ll get access to the app and their website, though of course since it supports standard ANT+ and Bluetooth Smart power protocols – so you’ll be able to use it on any apps/devices that support that (pretty much everyone).
With that – thanks for reading! And of course feel free to drop any questions below and I can try and track down answers.
FOUND THIS POST USEFUL? SUPPORT THE SITE!
Hopefully, you found this post useful. The website is really a labor of love, so please consider becoming a DC RAINMAKER Supporter. This gets you an ad-free experience, and access to our (mostly) bi-monthly behind-the-scenes video series of “Shed Talkin’”.
Support DCRainMaker - Shop on Amazon
Otherwise, perhaps consider using the below link if shopping on Amazon. As an Amazon Associate, I earn from qualifying purchases. It doesn’t cost you anything extra, but your purchases help support this website a lot. It could simply be buying toilet paper, or this pizza oven we use and love.