Newcomers to GPS sport devices like the Garmin Forerunner or Timex Global Trainer often wonder exactly how accurate the devices are. And seasoned users occasionally notice small oddities when comparing their run totals between training partners on the same run. So that got me thinking – why not put some of the GPS devices to the test. Sure, we all know the distances our local running and cycling routes are ‘roughly’. For example, we know that in theory our local 1 mile path loop is 1 mile…but – is it exactly one mile, down to the foot? And if so – if you took a sport GPS device out there, how accurate would it be?
Would it be 100 feet off, 10 feet off, or 1 foot off?
Further, with many of the devices now using the exact same underlying GPS chip – how important is the software that runs the device when it comes to distance accuracy? And would devices made by the same manufacturer with the same chips be the same?
Well…I set to find out.
Methodology:
Over the course of a number of weekends I did four separate and distinct tests. The tests involved four different courses with varying levels of ‘difficulty’, these included:
1) The Straight Arrow: A perfectly straight out and back course with low tree coverage – exactly 1.00 miles.
2) The Rambling Loop: A half a mile loop with plenty of turns, a bit of trees and some ups and downs – basically your average run.
3) The Deep Tree Adventure: Into the woods I went, on a fairly twisty and turning route on dirt trails
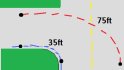
4) The Quick Turn Test: A very tight .05 mile loop course done over and over again with sharp corners.
Of course, you may be wondering how I was measuring these. Well, you might remember back to some of my previous course measuring posts, where I picked up a rolling measuring tape – similar to those used to mark out distances for cross country meets.
So I took that little roller and then strapped all of the GPS devices onto it. By doing so I could guarantee they were all going the same distance. Plus, it looked way less sketchy than strapping them on my wrist.

Finally, I was curious how speed and method of travel impacted the results, so I did each test three times:
1) Walking: This was simple, I walked the route and used the roller to determine the distance. All GPS devices recorded the distance as well.
2) Running: I then ran the exact same route, holding the roller which had the devices attached. The rolling distance was already established in the walking test.
3) Cycling: I rode a bike, at speeds typically between 15MPH and 20MPH. The roller was attached to the handlebars, with the devices in turn attached to it.
In order to ensure I was using the same exact course each time I used markers (such as walking/running/cycling 1-foot from the edge of the path), or in some cases – chalk, to mark out the course so I was getting the same path each time. Also, for each test I waited for all devices to show zero speed before starting or stopping measurement, as some take a bit of time to catch up. Also, because of rounding in the display devices, I actually used the raw values within the files of each unit. These values are stored in meters (not miles as you might think).
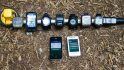
Finally, here’s the lineup of devices I used for the test:
1) Garmin Forerunner 310XT (Running/Cycling/Triathlon)
2) Garmin Edge 500 (Cycling)
3) Garmin Edge 800 (Cycling)
4) Timex Global Trainer (Running/Cycling/Triathlon)
I picked these watches simply because they’re among the most popular (or in the case of the Edge 800 – it’s the newest).
So with that, let’s get into the first two tests that make up Part I.
Test 1: The Straight Arrow
This first test was the easiest of the bunch. Really just a way to establish baseline amongst the watches and see if I saw anything strange out of the bunch. There’s a pretty nice little running path right outside my front door that is almost perfectly straight for a significant distance. It’s got virtually no tree cover or buildings within 200+ feet. Really, it’s an ideal test case.
This was an out and back course, where I preset the test distance at exactly one mile (5,280ft).

I simply walked out half a mile, marked the turnaround, and then walked back.

When I was done, it looked like this:

Then, I repeated the same test while running. I made sure to stop and let all GPS units catch up at the turnaround.
And finally, I repeated the test once more with a bike, following the same procedure.

So, what did I find? Aside from finding out that this generates a LOT of data files to work with, I got some interesting information. Here’s the results of the first round of testing:

Now, the really important thing to note is the following:
The majority of devices were within one-half of one-percent.
Fairly impressive.
This is important, because the above color coding can skew the mind into thinking that any one unit was drastically off the mark by an insurmountable distance. If you look at the numbers above – it’s crazy how close they came. No unit was more than 10 meters in total (out of a whole mile!).
Based on everything in the first test, the results across the board pretty much the same. Some units did slightly better on one test versus the other – but largely they agreed. Don’t worry though, we’re getting to the good stuff…
Test 2: The Rambling Loop
The next step is closest to what you might typically go out and run or ride with respect to conditions. The loop was around the perimeter of a waterpark, and featured both paved and compact dirt sections, as well as some tree cover, and a bit of swerving. It also had fairly open areas, and a couple of sharp 90* corners.
The total course was determined by the route, which ended up being 2,733ft long, which converted is 833.2 meters.
Here’s the overview:

Once again, I set out with Mr. Roller and got a walkin’:


Then it was time to run:

And finally, onto the bike:

After each loop I went ahead and ensured that all the pace/speed displays showed zero before stopping the timers – just to give each one a moment to catch-up. Once done I reset the activities and got them all downloaded.
Let’s get some results up on the screen:

Once again we see pretty accurate results across the board. Though, we also are starting to see a a few patterns develop.
First, if you do an average of the accuracy for each ‘sport’, you find that they actually don’t vary much at all between sports. Check it out:

Look at especially that very last line, difference between the walk test and the bike test for example, is .025%. That’s not 2%, but rather 2/100th of a percent. Pretty small.
Secondly, remember that the sports themselves aren’t important, but rather the speeds are. The watch doesn’t really care that it’s on a bike versus being carried. What it truly cares about is to a large degree speed. In this case, my biking speed (16MPH) was about twice as fast as my running speed (8MPH), which was then also twice as fast as my walking speed (4MPH).
Part I Wrap-up
As you might have noticed above – we’re starting to see a pattern develop where one specific device (Timex Global Trainer) is lowering the average consistently, and is off by more than 1% consistently while at speed.
However, what’s really interesting though is that while that same device has lesser results at speed, it actually performs pretty well at a walk.
This is where one has to start looking at how each company has implemented data recording metrics. For example, the Timex Global Trainer records a data point every 2-seconds. If you remember that GPS accuracy varies over the course of a route, perhaps that’s coming into play.

(Above: Timex Global Trainer raw data)
Meanwhile, the Garmin’s in these test all would have used smart recording, which means it records data points ‘when it wants to’, which typically is every 4-6 seconds, but sometimes more often.

(Above: Garmin 310XT raw data)
The question starts to become how does the recording interval affect the distance – if at all? Or will we find that the type of course and speed are really the major drivers?
To me, the key takeaway thus far though is back to the accuracy numbers, which when averaged are higher than 99% accurate. Typically both Garmin and Timex quote a 2.5% accuracy rate – and in this case, we’re nowhere near that inaccurate, are instead, far more accurate.
But…things are just getting interesting – stay tuned for Part II where we get into the fun tests. Dense trees, tight turns, and high speeds…oh my! Plus, I’ll cover some of the common questions and tricks to getting the highest levels of accuracy from your device.
And finally…if you think you know what’s coming based on the above tests…well..think again – the results coming up are mindboggling.
Read onto Part II here…
FOUND THIS POST USEFUL? SUPPORT THE SITE!
Hopefully, you found this post useful. The website is really a labor of love, so please consider becoming a DC RAINMAKER Supporter. This gets you an ad-free experience, and access to our (mostly) bi-monthly behind-the-scenes video series of “Shed Talkin’”.
Support DCRainMaker - Shop on Amazon
Otherwise, perhaps consider using the below link if shopping on Amazon. As an Amazon Associate, I earn from qualifying purchases. It doesn’t cost you anything extra, but your purchases help support this website a lot. It could simply be buying toilet paper, or this pizza oven we use and love.