Today, COROS has begun rollout of their EvoLab, which is a slate of metrics that are largely focused on training load, their impact, and recovery. In addition, for running specifically, they’ve got a number of predictive metrics including marathon level and race predictor, as well as running VO2Max. This update is partially on the app side, and partially on the watch side. They’re supporting the COROS Pace 2, APEX, APEX Pro, and Vertix for both app and watch side. Whereas the original Pace will only see the app side training load.
I’ve been using the update for a few weeks now, seeing how it compares in training load to Garmin and Polar in my day to day workouts. And while the update is substantial in nature, there are a number of catches to be aware of, especially if you happen to be a non-runner. We’ll dive into all those below though.
Note that COROS is launching this in two phases. The first is to people who sign-up for the pre-release functionality, effectively a beta. And then sometime “within the next month”, they’ll release it more broadly. That’s probably a good plan, as I’d say it’s definitely pretty beta-like right now. At least the initiation process. Once you’ve got cookin’, it’s more stable.
Training Load Overview:

You can hit the Play button above, which is my full explainer on how all this works as I walk through each component. Or, you can simply keep reading. Or do both…your call.
COROS’s training load platform is roughly divided into two pieces:
1) General stuff (like per-workout load and training effect)
2) Running specific stuff (like running race predictions)
For this first section, we’ll cover the general bits first – which are in theory available across all workout types, and not specific to running. In practice though, that’s a bit less true.
Before all that though, you’ll need to update your watch and your COROS smartphone app. It’s the app that’ll display all these new metrics, while the watch will also show metrics after workouts too. In fact, you can actually add the training load data field to your sport profile, and see it update in real-time throughout a workout. Updating all these things only takes a few minutes, just like normal.
Once all those pieces are updated, you’ll get the following data metrics (plus the new running ones I cover in the next section) – don’t worry, I explain them all down below:
- Training Load
- Base Fitness
- Load Impact
- Fatigue
- Training Effect
- Recovery Timer
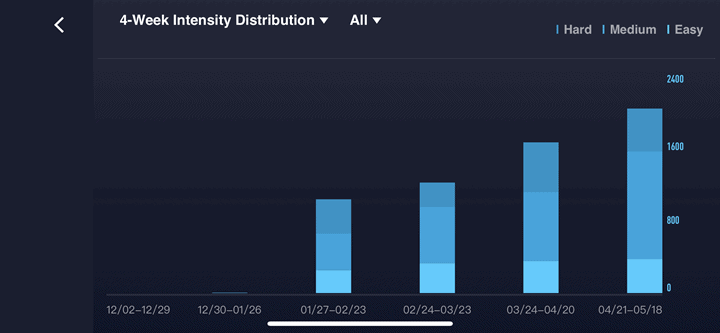
- 4-Week Intensity Distribution
These metrics are pretty common, and have largely been available for years on Polar, Suunto, and Garmin. Sometimes by different names and at different times, but generally the same concept. In the case of COROS, all of these metrics are entirely heart rate driven, and based on TRIMP. There’s no inclusion or dependency on power, pace, or speed. Thus, as COROS has noted, if your heart rate data is incorrect, your training load data will be too. In most cases, being slightly off won’t impact things considerably, however in other cases, if substantially off, it will.
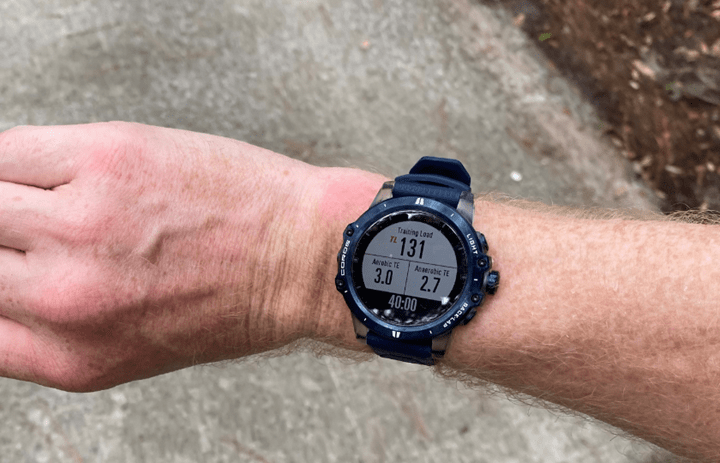
To begin, each of your workouts is assigned a training load value as you progress through it. You can see that value mid-workout if you add the training load data field to it. For example, here’s mid-way through a run:
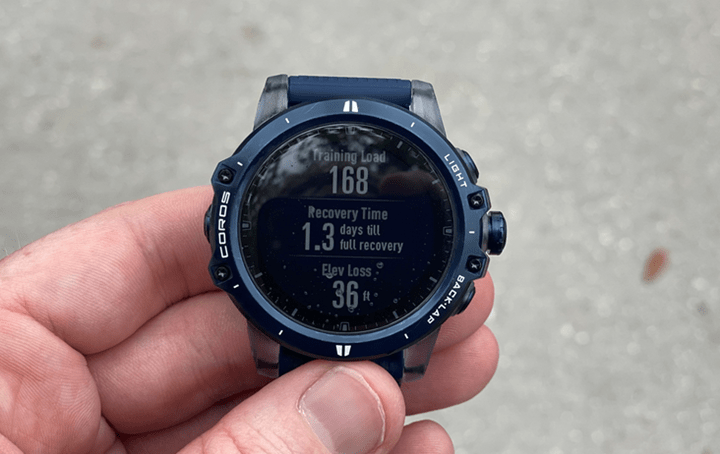
And then here’s at the completion of that run:
In general, the higher the heart rate, the higher the load. So more time in a harder ‘I’m gonna die’ heart rate zone will equal a higher training load value. The exact algorithm, in case you’re curious, for COROS’s individual workout training load is:
TRIMP = A x B x C
A = workout time (min)
B = (workout heart rate – resting heart rate) / (Max heart rate – resting heart rate)
C = 0.2445*e^(3.411*B)
In the case of COROS, their training load doesn’t have any accounting for heat, elevation (gain, loss, or current altitude). That’s not unusual per se. For example, FirstBeat’s algorithms for individual workout load (which is what Garmin uses) don’t include any substantial amount of impact for heat/elevation/power/speed/pace in them. However they do utilize that data later for training effect categorization, for example using power to more accurately nail the start of an interval due to heart rate lag.
Speaking of which, it was interesting to see the differences between workouts for training load values from a COROS unit vs a Garmin unit. While they trended similar, the exact same workout measured with virtually identical heart rates, resulted in moderately different values:
Steady-state Run (54 mins):
Garmin FR745: 130
COROS Vertix: 168
Short 400m Repeats Run (36 mins):
Garmin FR745: 139
COROS Vertix: 167
Polar Verity Sense: 81
Interval run with 90s repeats (55 mins):
Garmin FR745: 179
COROS Vertix: 223
Polar Verity Sense: 139
Threshold Trainer Ride (90 mins):
Garmin FR745: 247
COROS Vertix: 270
Practically speaking this won’t mean much since once you’ve jumped from one platform to the other, you’ll mentally just scale up or down accordingly.
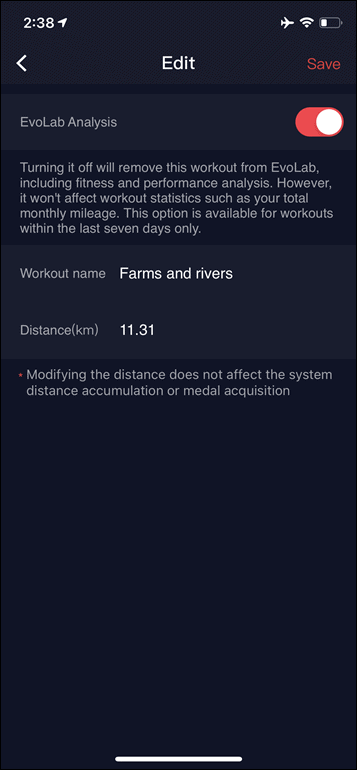
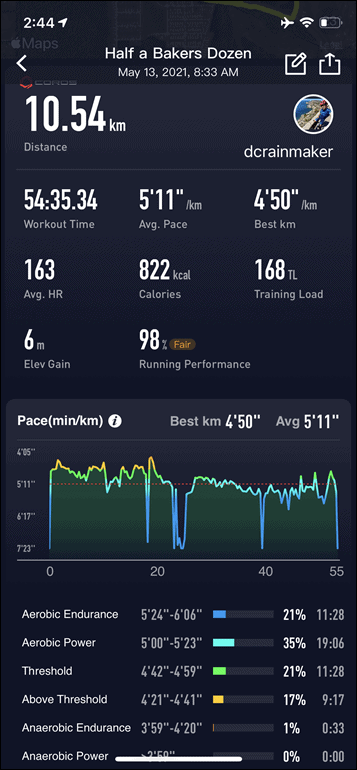
Now, all this data is then viewable on the app. First you’ll see the Training Load shown on the main page (TL), along with all your usual stats. Notably, at the upper corner of the screen is the little pencil icon. This allows you to disable EvoLab analysis for a workout. Oddly, you can only do this for workouts in the last 7 days.
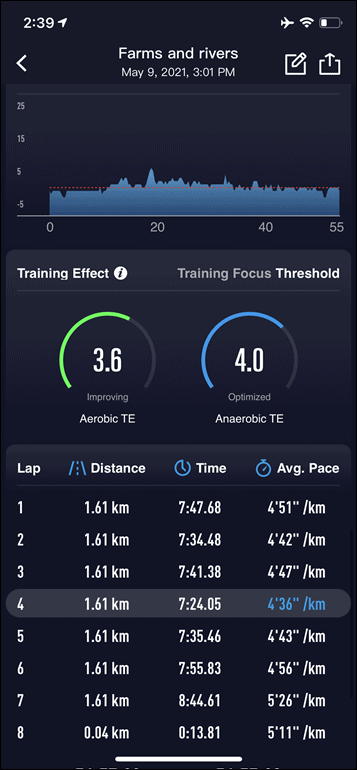
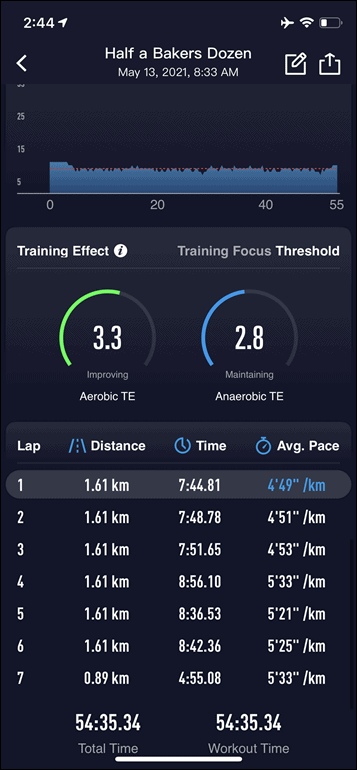
You’ll also see the Training Effect components down below in the charts, inclusive of the training focus area:
The next page with all of the longer-term stats is where things get a bit tricky. First, there’s a semi-substantial list of caveats before all of this data will display, and it’s really important to understand them. First, you’ll need the following:
1) Data will not display until 7 days after your first COROS workout with the new firmware/platform
2) You’ll need to complete 150 minutes of running data on the new firmware/platform
3) That eligible running data can’t be hilly, intervally, or too easy
4) That eligible running data needs to be on flat, paved roads
5) Eligible run data needs to be in ‘Run’ or ‘Track Run’ mode only (not trail running modes)
Now, these requirements actually then splinter into two subsequent pools. The first pool is those, such as a cyclist, that check off these requirements and then never run again. In that case, you’ll get all of the training load and fatigue bits just fine as long as you complete the initial 150 minutes of running within the parameters above. The second pool of data is those running-specific metrics I outline in the next section. For those mostly predictive running-focused metrics, you’ll need to keep running.
Note there is no way to know what is considered an eligible minute for those 150 minutes. This is especially notable for those that might live near hilly terrain, or have interval workouts on their weekly schedule. It might take considerably more than 7 days of time until you get yourself that 150 minutes.
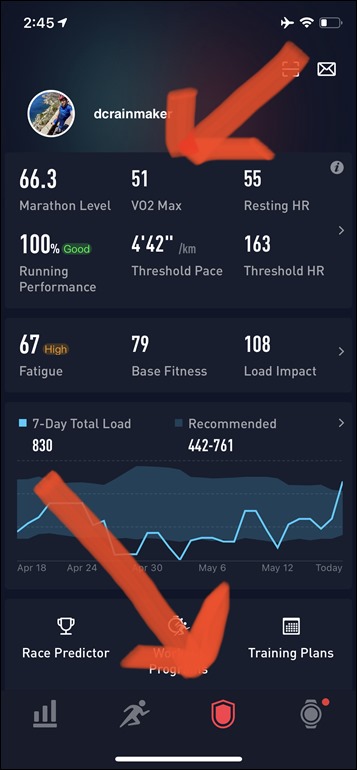
Once you do have all that time sorted out, you’ll see this page fully populated within the app. In my case I’ve mostly been a bit more bike-focused lately, so you’ll have to temporarily forgive my running metrics.
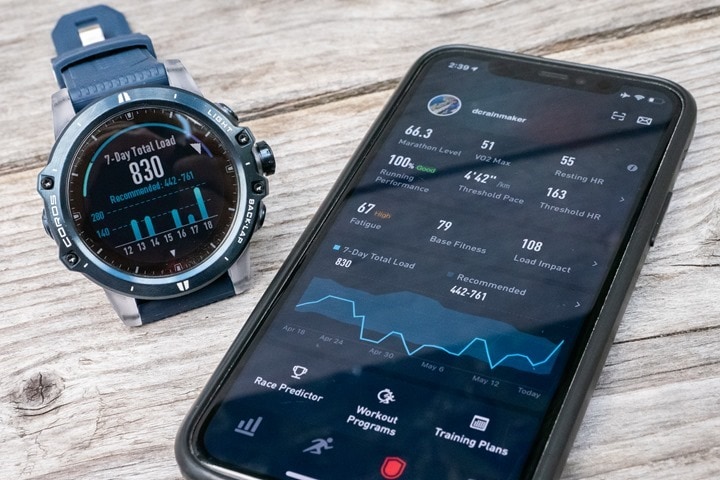
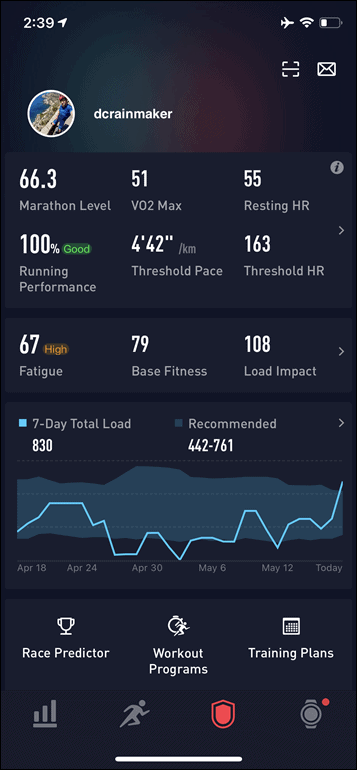
Looking at the core EvoLab metrics (non-running), they are as follows (with my score shown in parentheses):
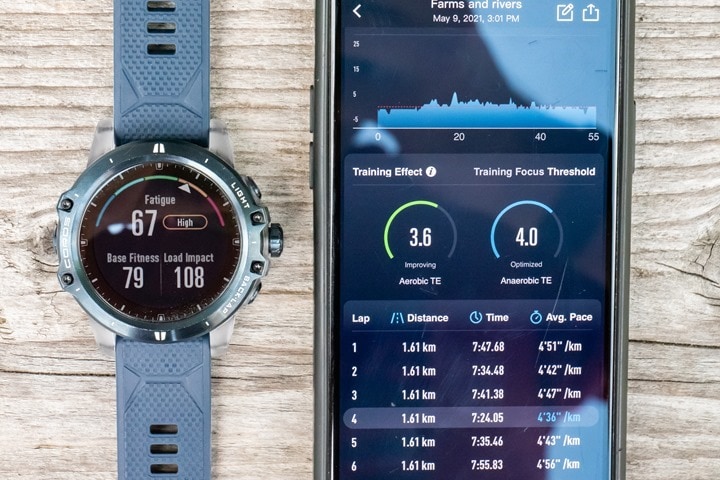
Fatigue (67): A score between 0-100, where the lower the score means the more ready you are for more training
Base Fitness (79): The trailing 6-week training load (higher means you can sustain more)
Load Impact (108): The impact of the last 7 days worth of training load (lower means you’ve rested more)
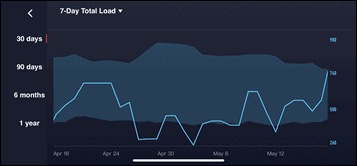
7-Day Load (830): Simply the last 7 days’ total workout loads added up
Recommended 7-Day Load (420-761): Basically the healthy range for me, based on the past ~42 days of data
In my case, my just finished 90-minute threshold trainer ride is what popped me slightly above the 7-day load. But over time, that 7-day load will adjust high, based on my training volume.
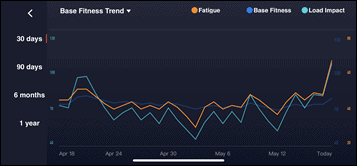
I can then tap on either of the two middle sections to get more detail, such as the base fitness trend or 7-day total load:
Or the 4-week intensity distribution:
Now, you probably didn’t even notice that the above two sets of screenshots are in landscape (horizontal). But every time you tap off the main page to get more details, it flips you into these landscape charts on your phone. Back and forth, forth and back, back and forth, forth and back. It’s stupidly frustrating, because it’s for every data metric you tap into, the phone switches between landscape and portrait mode, forcing you to rotate your phone. There are many valid places for turning your phone to landscape mode, such as deep-diving into the second by second heart rate and power zones of a workout, or watching Miley Cyrus on a Wrecking Ball. Merely seeing a quick glance at your 4-week training load? Not one of those.
Thankfully, COROS seems to agree based on my conversations, and hopefully this gets changed. And I know, it sounds silly – but as I’ve often noted about COROS over the years, it’s these seemingly minor user interface things that separate them from their bigger competitors.
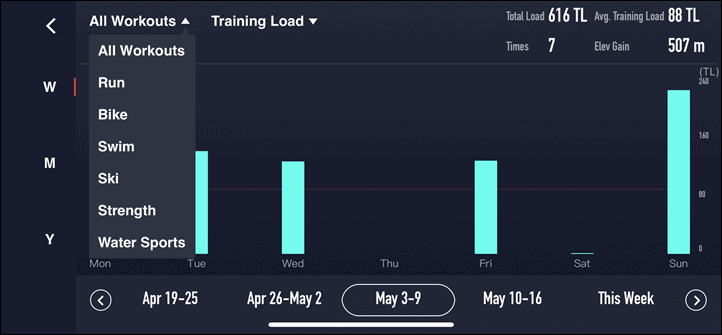
In any case, if you go back to your workout list (portrait mode), and tap ‘Statistics’, it’ll pop you back into the app in landscape mode to view this chart:
This is your week-by-week training load totals. This is handy for looking at historical data, though, I’d love to have one additional option at the bottom that says ‘Last 7 Days’, as that’s how many athletes look at training load (as does COROS on their other data pages). Otherwise, being Tuesday, I’m basically only seeing two lines this week, and the ‘average training load’ has a bug that seems to average it over the number of days (7) instead of over the number workouts. Though, perhaps it’s not a bug and is by design, but it’s kinda quirky that way.
So, at this point we’ve covered all the stats that are applicable to training load in general. Meaning, everything up till this point is available for runs or rides (as I showed earlier), even trainer rides. It’s still a bit fuzzy as to why any of this requires running specifically though as the eligible initial data set. So I went back to COROS on this, and asked Lewis Wu, their CEO to explain it a bit, here’s what he said:
“The real meaningful data in EvoLab is the valid points that the system picks during the run. The actual algorithm is quite complicated to describe. But to give you some examples, EvoLab wants to have your running data in the right time of your run (after warm-up), flat (filter out those with elevation changes), steady heart rate (filter out those with significant heart rate changes), reasonable duration (2 mins interval won’t qualify), etc. EvoLab wants to have enough valid data points before presenting the metrics to users. It’s not that we can’t display data earlier, but we feel 7 days and 150 minutes are generally enough for the system to collect data and present a fairly accurate assessment. Worst case scenario, if one user keeps doing the 2 mins interval every day, he may not get enough data after 150 mins. But generally people will mix their easy, tempo, interval and long runs during the week, so the 7 days and 150 mins rule will cover most people.”
That said, he then went on to note that they do plan to expand it down the road:
“Users have to have enough running data in the Run or Track Run mode to establish the initial system before they can use other features. This is a limitation of the system for now, but we plan to expand it to more workout types in future development.”
So hopefully we’ll see that shift to not being specific to running, but just general heart rate-driven load overall.
Running Specific Metrics:
So, now that we’ve established all the training load bits, let’s talk about the running portions. First, remember you’ll need that same list above of requirements for this running data to show up. To repeat that list again, you’ve got:
1) Data will not display until 7 days after your first COROS workout with the new firmware/platform
2) You’ll need to complete 150 minutes of running data on the new firmware/platform
3) That eligible running data can’t be hilly, intervally, or too easy
4) That eligible running data needs to be on flat, paved roads
5) Eligible run data needs to be in ‘Run’ or ‘Track Run’ mode only (not trail running modes)
For myself, living in the pancake-majority Netherlands, doing flat paved roadway runs is my jam…err…syrup. But I can see how if you fell into what COROS has focused on lately – trail runners and mountain folks – that this would be a bit of a disappointment.
In fact, to just get the disappointment out of the day, *none* of these metrics are available for trail runs or any sort of hilly conditions. All of them require you to use the ‘Run’ or ‘Track Run’ profiles, and all of them require flat terrain. Here’s the EvoLab running metrics:
- Marathon Level (overall stat)
- Running Performance (per workout stat)
- Race Predictor (overall stat)
- Running VO2 Max (overall stat)
- Training Focus (per workout stat)
- Threshold Zones – heart rate and pace (per workout stat)
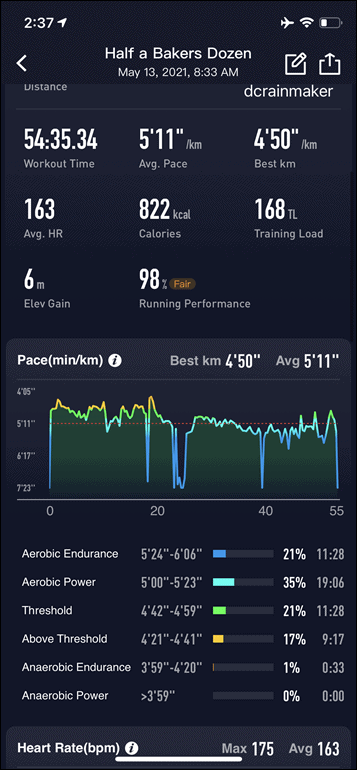
So first, let’s look at a steady-state workout from last week. This was just a simple 6.5mi/10.5km run at steady-state effort. Nothing fancy, perfectly flat ground. You’ll see at the top section I’ve got ‘Running Performance’ at 98% (Fair), and my training load at 168 for this run:
Then, if I scroll down below a ways I can see my Training Effect, which includes the aerobic and anaerobic breakout, as well as the training focus.
Those values are all per-workout based, and show up individually for each workout. Then I’ve got my ‘overall’ metrics, which account for my current existence beyond just a given workout, these are on the 3rd tab at the bottom that looks like a small badge:
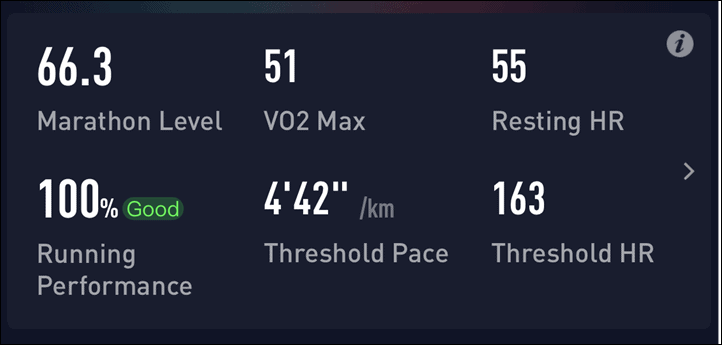
As noted before, my focus lately has been more on cycling than running, so I haven’t got a ton of really deep running workouts to drive these numbers higher. Nonetheless, you’ll see my marathon level (66.3), my VO2Max (51), and my Running Performance (100% – Good).
The Marathon Level stat is described by COROS which “measures how good you are as a runner on the flat road marathon distance based on workout history, VO2 Max, threshold zones, running efficiency, and more. A higher score means you will complete a full marathon faster than when you have lower scores.”
Meaning again, it’s focused purely on flat data. That’s not actually that unusual, and is exactly how Garmin does their marathon predictive times. In COROS’s case, they bucketize these times a bit though:
Beginner (0-40): Completes a full marathon in over 5 hours
Recreational (41-60): Full marathon between 4-5 hours
Intermediate (61-70): Full marathon 3.5hrs to 4 hours
Advanced (71-80): Full marathon between 3 to 3.5 hours
Elite (81-100): Full marathon 2-3 hours
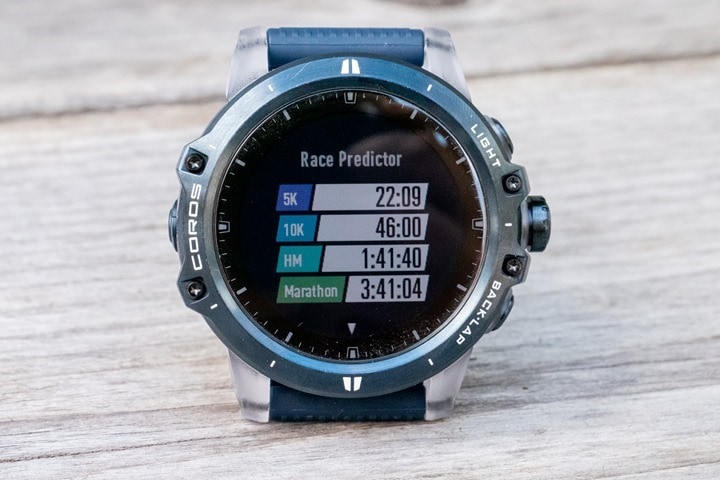
Now at present, COROS is rating me at 66.3 (3.5-4 hours, specifically it then shows 3:41:04), based on my recent runs. For the data set it has, that’s probably an accurate guess. These algorithms thrive off of threshold workouts, especially longer duration ones. Most of my interval work has been on the bike lately (so that doesn’t count), and the run workouts have largely been 400m or 800m intervals. For example, Garmin’s current running race estimator puts me at a marathon time of 3:48:25. In both cases, I suspect if I were to go out and do some mile repeats, both would shift considerably downwards. Interestingly though, Garmin seems to do a better job in capturing the shorter duration work, as my estimated 5KM and 10KM times are a few minutes faster on Garmin than COROS.
Next, there was the V02Max level, which COROS says is 51. That’s an abnormally low VO2Max value estimate for me, and considerably below what Garmin or Polar hit, which currently shows 56 for running.
Finally, there’s the Running Performance metric, COROS describe this as a “[measure of] how good your last workout is compared to your Marathon Level in a range from 80% to 120%. Over 105% means you are outperforming yourself and likely to peak in races.” So you saw my current level at 100% means I’m in theory fairly balanced.
Oh – and as you probably noted via the header shots for each section in this post, the majority of these stats are available as widgets on the watch itself for a quick glance without accessing the app.
Wrap-Up:
Ok, so there ya go – a not-so-quick look at the new COROS EvoLab metrics. Overall, it’s a good first step towards things. Most of what we see at this juncture is essentially taking per-workout training load values based on your heart rate, and adding them together to give you a total load picture. On the running side, they’re doing a bit more for steady-state and flat runs, to give you some predictive analysis there too.
Again, understanding this is a first step towards things – it’s a good start. However, I think one of the challenges with where the running components are specifically is that there’s a huge dependency on your initial eligible runs being on flat ground and steady-state (not intervals). For a company that’s arguably built the majority of their elite sponsorship, ambassador and influencer base, and marketing efforts around trail running (in the mountains), it’s a tricky aspect to mesh. I mean, sure, for me, it’s great. I couldn’t find a meaningful hill to climb around here if I tried. But for others, they’re going to have the inverse problem. And for cyclists, virtually all new metrics here are useless unless they go out and run far more than most pure cyclists will ever consider running.
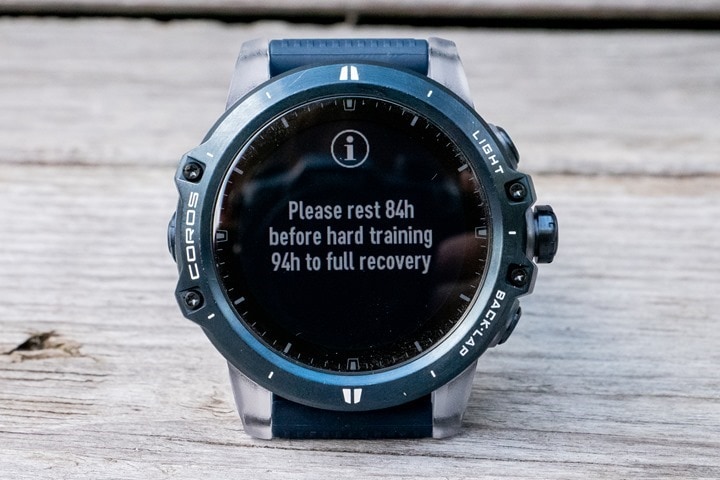
And all of that then ignores that the recovery part of things, which while there today, is pretty basic. It currently says, based on the last few days of workouts, that I should recover for the next 94 hours…or, basically 4 days worth of doing nothing. Well, technically it says I should do nothing for 84 hours, and then can consider doing something at that point. Garmin meanwhile says 36 hours till next hard workout, which is about right given I just finished a 90-minute threshold trainer ride.
Still, like any company getting into this space, you can’t start with having every feature. You’ll need to build into it, step by step. And to COROS’s credit, they’re building through those steps faster than most of their competitors. For example, Wahoo doesn’t have any training load or recovery metrics for their RIVAL watch. And Suunto only just recently started to resume filling out some of the training load metrics. So each bit helps, and focusing on the biggest bits as COROS did today makes sense.
With that, thanks for reading!
Found This Post Useful? Support The Site!
At the end of the day, I’m an athlete just like you looking for the most detail possible on a new purchase. These posts generally take a lot of time to put together, so if you're shopping for the COROS Pace 2, COROS APEX Pro or COROS Vertix or any other accessory items, please consider using the affiliate links below! As an Amazon Associate I earn from qualifying purchases. It doesn’t cost you anything extra, but your purchases help support this website a lot.
And of course – you can always sign-up to be a DCR Supporter! That gets you an ad-free DCR, access to the DCR Shed Talkin' video series packed with behind the scenes tidbits...and it also makes you awesome. And being awesome is what it’s all about!








Just to clarify on Ray’s words:
> This update is partially on the app side, and partially on the watch side. They’re supporting the COROS Pace 2, APEX, APEX Pro, and Vertix (with essentially the original Pace being left out).
The first generation Pace users will actually get all these features, but only on the app.
link to youtu.be
Good to know, they had said in all their pre-announcement materials to press that the base Pace wasn’t included, so good to know!
Thanks Ray as always. You made a good point that they can’t just jump in and throw too much new stuff. I was excited to see what they would have and was a bit disappointed as a Garmin user we’ve been spoiled with this data for a while. being ready to invest in a new watch I am excited to see what Garmin will be able to deliver. Especially, since their acquisition of FirstBeat they likely can push the data even further with Body Battery, Training Effect and Training Status. I would love to see Garmin add native power to the watch like Coros and Polar have done and use that metric more towards training effect and status. Being a stryd user I hate seeing unproductive after a run when I have been following a power-based plan and follow it to a tee.
Was that all from Coros? I was expecting an announcement for a new watch or web application! :(
Technically there is a web application behind the scenes here. ;)
And there’s also new hardware too: link to dcrainmaker.com
I prefer a firmware improvement which give us new functions for the whole range rather than having to buy a new watch ….
Hey Ray!
Your rest HR looks a tad high at 55. Is it a correct value? Or is COROS still plugged by the issue they had for years when rest HR is picked randomly throughout a day and is way higher than plenty of resting periods?
Related, do they let you change your rest HR in settings, or you must wear a watch to hope to get a decent value? Given it plays a role in their training load calculations, a difference between 40-44 and 55-58 could be quite material.
Thanks a ton for clarifying for the rest of us.
No, in this case i was just wearing the COROS watch for my workouts (+/- a few hours before/after), so it wouldn’t have any an opportunity to get my proper resting HR.
Note that in this case, it’d be slightly higher with RHR being in the formula, but not massively so. Garmin has me lately at 48 or so per their values (though, my HR goes lower than that at sleep).
Just plugged 40 vs 55 RHR along with the formula above into Excel assuming max HR of 180 and 60-minute run with an average HR of 140. The difference came to be 120 vs 101. In other words, a correct (for me :) ) RHR would result in nearly 20% higher training load. I think the difference is very material.
What’s worse, is the random nature of COROS RHR picking even when the watch is worn 24/7. It’s one thing when they simply reported RHR somewhat higher. It’s a different thing when the number jumps around drastically from day to day.
They kind of accomplished a reverse WHOOP with this one.
I know what you mean, but I think the way RHR jumps day to day is real. I think I’ve found the way the COROS algorithm works:
Throughout the day the watch measures your HR every 10 minutes. You can see this on the watch, the shown HR value changes each 10 minutes. In the app, when you check the Heart rate data, for each half-hour window it displays Max, Min and Avg. For me, daily RHR value equals the lowest 30-minute average value measured throughout the day. This changes day-to-day, so that is why you see a slightly different value each day. In my case the spread is +/- 5 bpm.
What I really miss is the RHR average, which might be what you meant by your criticism. You can see the plot of RHR datapoints, but there is no 7-day or 30-day average. I don’t understand why, the data is there, it must be really easy to implement. It would also help see the RHR trend more clearly (has it been much higher than average in the last 2-3 days? am I getting sick?) which I think is what most people want to see, not just the absolute value.
yes HRrest (RHR) varies and it is different to HRmin. and it can vary quite considerably from day to day.
it can be a reasonable inverse proxy for HRV ie it can reflect your fatigue
so readers might ask if it is valid to always use a dynamic “today’s HRrest” in which case your HR zones will vary every day…sometimes by the levels that Nick (further above) shows.
that seems reasonable to me and has troubled me for about 10 years!
but is daily varying hr zones based on any kind of science? IDK, probably not.
If it is either reasonable or correct then you have to question the methods used by pretty much every sports data platform!
just a thought.
[Typo toward the end. Unless you’re leaking that the Wahoo RIVLA is going to be the successor to the RIVAL.]
Thanks!
Still not quite enough for me to buy a coros (to go along with my garmin and polar watches). They really need to figure out a way to intertwine, sleep, daily strain and workout stress. Garmin obviously leads in that category with polar close behind (and Suunto possibly being right there with garmin now in looking at all three aspects of stress and recovery). Otherwise all these workout strain and recovery scores really mean nothing unless your a pro athlete who has an extremely structured life and training stress is the only form of strain your body goes through each day. Still as mentioned it’s a good step. Hopefully more to come from coros. It’s so important to have companies like coros around in order to push innovation and also more specifically to keep garmin from just way over pricing their watches any more then they already do.
Is it just me, or do some of this features look an awful lot like on Garmin‘s platform (like Aerobic/Anaerobic TE and Recovery Time)…? I mean, yeah, metrics are the same everywhere (like Vo2Max, for example), but even the graphs and the inscritptions are almost the same… It seems like the FR235 copy all over again.
Indeed, there is often a lot of similar mirroring.
Hi Ray,
thanks for these insights. I like competition but I hope these values prove to be meaningful in the long term.
One question however: In the second paragraph you’re writing that you did compare Coros to Garmin and Polar but all I can see from Polar so far is the VO2max estimation. This could be very interesting since Polar is also using TRIMP, just like Coros.
Good call, just added in the Polar Verity Sense Cardio Load numbers for the days it overlapped. Forgot it for today’s ride.
Why has Coros still not come up with a web based interface that can be accessed via a web browser?
“Now, you probably didn’t even notice that the above two sets of screenshots are in landscape (horizontal). But every time you tap off the main page to get more details, it flips you into these landscape charts on your phone. Back and forth, forth and back, back and forth, forth and back. It’s stupidly frustrating, because it’s for every data metric you tap into, the phone switches between landscape and portrait mode, forcing you to rotate your phone. There are many valid places for turning your phone to landscape mode, such as deep-diving into the second by second heart rate and power zones of a workout, or watching Miley Cyrus on a Wrecking Ball. Merely seeing a quick glance at your 4-week training load? Not one of those.”
To be fair, they have started such an interface (see attached). But whether or not we’d ever see it expand to include training load and such, I don’t know. I suspect they’re taking a page from Wahoo’s book that says you don’t need one. Though, Wahoo’s own careers site seems to imply Wahoo’s looking to take a page from Garmin and Polar’s books. Who knows…
Ah, that’s good to know. Let’s hope they can find some time to expand on it. Mouse and big screen is so much better to consume data, especially graphs. Must be hard on Coros playing catch up, but hey seem to be doing a decent job.
My question is do you trust the Coros HR reading enough for this data to be useful? Until reviews report reliable HR data, I can’t consider Coros
I don’t get this criticism. I read DC’s reviews before buying COROS and sure enough, it’s comparable to Garmin in normal conditions. For anything more demanding like intervals, you want HR strap anyway… there are arguments for not getting into COROS but HR reading on the watch is certainly not one of them in my opinion
Agree, I don’t see optical HR as dramatically different on the COROS units from Garmin/Polar/Suunto. As always, each company has certain edge cases that work better/worse, but not enough that it’d likely factor into my choice between COROS and Garmin.
Plus, you can always use a chest strap (or another optical sensor band/brand if you want).
I wondered if this would affect my plans to go back to Polar, or maybe Garmin, but probably not. I run a lot off road and on hills, and road work is slow or short intervals, so I’m not sure what I’ll get out of this. I’m not sure I trust the app anyway, my V02max has been at 53 since early December and I’m pretty sure my fitness has fluctuated in that time (my indicated threshold pace have jumped about a lot in that time between 7:21-8:08m/mile).
Possibly the interval sessions aren’t relevant also as I’ve recently gone back to my M400 or fr235 for those, so they don’t got recorded on my Apex. The Apex seems to tell me I was doing 20 seconds ago, which isn’t always of any use.
I also miss the ability to highlight section of a run on Polar Flow to get an overview of how I performed, or the segment function in Connect. I guess we all look for different things, but I found those useful. That should be doable on a phone app.
Hi Ray. Please answer me, can I receive messages and calls on Coros watches during an activated workout? I do not mean to speak and write, as on Apple or Samsung, just to find out who is looking for me! I asked this question in other articles with Coros, but they may have gone unnoticed!
Yes, it’ll show you text messages and incoming calls, as simple smart notifications.
during an active workout? it tells me it’s not possible.
hi @Ray, sorry to come back on this, but is there something in the settings which would allow receiving notifications during an active workout? I only get them during normal daily use, but they stop once I begin a workout. which makes sense of course but some priority notifications would still be useful… thanks!
Ray,
I’m curious about an issue because you usually don’t fail to miss hugely important details like this. However, it seems you have totally missed that Coros has released the Coros Pace 2 Speed Series watches including the Track Red model otherwise known as the DC Red model. What gives? I assumed you’d own the DC Red Model by now and be showcasing it? Please do better! lol
Sadly, no such red hot-shot model made the UPS track to me. It does look nice, though, it’s kinda hard to tell if it’s a bit pinkish in some photos. Lava is good for me, but pinkish is potentially challenging for my wrists.
Definitely hard to tell from the photos but doesn’t appear to be the bright red used on the new charging cable. White is even hard from me and pink a sure non-starter.
Initially, I thought the 150-minute minimum of “normal” running would be a bit of a hassle, because I live at the top of a pretty significant hill (a few hundred feet). But with the ability to “dump” runs from EvoLab via the editing function, couldn’t you just break your run into pieces? Then you’d include the flatter, more mellow, portions as their own runs in EvoLab, and discard (in my case) the very hilly beginning and end of each run? And for anyone doing any sort of decent training, it seems like this process would only take 2-4 days (which it doesn’t appear need to be continuous). If you’re going to the effort of using EvoLab, this doesn’t seem like too big a sacrifice (famous last words).
I’m intrigued to see how the metrics work out (just downloaded the beta).
An updated comment (just a few moments later): I downloaded the beta and updated my watch firmware, and the EvoLab information is already fully populated. It looks like the software just kicked itself off using all the information already in my workout log. Who knows how accurate that will be, given the earlier comments about hilly/flat terrain.
Looking at the initial load values and race predictions, though, I think they look reasonably accurate (i.e., just from recent workout performances, I’d put myself about where the software says for the 5k and 10k, and the half-marathon and marathons would be reaches, but possible).
Thanks for the review Ray, much appreciated and useful as always! Quick question about Coros, not related to this update: do know if 2 separate Coros watches (for example a Pace 2 and an Apex), with 2 different users, can be connected and download their data to 1 single phone? I guess that would mean the app on the phone being able to switch from one user profile #1 to user profile #2 and viceversa. Do you think that’s possible?
You can add multiple devices to the Coros app, yes.
Sorry, just realized you also asked about 2 different users. While I haven’t tried, I think this is possible, but you might have to log out/log in every time you switch users. There is an account that you create with Coros that is tied to an email, and you log in with it in the app.
I would recommend contacting Coros support, I have had good experience with them responding to questions.
No way to do two different users on one phone, nor two users on one watch. Nor two phones to one watch.
As Juraj noted, you can do multiple watches to one phone (within the same account), but that’s, unfortunately, the opposite problem you have. One thought, is if you have an iPad or tablet or such, that might act as the base for the other watch?
Interesting. I just tried to create a dummy account, logged out of my real account and logged in with the dummy account in the app (on the same phone). Worked without a problem, it showed no data (correct) and gave me an opportunity to add a device (I don’t have a second watch so I couldn’t test it).
Sorry, I presumed the question would be concurrently synced. Yeah, you can log in/out, though I don’t know how pairing per-account works, as the serial number would be tied to a given user I’d assume, until tied to another user?
I thought Bryan meant two people each with their separate device, syncing to one phone (and not at the same time). That could work I think. If it were two people sharing one watch and one phone, then I am highly doubtful as to how would that work
Hello Ray, I know two very different watches, but are your comments on this comparable to those about the G SHOCK GBD H1000? I remember there they used firstbeat data but it was useful only for running and hill running etc would disrupt the analysis later on. Am I right in this interpretation of your comments for this feature on COROS and the GBD H1000?
Thanks.
No, it’s quite a bit different there.
With the GBD-H1000, you can’t specify that a ride is actually a ride (and not a run). So it thinks *EVERYTHING* is a run. So if you go for a ride, it thinks it’s a run, and dorks all your run stats up (since you don’t normally run at say 25MPH/40KPH).
No issue with that on COROS, as they separate it all out.
Hello. Do you know when Coros will improve on their pushed workouts from TrainingPeaks. At the moment it puts intervals as “sets” and it is very confusing to see how many intervals you have left in your workout. Im hoping it will be a small but helpful improvent that may come with this EvoLabs update.
I have noticed that the resting heart rate data does not import into Apple Health from the Coros App. Will this change with the update? I am using the Pace 2
Did the update remove the stamina feature? I cannot seem to find it anymore.
Sorry if this is covered but I must be missing it if it is. I have imported over 1979 activities from Garmin to Coros. on the Training Status page the data only seems to go back 12 weeks. However, my activity list data goes back to 2013. How can I make my Training status pick up the full scale of the data and show a more accurate Base Fitness picture please?
Ich befinde mich seit 3 Tagen im Coros Kosmus ( sonst Garmin Epix2) und habe viele, viele Fragezeichen im. Kopf bezüglich Trainings / Bewertungen etc…. aber ich lasse mich mal darauf ein, die nächsten 12 Wochen und ziehe dann mein Fazit. Bis dato denke ich ” ok, die müssen wirklich noch extrem nachlegen um die die Sache wirklich rund zu machen ” ( Habe der zeit die coros Apex Pro2 ) Danke für den Artikel und die Videos –> You Tube ) Gruß