(Hey folks, DCR here. It’s incredibly rare that you see guest posts here, but today I’ve got a special one, from Shane Miller of GPLama fame. As you probably know, he’s deep into all things sports tech as well, and he’s been doing cool Strava Insights pieces on YouTube for a while. We figured taking a closer look at Kona this year and the devices being used would be super cool. With that – enjoy!)
For the past year I’ve been performing Strava data gymnastics looking into GPS head units people have been using across a multitude of events. This has quickly developed into an overall statistical snapshot of any event uploaded to the platform. From Ride London, to Boston and London Marathons, through to the Ironman 70.3 World Championships in Chattanooga. I can’t quite explain my fascination with the data, but since others have found it interesting, I’m continuing to run with it…. so to speak.
Onto Kona…
The annual Kona bike count has become a very popular reference point to analyze trends and see what the professional and top level age groupers are using for the Super Bowl of swim, bike, run.
These bike (and now full equipment) counts are the tireless work of a few eagle-eyed and very dedicated individuals who spend a number of hours recording and collating what’s on show at Kona on the Big Island of Hawaii. This is without a doubt one of the most comprehensive accurate equipment reporting I know of across any top level sport. Let’s be honest, Ironman isn’t just a ‘bat and ball’ sport, there’s a lot of equipment involved.
The only limiting factor with the bike/equipment count is it only covers “what they have”. Sport is rarely about what you have, it’s all about what you DO. Getting the “what they do” data is a little harder. Thanks to Strava, we can now put our finger pretty closely on the pulse, literally, of Kona athletes.
“If it’s not on Strava it didn’t happen” – An often heard quip in cycling that has spread across almost any sport that can be uploaded and tracked on the platform. So while not everyone uploads everything to Strava, and with some athletes choosing to keep their activities private, there is a growing trend in recent years for Ironman athletes at Kona to upload their activities to have their epic feats of endurance on show forevermore. Well, that is assuming Strava stays around that long.
The number of athletes at Kona uploading to Strava 2012-2017:
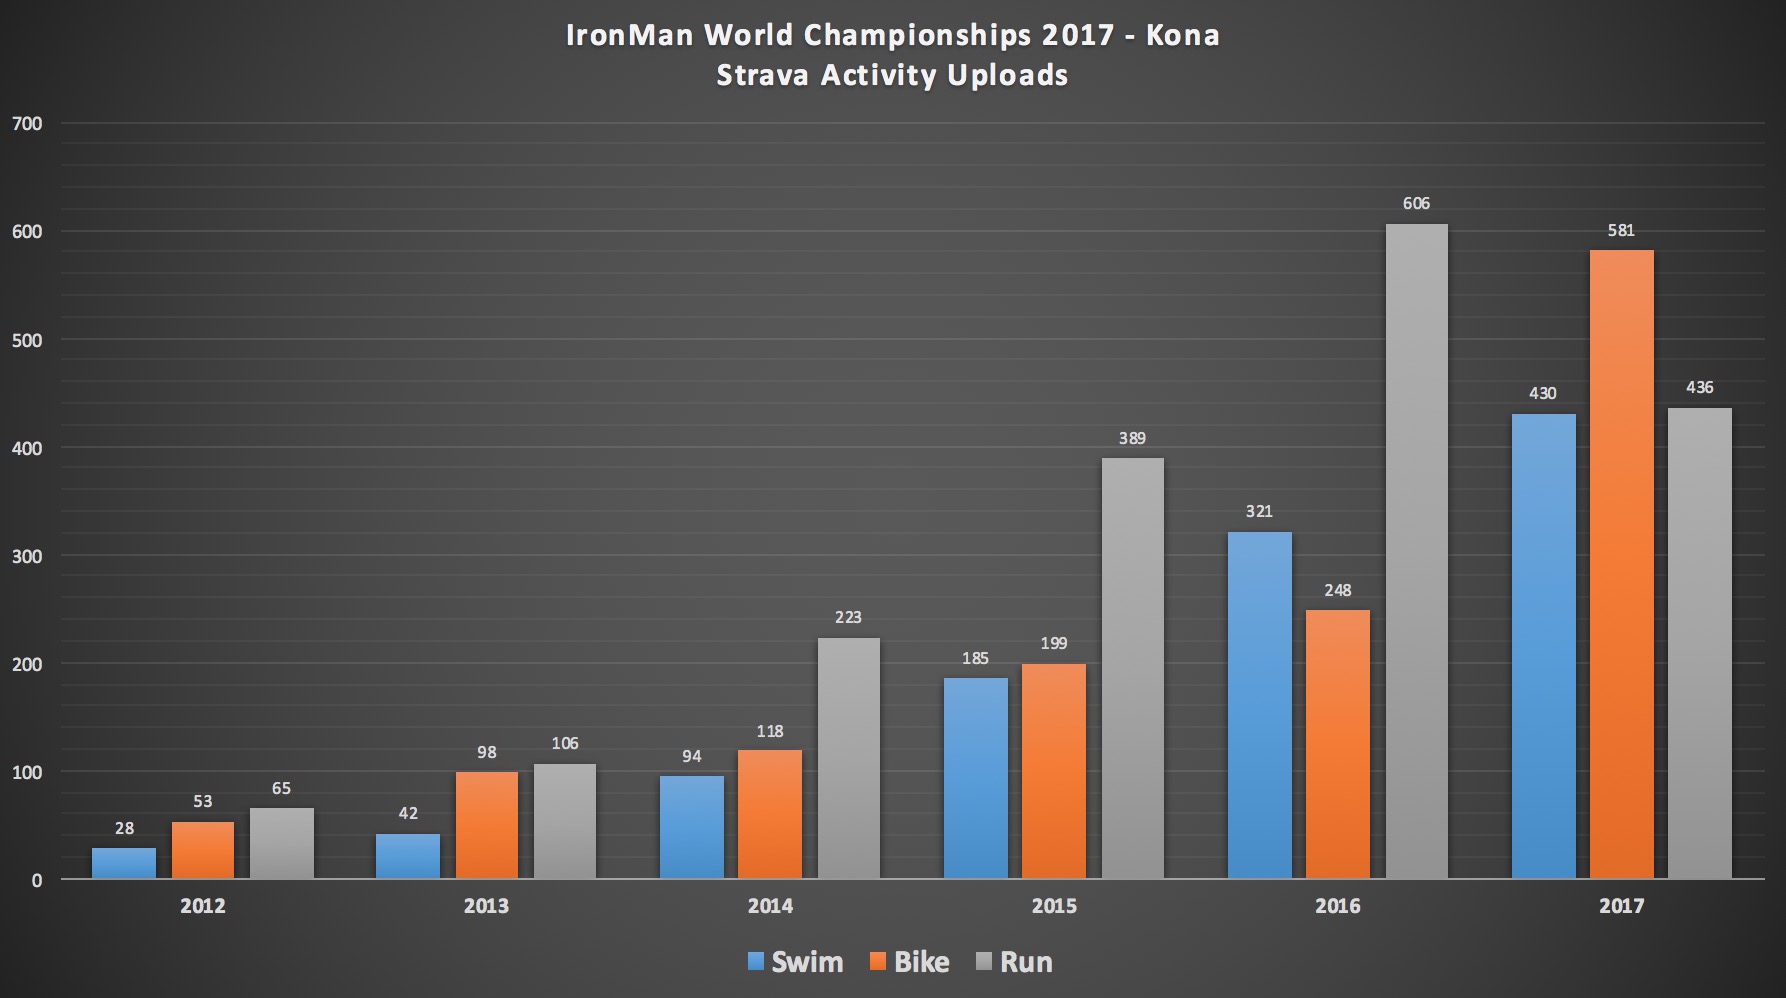
Given the 2017 Championships were only a few days ago, the statistics here will be likely missing a handful of athletes still searching for a wifi hot-spot to upload. Maybe they’re still out celebrating. Having said that, we’ve still have a pretty solid sample set to look into.
This data has been sourced from publicly accessible Strava activities. Data anomalies have been corrected/removed where possible (no, you didn’t ride 9,970km in the bike… and no, you didn’t do 414W for 180km). Athletes can choose to keep their gender private, so the totals will be different to the Male + Female + Total numbers. This data will also differ slightly in ‘what they have’ compared to the actual equipment counts. It’s highly likely athletes with all the gadgets (power meters) are more likely to upload to Strava than those who don’t.
Now, we’ll get right to the text and graphed data in a moment, but if you want the run-down in my typical YouTube fashion, we’ve got that right here:

Otherwise, on with the show!
The Data:
Right… with that out of the way, hopefully this is what you’re here for.
Kona 2017 Activity Count Uploads:
These are the total uploads to Strava as of Tuesday mid-morning Hawaii time. Here’s the breakdown of upload counts first by sport:
Swim:
Total: 430 (17.8% total entries)
Male: 312
Female: 96
Bike:
Total: 581 (24.12% total entries)
Male: 417
Female: 133
Run:
Total: 436 (18.1% total entries)
Male: 334
Female: 80
It’s probably somewhat unsurprising that the number of bike uploads is the highest across all three sports, given that Strava started off with cycling being its primary sport.
Average Pace, Power, and HR and More:
Next, let’s take a look at the average paces, heart rates, power numbers, and even speeds of athletes. Again, keep in mind that the gender-specified numbers are only if the individual specified their gender on Strava.
Swim
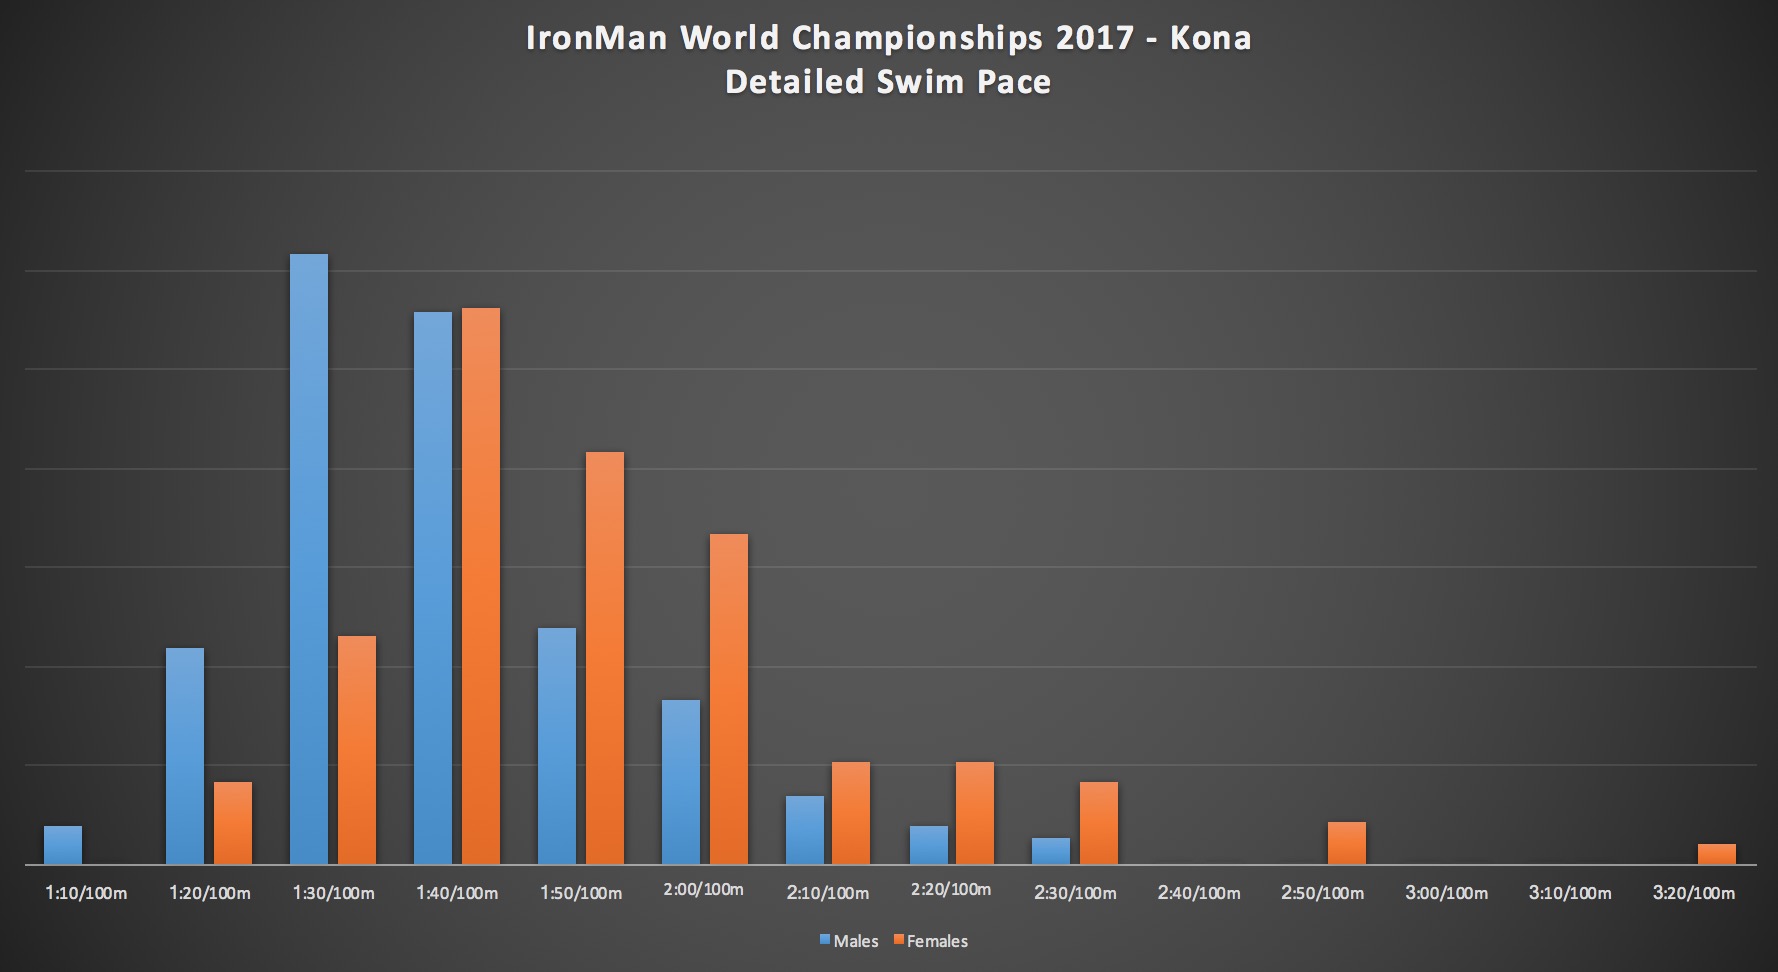
Average Swim Pace: minutes/100m
Male: 01:43/100m
Female: 01:59/100m
Bike
Power Meter Usage (Bike):
Male: 63.79%
Female: 63.91%
Average Power (Bike): Watts
Male: 185.10 W
Female: 144.31 W
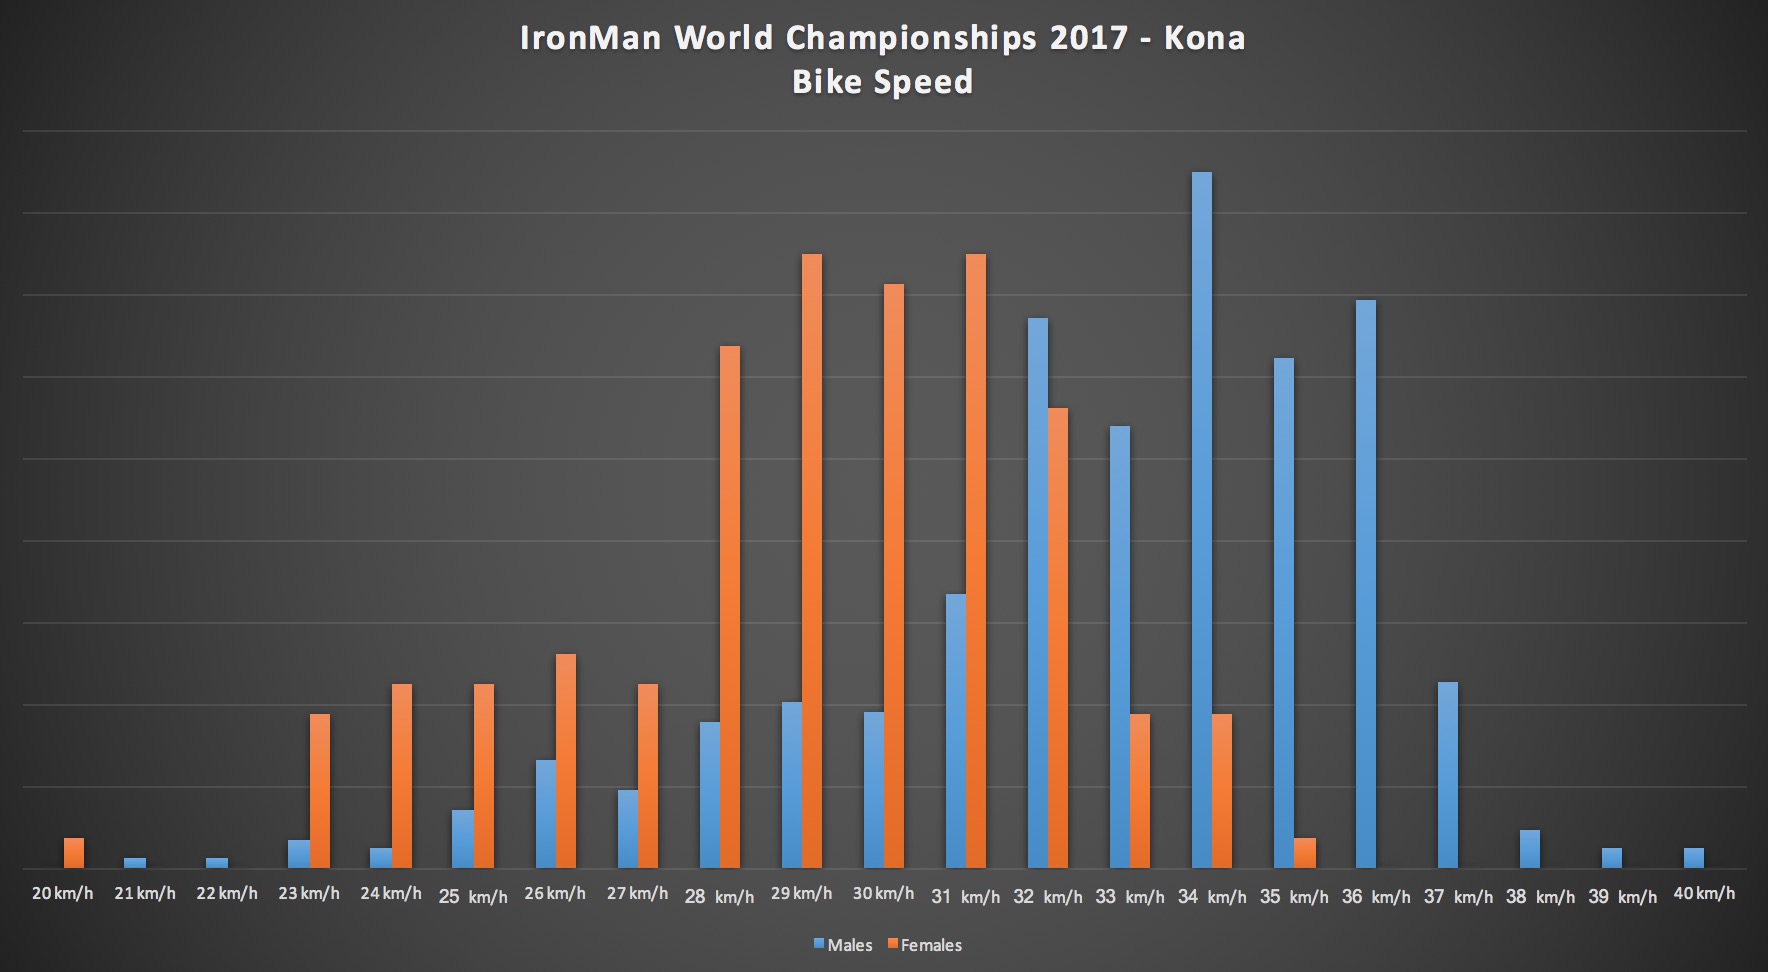
Average Speed: km/h (mph)
Male: 33.39km/h (20.75 mph)
Female: 29.57km/h (18.37 mph)
Heart Rate Monitor Usage (Bike)
Male: 72.18%
Female: 59.40%
Average Heart Rate (Bike): bpm
Male: 142bpm
Female: 142bpm
Run
Average Run Pace: minutes/km
Male: 05:35/km
Female: 06:01/km
Heart Rate Monitor Usage (Run)
Male: 75.15%
Female: 62.50%
Average Heart Rate (Run): bpm
Male: 142bpm
Female: 141bpm
I thought it was interesting how very close the men’s and women’s average heart rates were for the run, that’s kinda cool – despite being 26 seconds/kilometer difference in pace. And in the case of cycling, the two heart rates were identical. Of course, power numbers would vary, and since we don’t know the weights of everyone on Strava (it’s not a supported parameter), there’s no way to do watts/kilogram.
Here’s how athletes bucketized in terms of pace, first with swim pace:
Next, cycling speed:
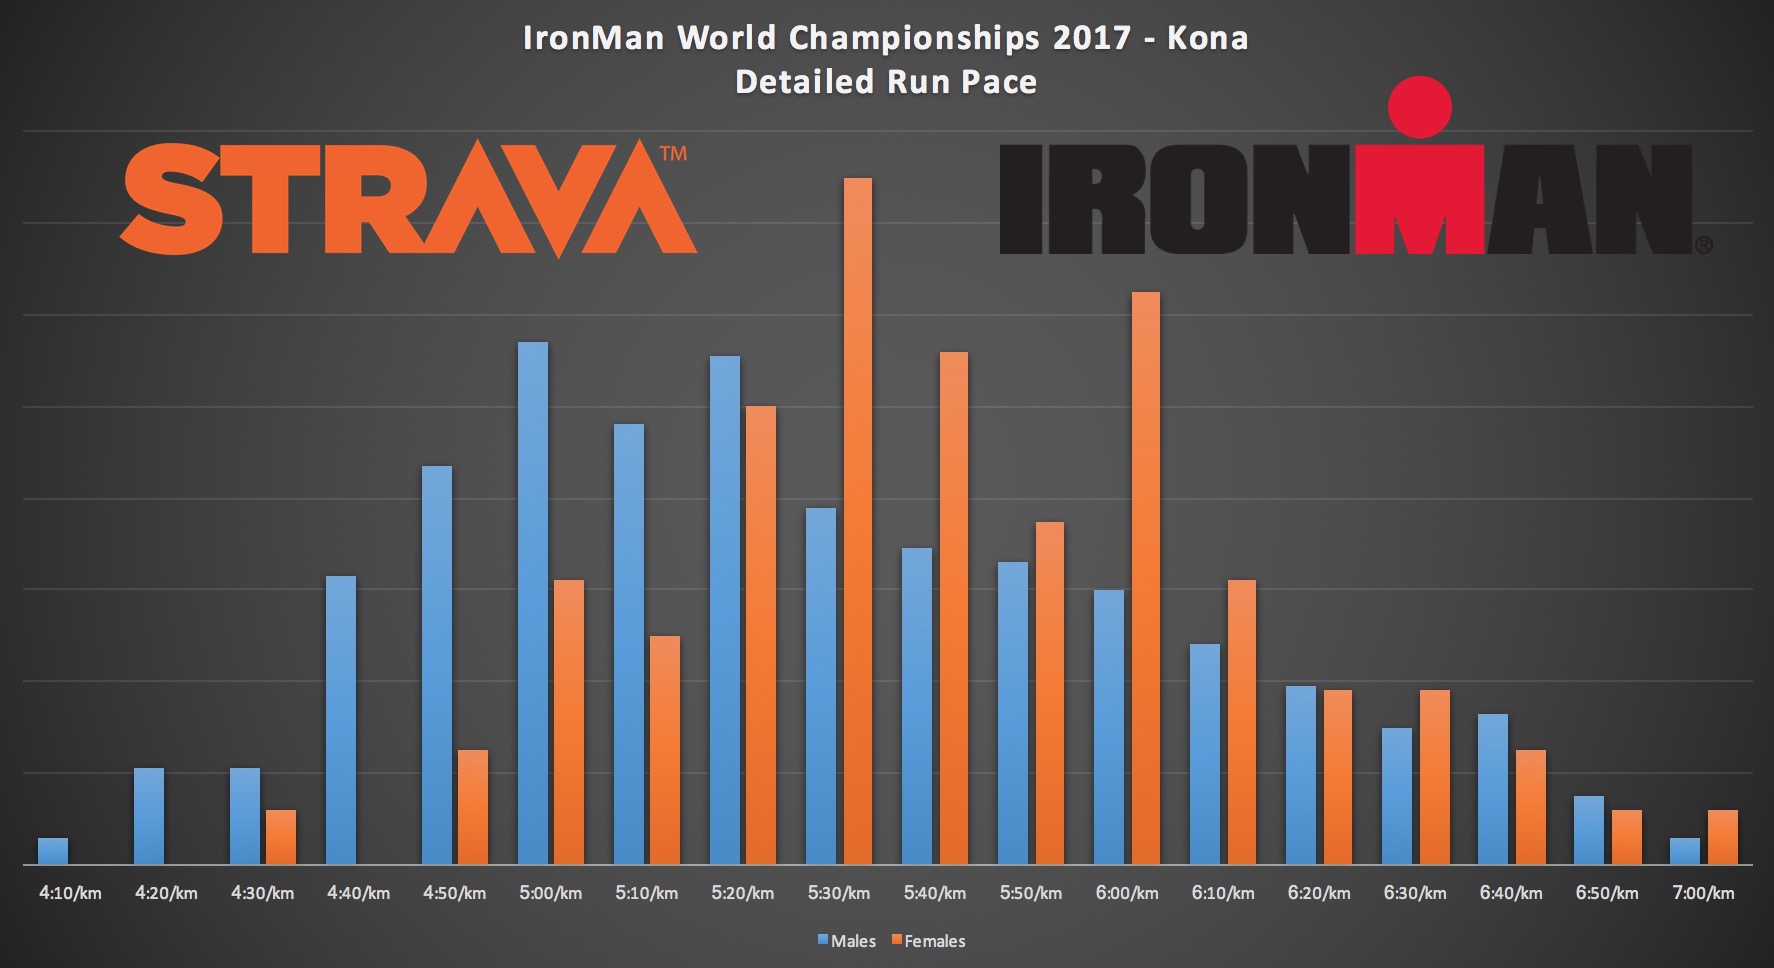
And then run pace:
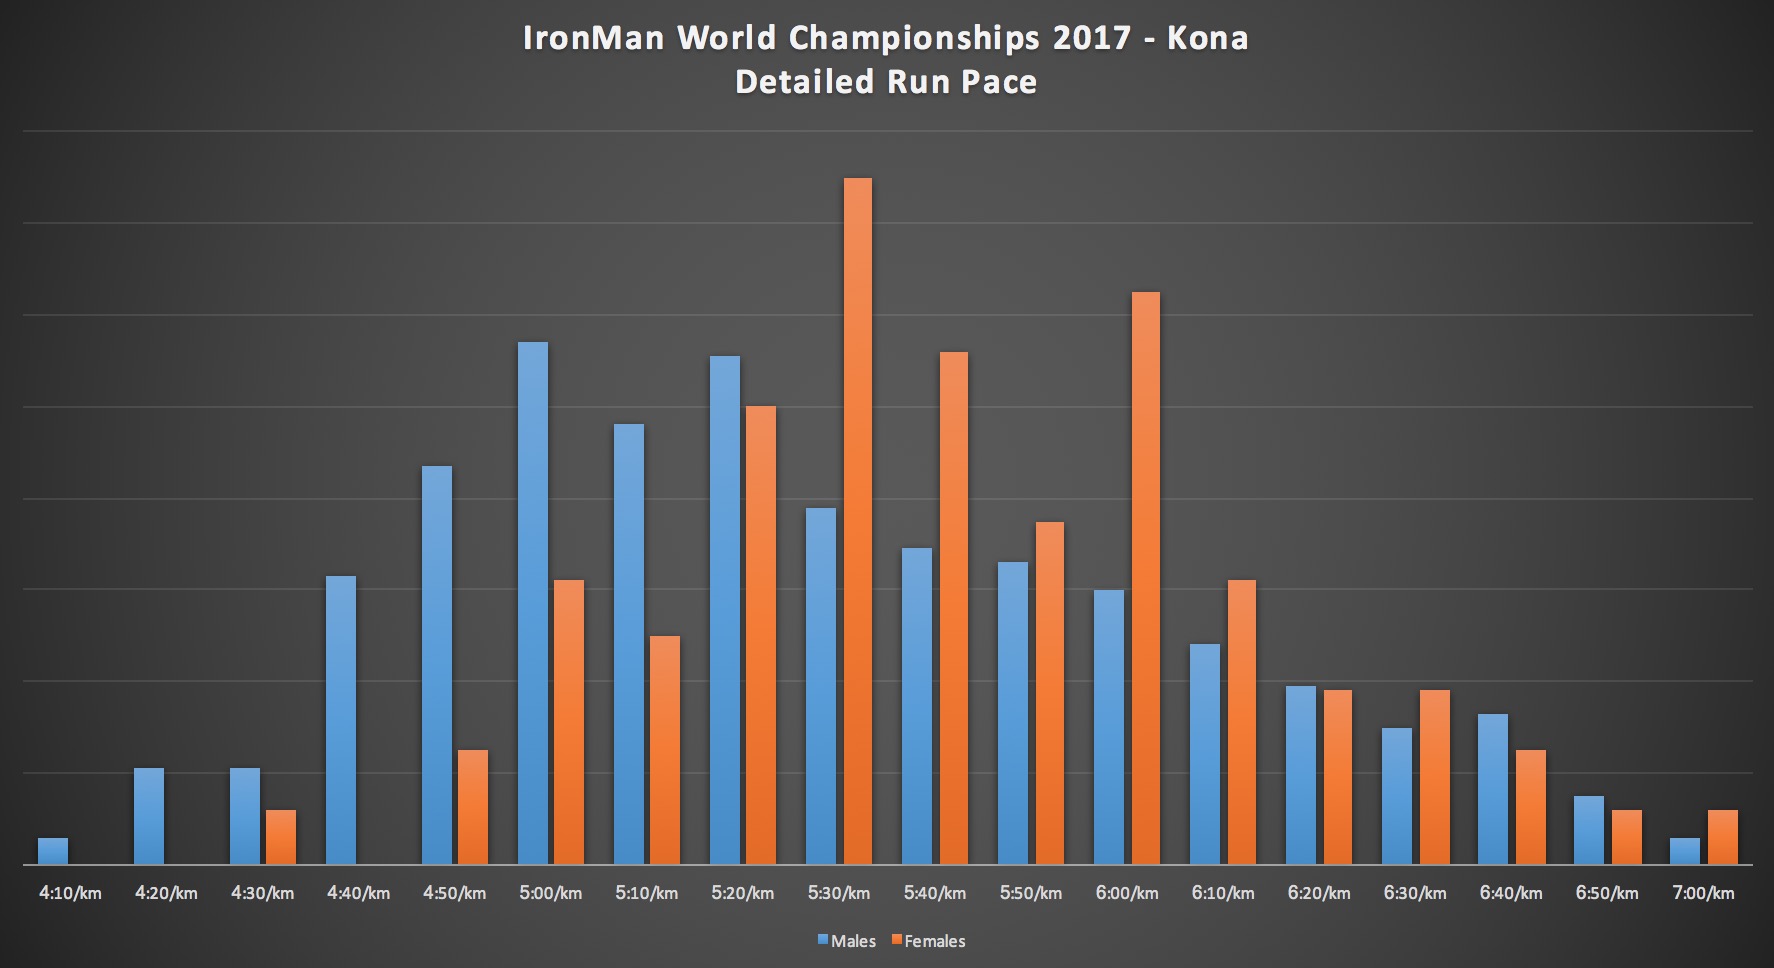
A pretty even distribution over the entire time plot, with what is likely some pros on the left side, and then you see the rush of everyone else after that point.
GPS Devices Used:
Ahh yes, what you’ve been looking for – the breakout of devices used! It’s like the Kona Bike Count Power Meters breakouts, but for watches and related. Here’s the raw data. Again, remember this is only for people that uploaded. You could roughly multiply this times four to get the actual ballpark numbers (assuming trends stayed constant, and they largely appeared to throughout the 3 days since the race concluded).
All athletes (M/F/Unlisted)
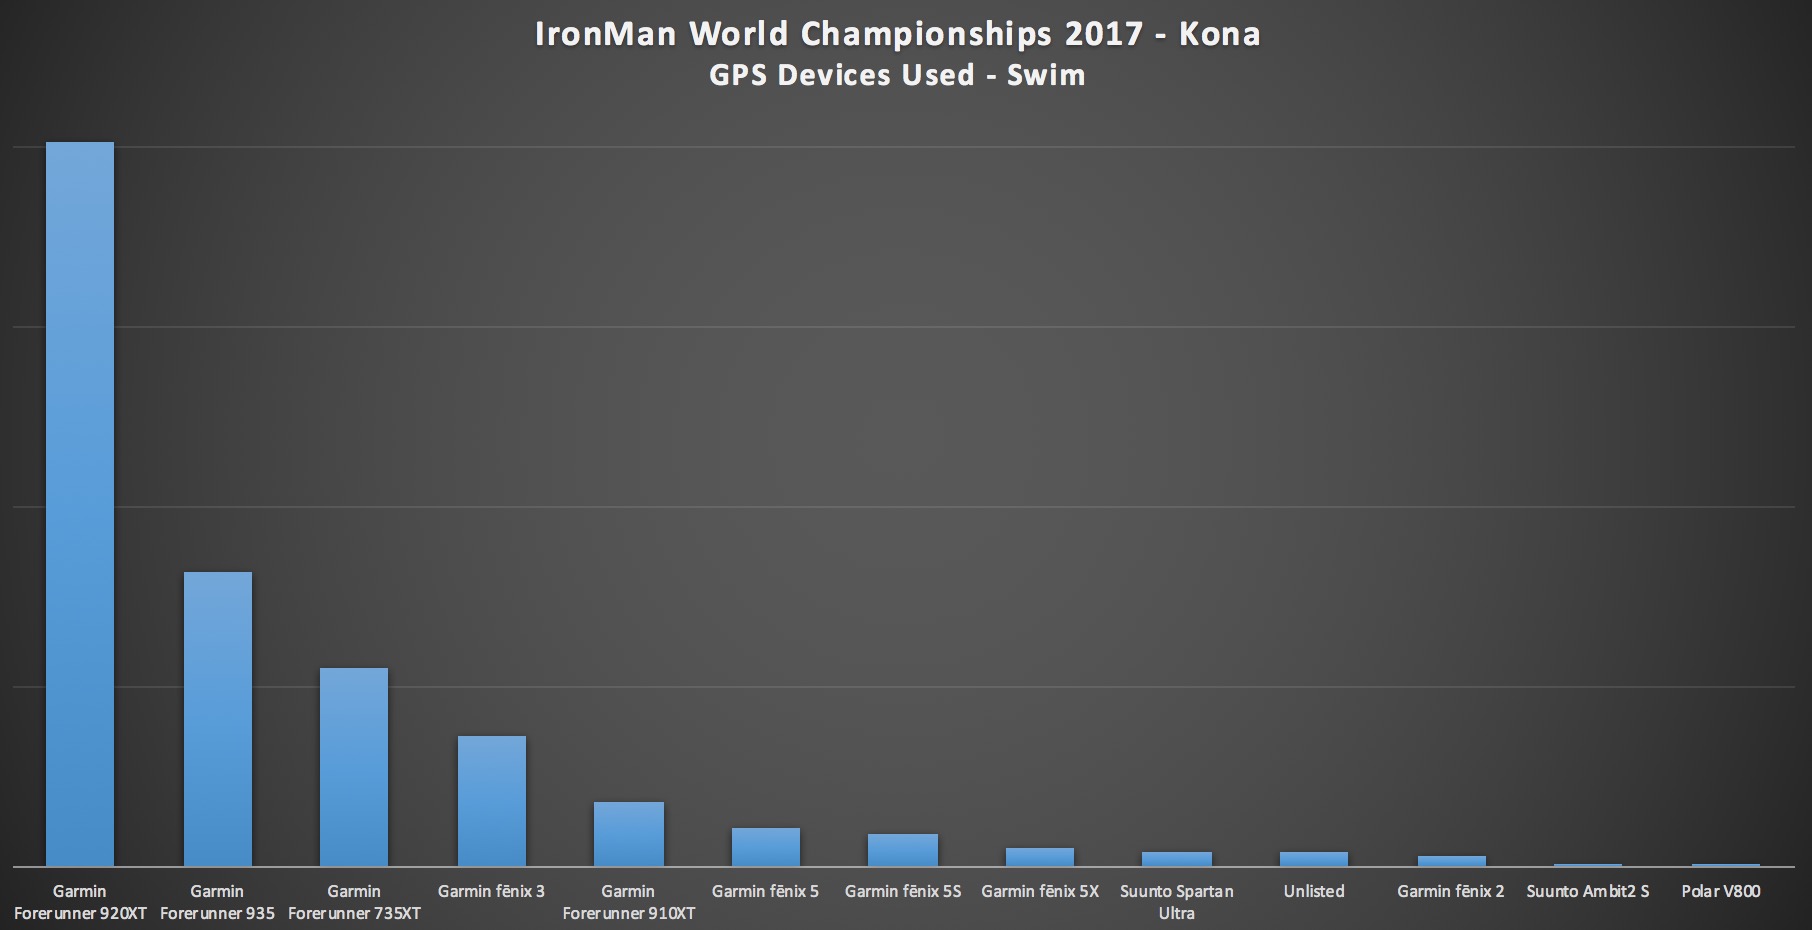
Swim
201 46.7% Garmin Forerunner 920XT
82 19.1% Garmin Forerunner 935
55 12.8% Garmin Forerunner 735XT
36 8.4% Garmin fēnix 3
18 4.2% Garmin Forerunner 910XT
11 2.6% Garmin fēnix 5
9 2.1% Garmin fēnix 5S
5 1.2% Garmin fēnix 5X
4 0.9% Suunto Spartan Ultra
4 0.9% Unlisted
3 0.7% Garmin fēnix 2
1 0.2% Suunto Ambit2 S
1 0.2% Polar V800
430 100.0% Total (13 Unique Devices)
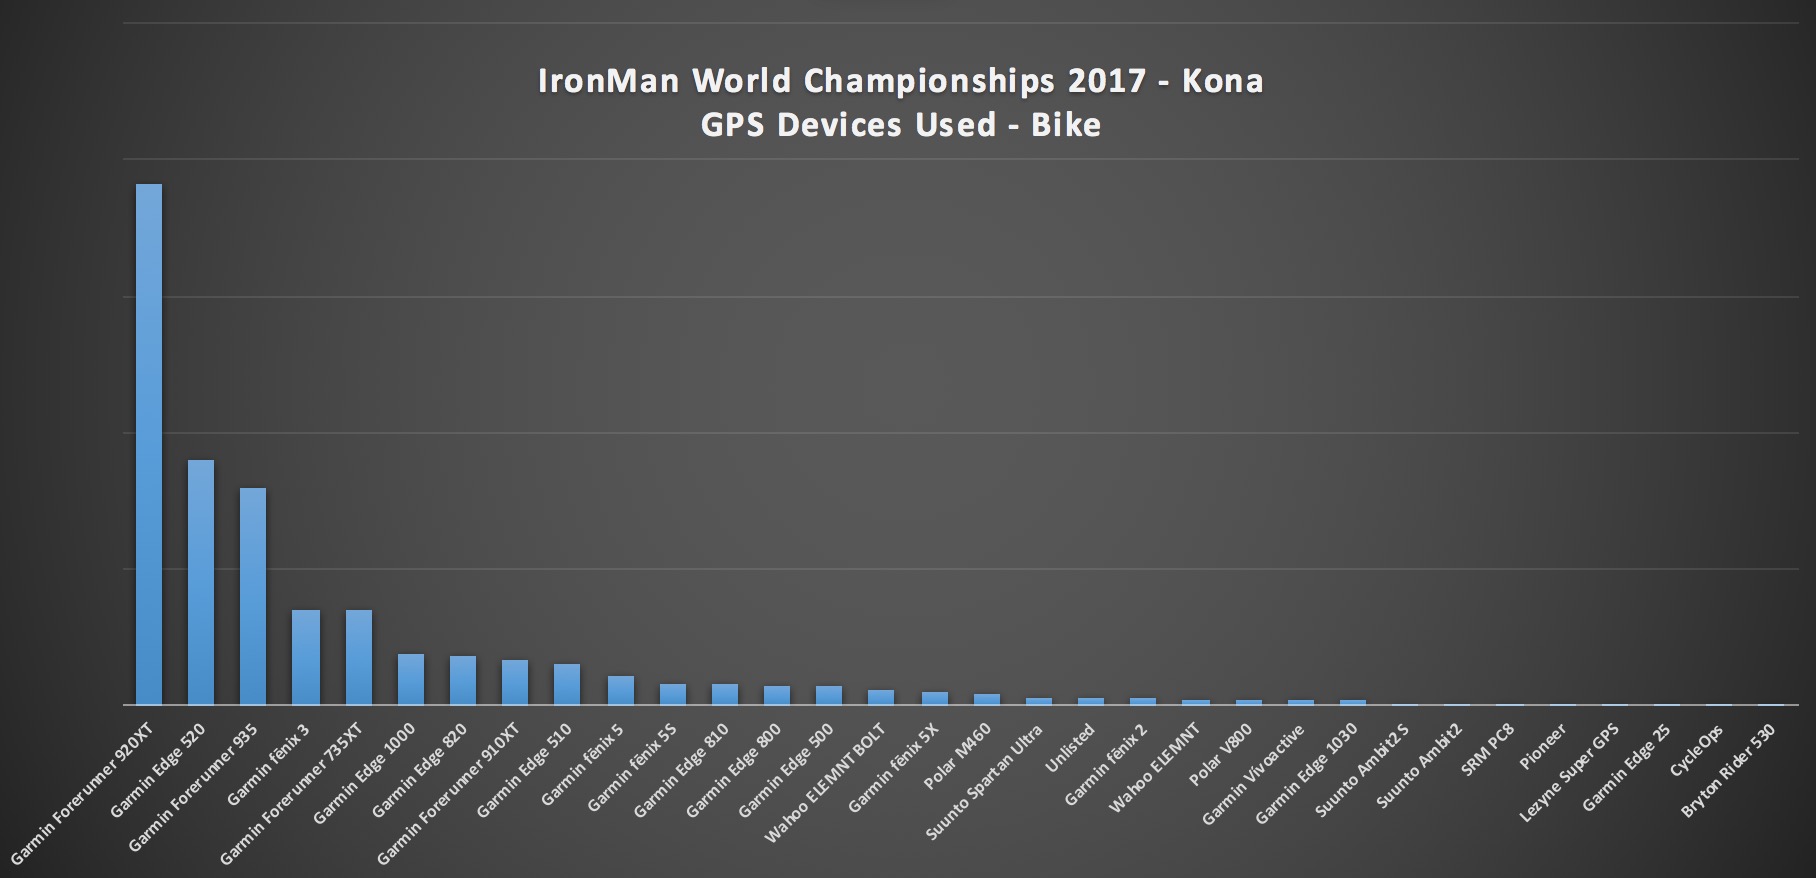
Bike
191 32.9% Garmin Forerunner 920XT
90 15.5% Garmin Edge 520
80 13.8% Garmin Forerunner 935
35 6.0% Garmin fēnix 3
35 6.0% Garmin Forerunner 735XT
19 3.3% Garmin Edge 1000
18 3.1% Garmin Edge 820
17 2.9% Garmin Forerunner 910XT
15 2.6% Garmin Edge 510
11 1.9% Garmin fēnix 5
8 1.4% Garmin fēnix 5S
8 1.4% Garmin Edge 810
7 1.2% Garmin Edge 800
7 1.2% Garmin Edge 500
6 1.0% Wahoo ELEMNT BOLT
5 0.9% Garmin fēnix 5X
4 0.7% Polar M460
3 0.5% Suunto Spartan Ultra
3 0.5% Unlisted
3 0.5% Garmin fēnix 2
2 0.3% Wahoo ELEMNT
2 0.3% Polar V800
2 0.3% Garmin Vívoactive
2 0.3% Garmin Edge 1030
1 0.2% Suunto Ambit2 S
1 0.2% Suunto Ambit2
1 0.2% SRM PC8
1 0.2% Pioneer
1 0.2% Lezyne Super GPS
1 0.2% Garmin Edge 25
1 0.2% CycleOps
1 0.2% Bryton Rider 530
581 100.0% Total (32 Unique Devices)
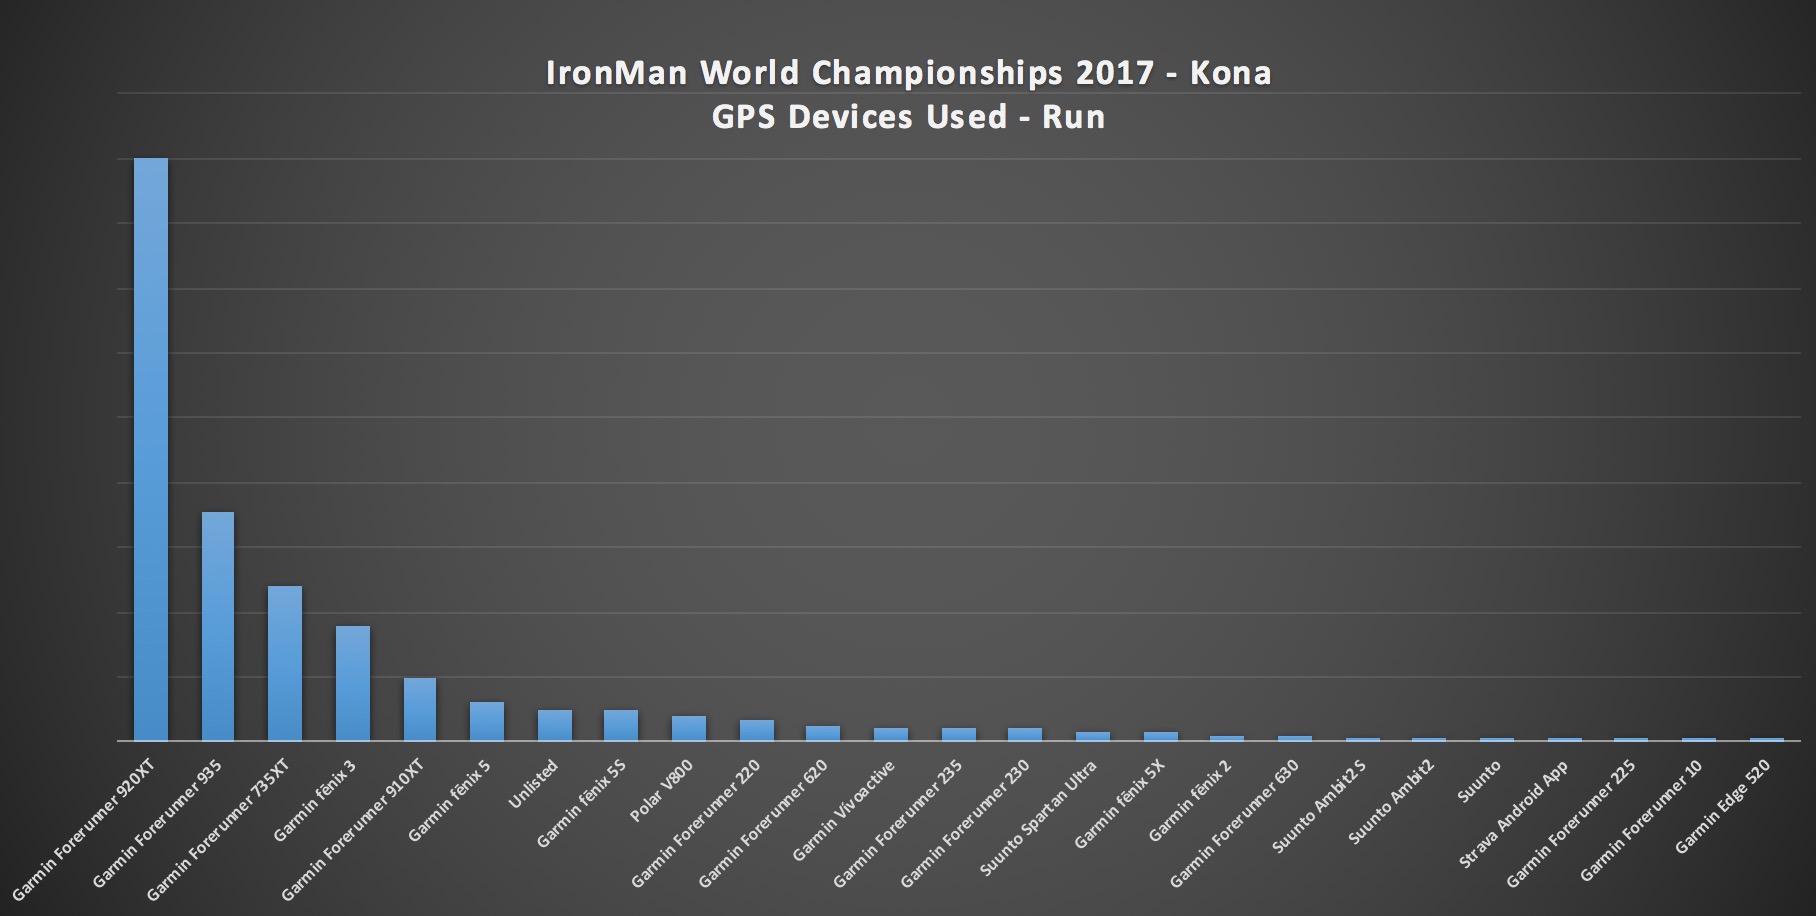
Run
180 41.3% Garmin Forerunner 920XT
71 16.3% Garmin Forerunner 935
48 11.0% Garmin Forerunner 735XT
36 8.3% Garmin fēnix 3
20 4.6% Garmin Forerunner 910XT
12 2.8% Garmin fēnix 5
10 2.3% Unlisted
10 2.3% Garmin fēnix 5S
8 1.8% Polar V800
7 1.6% Garmin Forerunner 220
5 1.1% Garmin Forerunner 620
4 0.9% Garmin Vívoactive
4 0.9% Garmin Forerunner 235
4 0.9% Garmin Forerunner 230
3 0.7% Suunto Spartan Ultra
3 0.7% Garmin fēnix 5X
2 0.5% Garmin fēnix 2
2 0.5% Garmin Forerunner 630
1 0.2% Suunto Ambit2 S
1 0.2% Suunto Ambit2
1 0.2% Suunto
1 0.2% Strava Android App
1 0.2% Garmin Forerunner 225
1 0.2% Garmin Forerunner 10
1 0.2% Garmin Edge 520
436 100.0% Total (25 Unique Devices)
GPS Device Used on Pace (Run)
Next, let’s break-down what devices people used depending on how fast they were going. What’s interesting here is actually looking at the slower run times and noticing there aren’t any devices that have lesser battery life claims – such as a FR230/235 or a FR735XT. Whereas you do see those devices in the faster groups. Obviously, this is likely because those devices would die well before the athlete got to the run (unless they wore it only for the run). But it’s neat to see the data basically support that.
Note: 4 Min/KM pace = 4:00-4:59, etc. Some records omitted with no pace data recorded.
Devices used for 4 Minute/KM pace:
30 41.1% Garmin Forerunner 920XT
11 15.1% Garmin fēnix 3
10 13.7% Garmin Forerunner 735XT
9 12.3% Garmin Forerunner 935
3 4.1% Garmin fēnix 5
2 2.7% Garmin Forerunner 910XT
2 2.7% Garmin Forerunner 230
1 1.4% Polar V800
1 1.4% Garmin fēnix 5S
1 1.4% Garmin Vívoactive
1 1.4% Garmin Forerunner 235
1 1.4% Garmin Forerunner 220
1 1.4% Garmin Edge 520
73 100.0% Total (13 Unique Devices)
Devices used for 5 Minute/KM pace:
103 45.4% Garmin Forerunner 920XT
40 17.6% Garmin Forerunner 935
25 11.0% Garmin Forerunner 735XT
16 7.0% Garmin fēnix 3
8 3.5% Garmin fēnix 5S
7 3.1% Garmin Forerunner 910XT
6 2.6% Polar V800
5 2.2% Garmin fēnix 5
3 1.3% Garmin Forerunner 620
2 0.9% Garmin Vívoactive
2 0.9% Garmin Forerunner 230
2 0.9% Garmin Forerunner 220
1 0.4% Suunto Ambit2 S
1 0.4% Suunto
1 0.4% Garmin fēnix 5X
1 0.4% Garmin fēnix 2
1 0.4% Garmin Forerunner 630
1 0.4% Garmin Forerunner 235
1 0.4% Garmin Forerunner 225
1 0.4% Garmin Forerunner 10
227 100.0% Total (20 Unique Devices)
Devices used for 6 Minute/KM pace:
36 36.7% Garmin Forerunner 920XT
18 18.4% Garmin Forerunner 935
13 13.3% Garmin Forerunner 735XT
8 8.2% Garmin Forerunner 910XT
7 7.1% Garmin fēnix 3
4 4.1% Garmin Forerunner 220
2 2.0% Garmin fēnix 5X
2 2.0% Garmin fēnix 5
2 2.0% Garmin Forerunner 620
2 2.0% Garmin Forerunner 235
1 1.0% Polar V800
1 1.0% Garmin fēnix 5S
1 1.0% Garmin Vívoactive
1 1.0% Garmin Forerunner 630
98 100.0% Total (14 Unique Devices)
Devices used for 7 minute pace:
7 43.8% Garmin Forerunner 920XT
4 25.0% Garmin Forerunner 935
3 18.8% Garmin Forerunner 910XT
1 6.2% Suunto Ambit2
1 6.2% Garmin fēnix 3
16 100.0% Total (5 Unique Devices)
Devices used for >= 8 minute pace:
4 44.4% Garmin Forerunner 920XT
2 22.2% Garmin fēnix 5
1 11.1% Strava Android App
1 11.1% Garmin fēnix 3
1 11.1% Garmin fēnix 2
9 100.0% Total (5 Unique Devices)
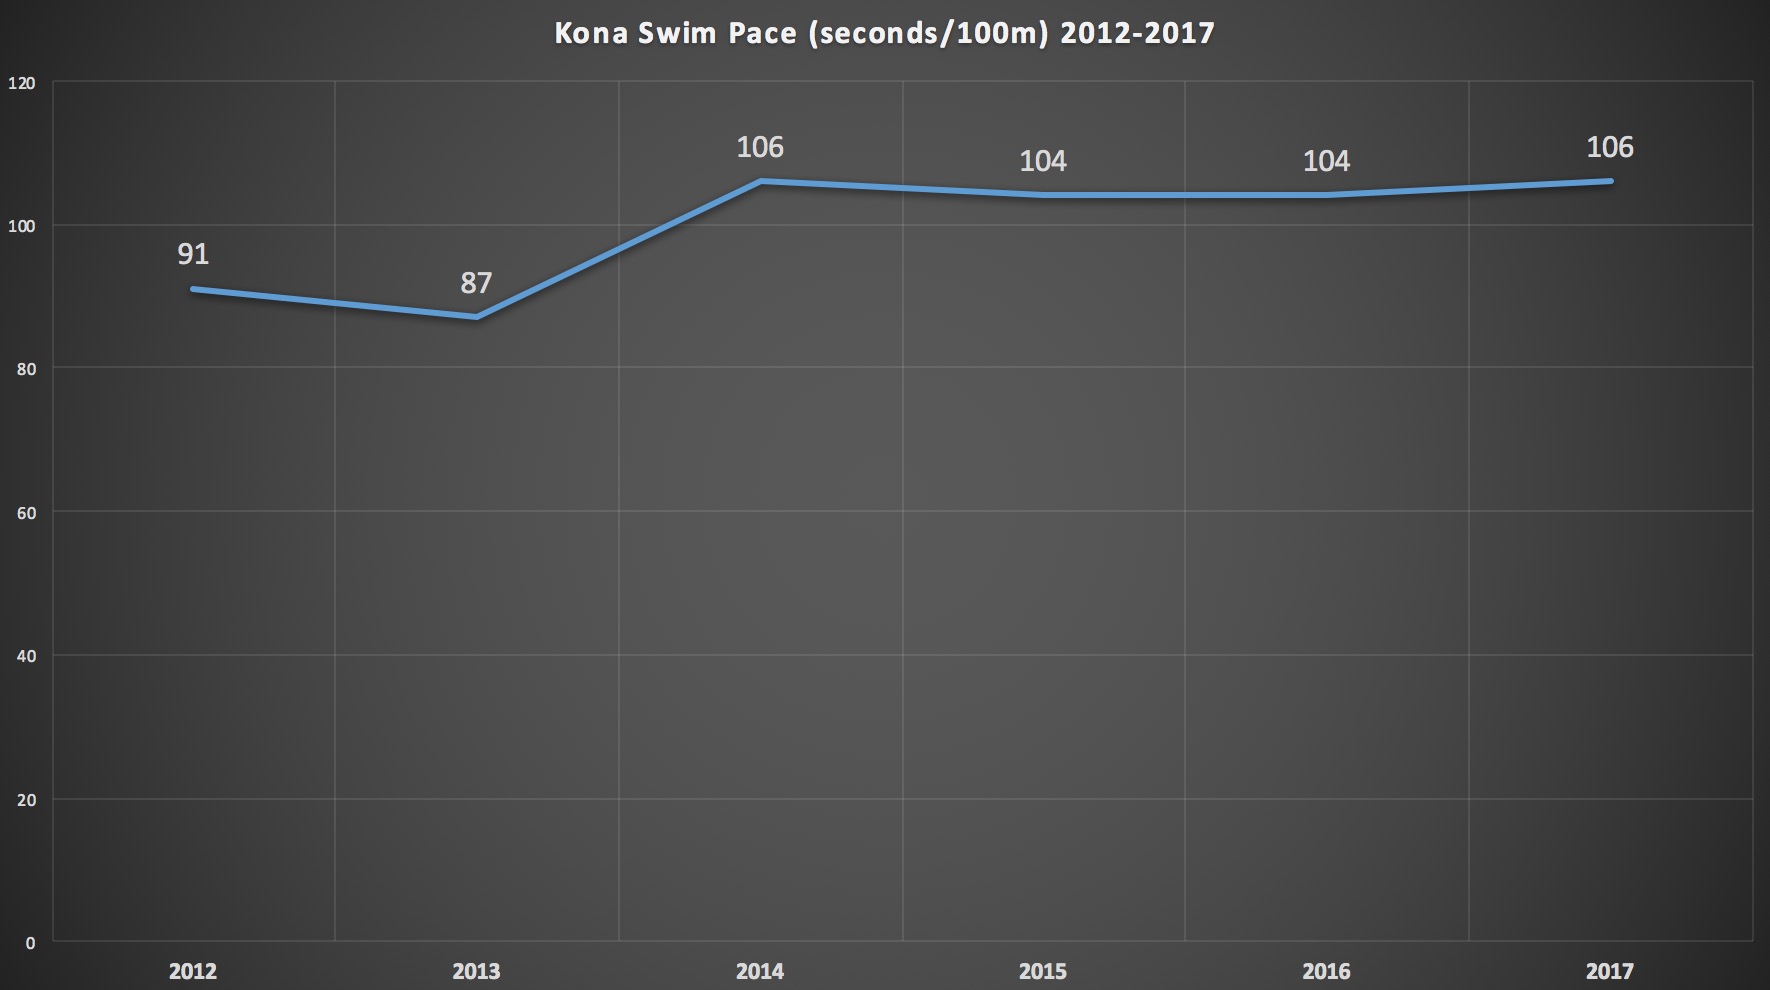
Historical Comparisons:
A look back from 2012-2017 at some of the statistics. The catch here is that 2012-2014 were pretty thin on data points compared to 2015-2017. Still, I think they’re worth including since we’ve got the data at hand.
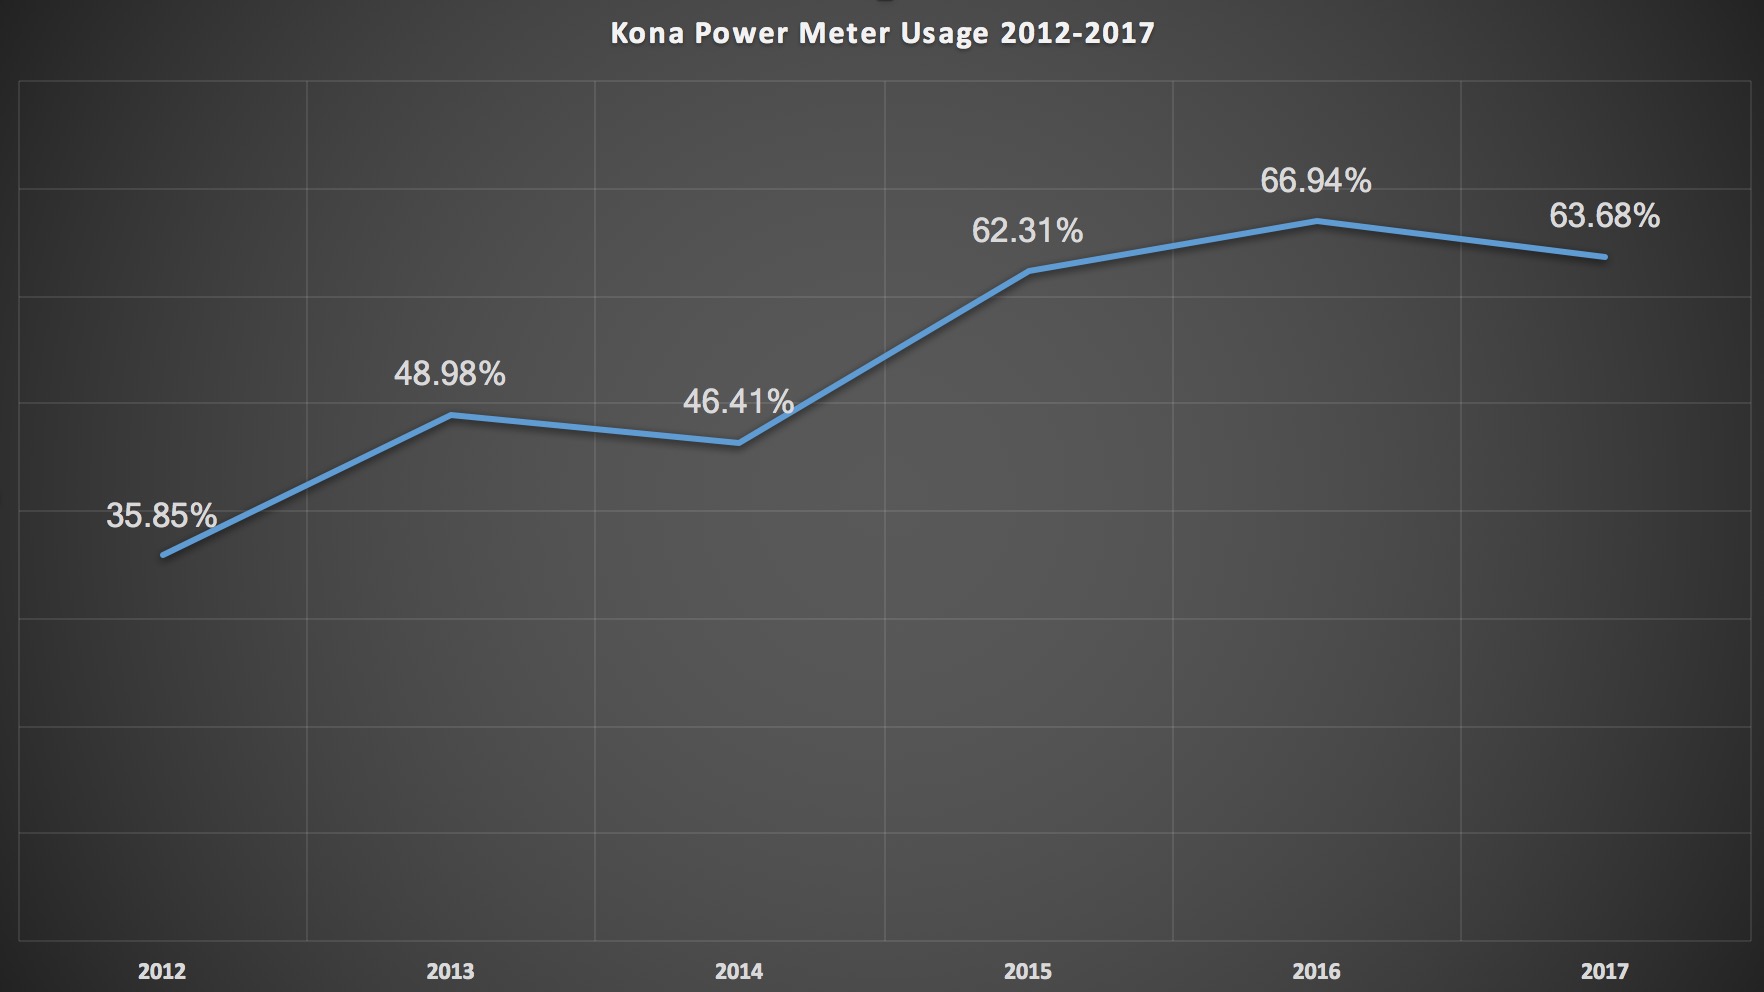
A decrease in 2017!? That’s not what the bike count said!
Remember, this is Strava activity uploads. There’s a number of forces at play. This is the data on Strava as of a few days post Kona 2017. To get angry at it would be like yelling at a (the) cloud.
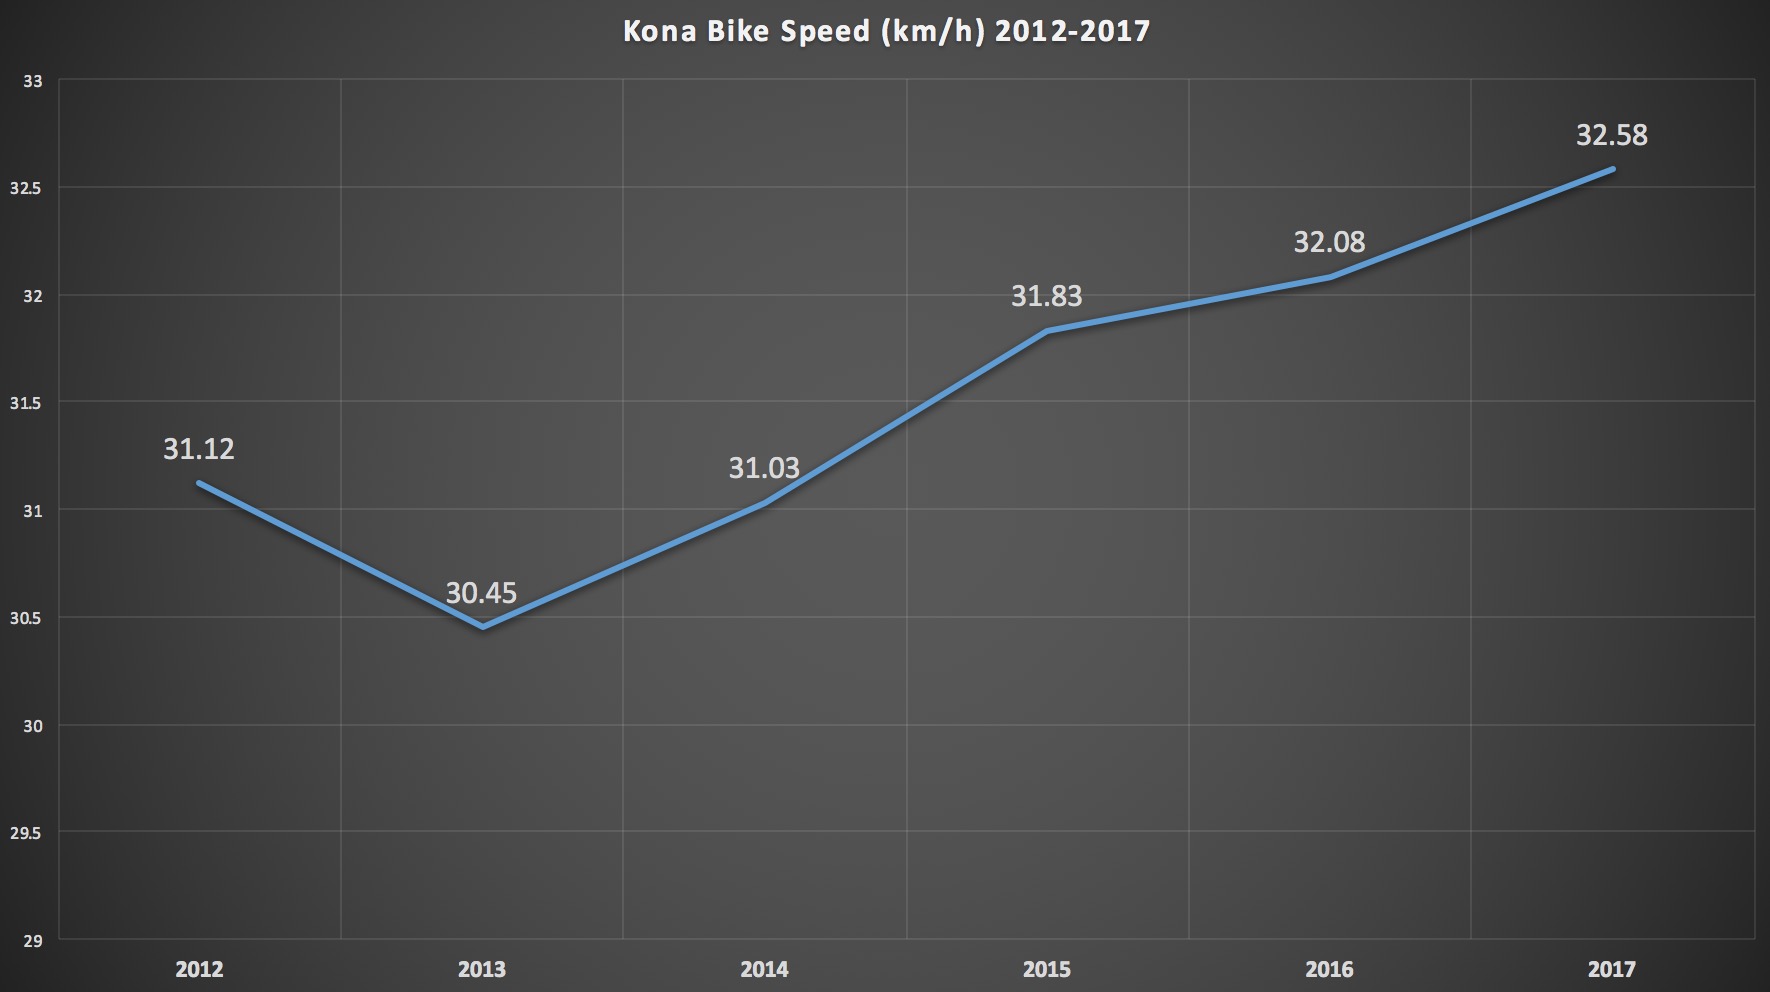
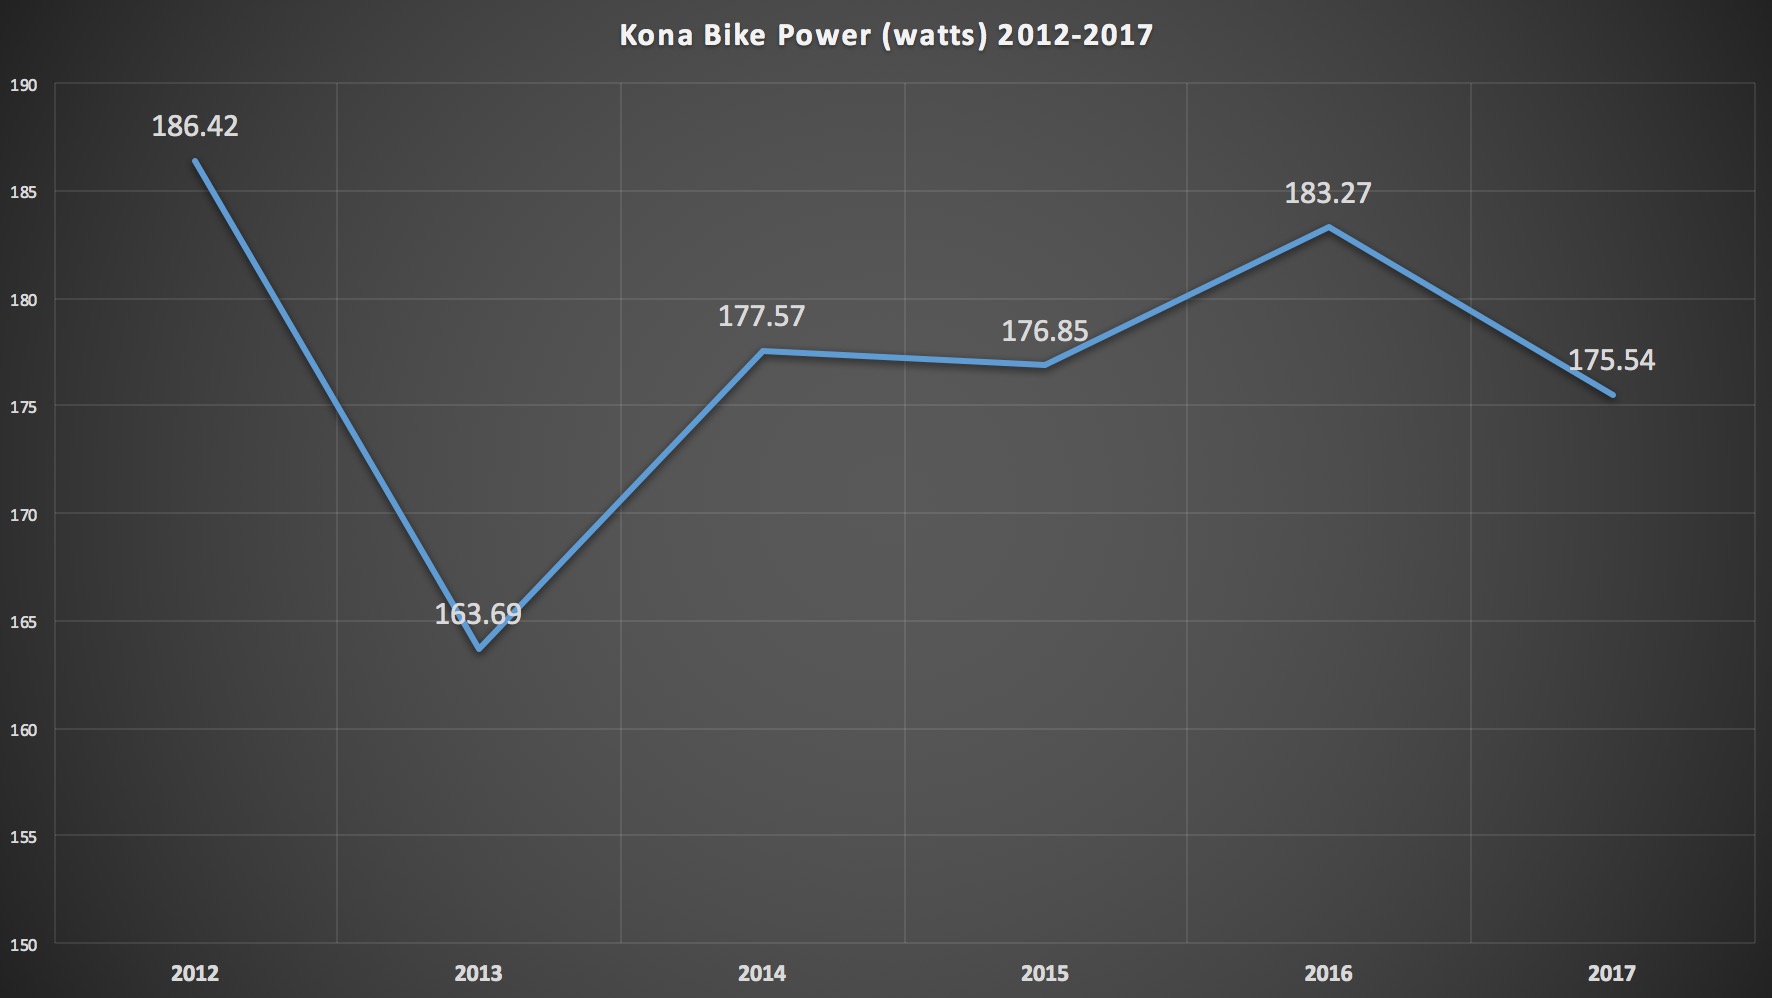
Power down and speed up in 2017… Possibly an indication that aerodynamics is an area a lot of competitors are focusing on? Rightly so if that is the case. 180km is a long time to spend in the wind. Alternatively, shifts in winds compared to last year could also account for this too.
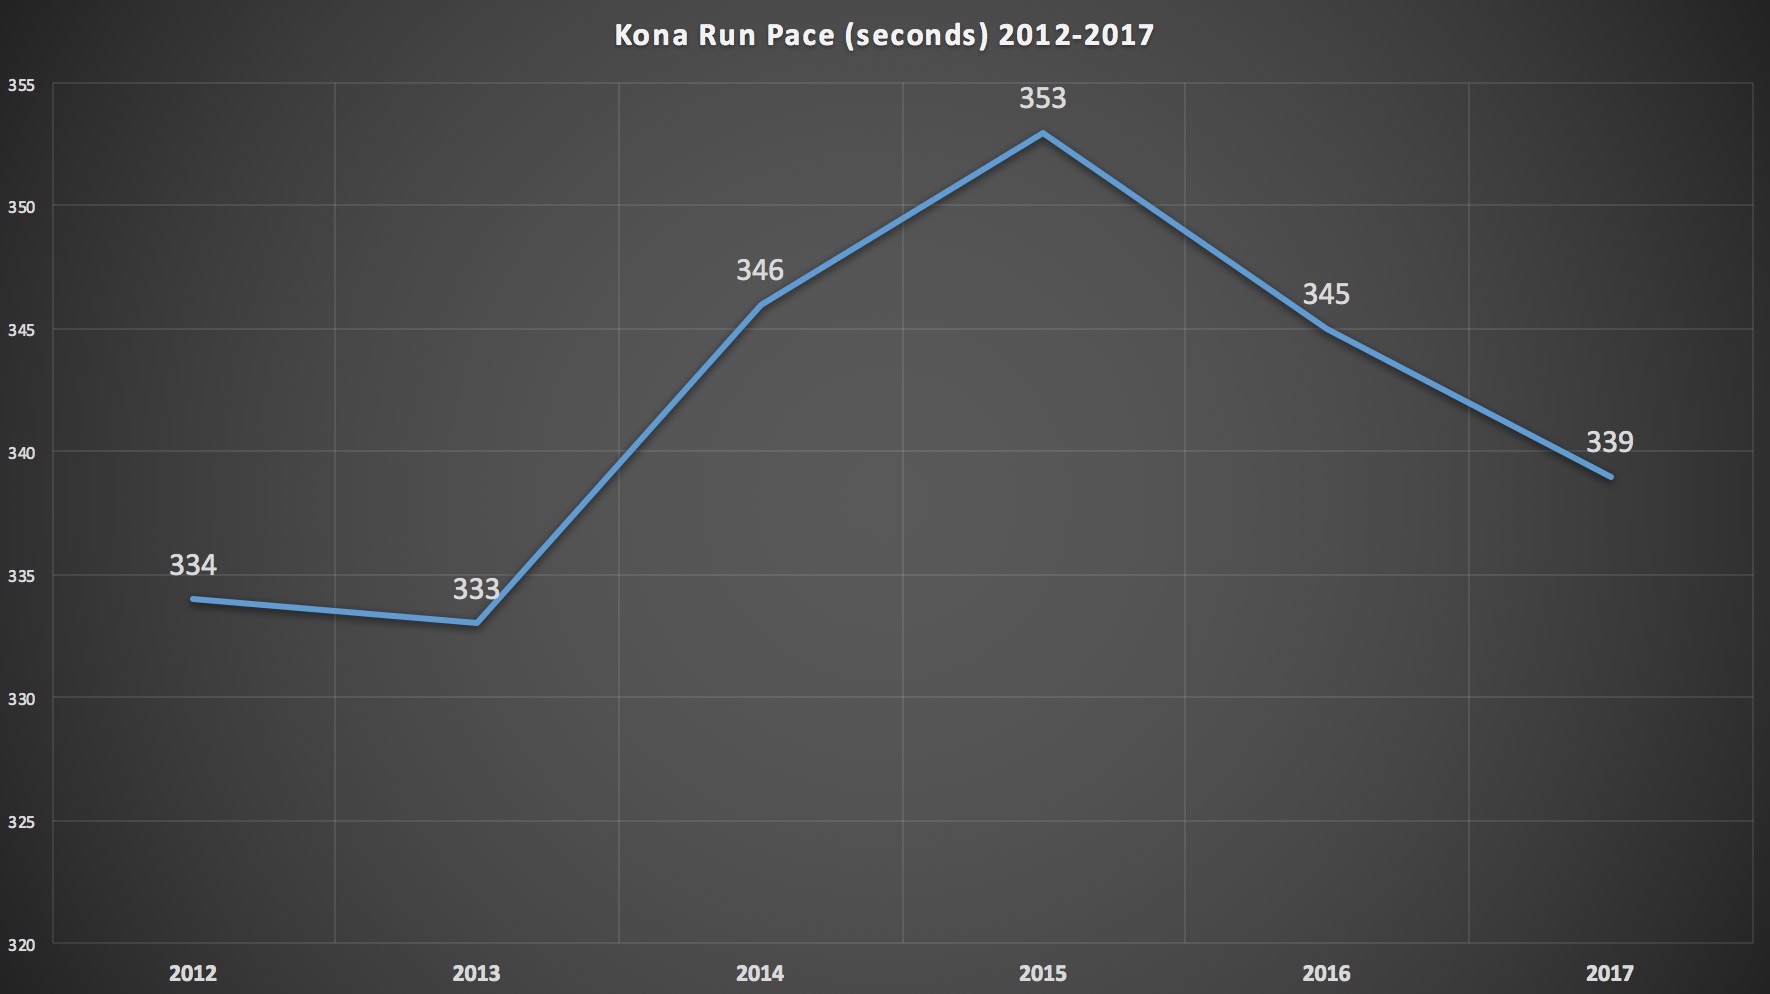
And you definitely saw a faster run course this year than last year on average. Again, factors like weather are likely at play here, but keep in mind that the entire field at Kona pretty much rotates through each year with new qualifiers (except the pros), so you aren’t really looking at the same set of people each year.
Wrap Up

The Garmin Forerunner 920XT was a stand out device across every leg. It held off the Edge 520 (The current King/Queen of road cycling) and the relatively new kid on the block, the Forerunner 935. It was also good to get an insight on just how fast the ‘average’ Kona athlete is across all three disciplines. Kudos to you all!
I hope you’ve found this as interesting as I have while diving into this data. Huge thanks to Ray for the opportunity to share this data to DCR Readers!
’till next time, keep uploading to Strava! :)
—-
From DCR: Hope everyone enjoyed – and thanks for sharing the data Shane, definitely cool stuff! Thanks for reading!
Here’s where you can find The Lama: YouTube | Twitter | Instagram | Facebook | Strava | Web
FOUND THIS POST USEFUL? SUPPORT THE SITE!
Hopefully, you found this post useful. The website is really a labor of love, so please consider becoming a DC RAINMAKER Supporter. This gets you an ad-free experience, and access to our (mostly) bi-monthly behind-the-scenes video series of “Shed Talkin’”.
Support DCRainMaker - Shop on Amazon
Otherwise, perhaps consider using the below link if shopping on Amazon. As an Amazon Associate, I earn from qualifying purchases. It doesn’t cost you anything extra, but your purchases help support this website a lot. It could simply be buying toilet paper, or this pizza oven we use and love.