Update – Aug 20th, 2017: Warning – BSX has discontinued sales of the BSX Insight product line, and plans to discontinue the platform as of August or September 2018. After which point it’s unclear what, if any, portion of the platform will work. Or whether the device will continue to function (as data processing occurs on their platform/site).
Back in September BSX announced their Gen2 version of the BSX Insight device, which determines your lactate threshold without any invasive pricking for blood. More relevant to the Gen2 version though is that they introduced the ability to broadcast and record muscle oxygenation information from the device, bringing it on par with their primary competitor.
The units started shipping in early November, and I’ve been using a loaner Gen2 unit from BSX since October – capturing many of my runs and rides. During that timeframe I’ve been able to get more than intimate with the device, the mobile app, the desktop app, and the web platform.
As always, I’ll shortly send the loaner unit back to BSX, and go out and get my own. You can help support posts like this via the links at the end of the post (or the sidebar).
With that – let’s get cooking.
Unboxing:
First up we’ll get things unboxed. For those of you familiar with the original BSX Insight unit, you’ll find exactly zero differences here. Seriously, it’s just the box cover-wrap that differs.

Note that there are three versions of the BSX Insight device: A running version, a cycling version, and a multisport version (that does both running and cycling). It’s all the same hardware, just different software.
(Speaking of that different cover wrap, the first unit I received prior to general availability had an older wrap on the box, whereas a second unit I received had the proper Gen2 wrap. Of course, I only took all the pretty pics the first time around. Above is the final Gen2 wrap, whereas the white exterior you see below is the older wrap. As for the parts? Same-same.)
Inside we’ve got the pod safely protected in hard foam. Whereas on the left side is the small box for the compression sleeve. Unseen under everything is the charging dock.

Here’s all of these pulled out and plopped on the table:

First up is the compression sleeve. This ships in specific sizes (i.e. S/M/L/etc…), and is specifically designed to hold the pod itself. I’ll cover that in more detail in a minute.


The charge/sync dock uses micro-USB on the back of it, which is kinda nice. That way you can re-use the cable when traveling for multiple devices (i.e. a phone, etc…).

The charging dock also is weighted, so that it’ll stand and not tip over easily.

Finally, we’ve got the actual BSX Insight pod (Gen2). On the back you’ll see the sensor and 2 RED LED lights, as well as the charging piece (copper dots).

Meanwhile, on the front there’s a single light at the very top, that’s used to provide feedback to you on the device state.

For those that are curious, here’s the Gen1 and Gen2 pod placed next to each other:

As you can see, almost no visible differences – beyond the text. However internally there are changes to components such as the communications antenna and processing power.
The Basics:

Now that we’ve got everything unboxed I’m going to briefly go through some of the basics on how the device works at a high level. Then I’ll cover the four specific scenarios that you can use the device within today.
To start with the Insight, you’re going to need the compression sleeve. This is critical to usage because it blocks outside light that can (well, it will) interfere with the NIRS sensors on the back of the unit. BSX’s compression sleeve is without question the best designed compression sleeve to hold a device I’ve seen (I’ve actually used it with the MOXY unit as well…).


Once you slide it in there, it’s still not turned on. The unit will automatically go to sleep after a period of inactivity, thus keeping the battery reasonably fresh even when not used. To wake it up, just whack it a few times. The light will flash at the top.

Now at this point it’s not recording yet. Instead, you’ve just woken it up so the app can find it. For that you’ll need your phone. The phone is what starts the workout.
Meanwhile, on the back of the unit the lights will start:

Now, this process is somewhat a pain in the ass, because it means that you have to start your workout nearby your phone. So most times I’ll leave my phone indoors for a run, and then head outside to get GPS signal, etc… By time I actually start the workout, it may be 5-7 minutes later. Thus, I’ve got 5-7 minutes of ‘dead’ time on my BSX recording file.
BSX says they’re working on a change to address this, that will allow you to start it without the phone.
Now to be clear – you DO NOT NEED to have your phone with you. You just need to start it from the phone. Then you can throw your phone in the river. In fact, you don’t even need your phone to end the workout. You can do that just by docking the device (or using your phone.)

When it comes to sport (cycling or running), you will need to wear it in the compression sleeve during activity. This part is non-negotiable. However, you can decide which leg to wear it on. In general, I recommend wearing it on the same leg consistently. That’s because you could get changes from leg to leg, and if you just swap them willy-nilly, you might mistake leg changes for changes in performance.

Now before I go through the four types of ways you can capture data, I do want to briefly note that while the unit will sync your workout data via Bluetooth Smart to your phone, it won’t sync all the raw/detailed data via Bluetooth Smart. For that, you will need to sync the unit with your computer using the dock.
From there, you’ll use the BSX Insight app on your computer, to sync all the data up to the magical cloud.

It usually takes about 1-2 minutes to sync the workout. Ok, with that important note out of the way, let’s start testing and using the unit.
LT Testing – Running:

With the BSX Insight, you’ve essentially got two ways to use the device: A lactate threshold test, or just a regular workout. For both of these you’ll either choose running or cycling.
First let’s look at the BSX testing procedure for a LT test in running. To begin you’ll select the option to ‘Take Run Endurance Test’, which then reminds you said test must be done on a treadmill. The reason for this is you really need to ensure very specific (or at least stable) paces are being held. Outside, that’s going to be tough.


Next, it’ll ask you a few questions, which in turn help to define the test. The idea here being to get you in the right range of paces such that you’re most likely to find your Lactate Threshold. Meaning that if you typically run a 10K in 48 minutes, you’d have a different set of paces versus those who run a 10K in 38 minutes. And sure enough, if you answer the questions differently you’ll get different paces.


Once that’s done, it’ll show you what your paces will look like. Note that you can do this in either statute (miles) or metric (kilometers). Don’t be concerned about recording these paces down, as the test will tell you them later, and it’ll give you the option to show both pace and speed.


Here’s the metric variant:


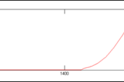
As you can see, each test segment is three minutes long, and drops in pace until you hit the end of the test, or you stop the test. Note that the first few minutes of the test are specifically designed to be silly-easy. Like, fast walking easy. That’s on purpose. Enjoy those minutes. Ponder the fact that life is still enjoyable – soon it won’t be.
Once that’s set, you’re going to get to the usual sensor pairing/readiness screen. And finally you’ll get the start button.


Once you start, you’ll receive guidance on what you should be doing for each state. Thus, in theory the only thing you’ll need to do is to change your treadmill speed. Along the top it’ll show you your HR (from your HR strap), the current time left in that stage, and your Muscle Oxygenation level from BSX.


You’ll notice above you can tap pace or speed to see the target pace displayed in either method – since some treadmills will show it one way versus the other. And again, you can show this in either miles/MPH or kilometers/KPH.
As you near the end of a stage you’ll get a warning banner up top, counting down until you need to change the treadmill.


Above you’ll see my HR has increased, as has my muscle oxygen level shown in the upper right. Further, it shows the stage information as well.
As you can see above, I took a few more screenshots later in the session. Though, I didn’t take much in the way of actual photos. For the simple reason that I was the one running on the treadmill, so I don’t tend to get great GoPro photos from poorly lit hotel gyms.
Now eventually you’ll either complete the test through all 12 stages, or, you’ll fall off the back of the treadmill. In my case, I held on as long as possible before jumping off the treadmill and hitting the stop button (see the HR of 186 BPM). Note that you have to hold down the stop button for a few seconds, so an accidental swipe won’t kill it. Once you do, you’ll get a pop-up that it found your LT information. Following which you see the first results page.


In addition to the exact anaerobic capacity being specified in pace, it’s also shown in HR. This is somewhat important in case you run into challenges with treadmill accuracy. But more about that in a moment. You’ll also get zones displayed in both BPM as well as pace.
Further, you’ll get it listed onto your Running Endurance Test dashboard. You can see a test I did from the first unit, last spring.


And finally, all of this is available online too. And in fact, online you can also download the data afterwards by clicking the little ‘download’ button at the bottom.

That in turn gets you a nice CSV file full of raw data that you can poke at. I’ve included mine here for those that wish to download it.

Now one final thought on treadmill testing. And, it’s an important one. Remember that treadmills that you don’t control are notoriously unreliable and inaccurate. They are often way off on paces. Thus as a result I recommend a few things.
First, keep that inaccuracy in mind when looking at test results. Second, if doing treadmill tests, try and use the exact same treadmill each time (wherever you are). Most gym treadmills do tend to stay consistent to themselves, even if the one right next to it is wonkier/better. This way at least your testing will be consistent (even if inaccurate).
Lastly, note that BSX doesn’t specify to do testing at 1% incline, but the general rule of thumb is to do put treadmills at 1%incline to better simulate outdoors. Thus, I’d highly recommend that – otherwise you’re potentially increasing inaccuracy rates.
Thus – I’d be more focusing on the HR values provided, than the actual pace zones provided. Since the HR values will be valuable across any environment, whereas the actual running paces might vary based on many factors (including how accurate the treadmill is).
LT Testing – Cycling:

Next, we’ve got the LT Testing for cycling, which follows nearly the exact same process as running, just minus the potential for you to be flung off the back of exercise equipment at high speed. I know, less fun.
In any case, you’ll crack open the app to get started. Just like in the running tests, you’ll go ahead and begin by giving it some detail about your current bike performance.


After you give it your eHarmony related information, it’ll spit back your love profile. Like the running test, it’s in three-minute chunks. However unlike the running test those chunks are based on watts. So you’ll need a power meter or power capable trainer.


Next, you’ll get ready to start your test by pairing to your power meter and HR strap. What’s interesting here though is that BSX has added in support for the Wahoo KICKR, which means that it can control the KICKR and do all of the resistance changing for you.
Alternatively, you can also just connect to any other power meter via ANT+, but in this case, you’d have to change the level of resistance on your trainer manually.
Unfortunately at this point BSX hasn’t adopted the ANT+ FE-C control, which would make this work across all other trainer brands (i.e. Tacx, Elite, BKool, etc…). In talking with them, it’d be technically possible – but isn’t something they are currently planning.


Once you’ve begun the test, you’ll be given your stage target information in the center of the screen. If on the KICKR, it’ll automatically change the resistance level for you. Note that there isn’t any KICKR calibration/roll-down screens or options there, so be sure you’ve done that ahead of time.
Along the top of the page you’ll see your current HR (from your HR strap), as well as the time remaining in that stage and the muscle oxygenation level.


Just like running, you’ll keep on iterating stages every 3 minutes until you either stop pedaling, or reach the end of the test. In my case, I ran out of legs to continue pedaling. Keeping in mind that by this point I’m now 30 minutes into the test, so while 3 minutes by itself at 360w or 400w may seem straight forward, doing so after all of these blocks might be less so.


Note above the BPM (184, high) and muscle oxygenation levels (down to 72%).
Once you reach that point, it’ll give you a successful test message. Unless it couldn’t detect it. That’s possible if you stopped too early, or if perhaps the test was too easy.


It’ll then come back with your anaerobic capacity watts, as well as training zones based on that:


You can tap on the heart icon at the top to get the same in HR zones instead. The below being more useful if you lack a power meter outdoors (but have a power-capable trainer indoors).


And finally, just like running – all of this is also available online to download via their website:

Note however that for neither the running or cycling test are you able to view a nifty step-chart showing wattage/HR/Mo2 like you can for regular workouts. Which is kinda odd (it won’t show up in that list either).
Note that there are slight differences between FTP and anaerobic capacity (aka Lactate Threshold). As always, Joe Friel does a great job breaking these all down here.
Regular Workout Use:

So now that we have tests out of the way, let’s talk about regular workout usage. For this it’s not super complex, you’re essentially using the device to record your workout. All of the data is recorded on the device itself, including additional sensor data that you may have from paired ANT+ sensors.
We’ll look first at running, and then at cycling. To start a workout for running you’ll get the unit all strapped to your leg and turned on. Then we’ll crack open the app and select Run, and then select ‘Daily Workout’. Then select to Start a daily workout.
You’ll find that it’ll connect to your ANT+ HR strap and ANT+ running footpod. These allow you to plot these data points onto your charts for more context as to what was going on.


Once that’s done, you’ll simply press the start button to get going. It’ll record all these metrics during the workout with no phone required. Again, you do not have to have your phone with you after you start the workout.


Once you’re done with the workout, simply hold the pause button down a few seconds, which gives you a stop button. From there it’ll calculate your workout and allow you to save your results.


Afterwards, you can use the app to slide along the workout (it only shows small chunks in that window), or you can do the same online to see the whole thing.


And online as well:


And, just like for tests you can also download your workout files from a raw data standpoint.
Next up – cycling. This all works exactly the same way as running. First up is selecting ‘Cycle’ and then ‘Daily Workout’. Next, it’ll pair up to an ANT+ HR strap and ANT+ power meter.
From there, you’ll be good to press start and begin riding (either indoors or outdoors).

During the workout you can use the app to display stats, or, you can just go without the phone and download and view it after the fact via phone or web.


Now one thing to note is that I have seen a bunch of weird slowness when trying to load certain pages on the BSX site, which can’t quite be explained easily. It usually does load, but it just takes forever.

Speaking of the site, there is an option to compare two similar workouts over each other. So if you’re doing the same interval repeats each week, you can simply overlay the two sets of data to see how they compare.

Ok, now that we’ve rounded up all the methods to gather data, let’s briefly cover the ANT+ broadcasting piece, and then we’ll start diving into data more deeply.
SmO₂ ANT+ Broadcasting:
Note that while the BSX device will record data to the pod itself, it also transmits that data over ANT+ across a number of channels. This allows you to display it onto compatible ANT+ devices (or apps).
BSX transmits muscle oxygenation across three ANT+ channels concurrently today:
ANT+ Speed/Cadence: Also hijacked, transmitting your SmO₂ while cycling.
ANT+ Footpod: Yup, hijacked too, and yup, still SmO₂ while running.
ANT+ SmO₂ Device Profile: Boom baby! No hijacking required! Straight up SmO₂ on it’s very own channel.
So why would you use any of the first three hijacked channels? Well, if your device doesn’t support the native SmO₂ option…which, virtually none do except a handful (for example, PerfPro, Golden Cheetah, Sport Tracks, and PeriPedal as trainer and analysis apps do). You can use the ANT+ directory to find many compatible devices, just change the “Profiles” option on the left side to be ‘Muscle Oxygenation’ and ‘Display’.

(Note: In the above, I also included those listed under ‘sensors’)
As you can see, there aren’t yet any actual wearable devices that natively display the data. Thus why both Moxy and BSX transmit/hijack other channels. The downside to that is that you can’t then use those other channels for their intended purpose (i.e. cadence, footpod, etc…). Personally, I find that kinda useless. But to each their own. You’ll see them listed when you go to search for a sensor. In running mode it’ll broadcast over the footpod, and in cycling mode the speed/cadence sensor:

Now you’ll have noticed Garmin Connect IQ apps up there. These are from Moxy, and allow you to view SmO₂ data (but not save it). Still, they get the job done. However, the Moxy data field does not work with BSX.

Ultimately, if either Garmin decides to natively support SmO₂ data, or enables apps to save the .FIT data (coming in Q1) – then using the SmO₂ channel will make a lot more sense. Today, it’s mostly just for looks, with the exception of apps like PerfPro which can make use of the data today in an indoor cycling trainer environment.
Some Thoughts on BSX Data:

Ok, so at this point in the review I’ve covered a lot about how things work with the device, but I haven’t covered so much in terms of what to do with this data. Or even how it compares to other devices. There are a lot of different ways to cover this. So let me try and iterate through this as best as possible.
Is the data accurate?
Ahh yes, the million dollar question. Why not start big? You’ll remember with the first BSX test I did way back when on a prototype device, that they did LT test using the traditional prick method, and that lined up. Of course, they were somewhat controlling both sides of the test – so one should consider that.
I haven’t gone elsewhere to validate that test for me. However, just last week Central Queensland University in Australia did that dirty work for me. In a study that was not funded by commission or by BSX, they determined that the BSX Insight was a “practical, reliable and non-invasive tool for use in predicting LT in runners.” They did not test cyclists. The study involved 14 athletes, 7 male/7 female.
The study is actually interesting in that they had all the athletes test multiple times, each with one device per leg. Pretty cool.
As many of you know, I’m usually quite critical of peer-reviewed studies of sports technology devices. Most times they screw things up (especially power meter studies). However, from a technology or implementation standpoint, I don’t see any issues here after reading through the full study document.
Can you wear it on other muscles?
Yes and no. Yes, you can wear it wherever the heck you want, but anytime you put it somewhere else you’re effectively measuring something different. Even if it’s similar – it’s still different. You’ve also got the challenge of ensuring the sensor is secure as well as still blocking light. So no, it’s not impossible (or even hard), it’s just you need to be aware of the constraints.
How is this different than Moxy?
Another million dollar question. And, given the cost differences between the two – certainly valid. Moxy is in many ways similar to BSX. The differences right now come with respect to range, as well as features.
Currently Moxy transmits tHb (Total Hemoglobin Concentration), whereas BSX does not. BSX says they are working on it, and are getting close to providing it via software update – but haven’t given a specific release timeframe.
On the flip side, Moxy is much more of a ‘device unto itself’ type approach. Meaning that BSX has more of an ecosystem around it from a software standpoint (phone app, cloud platform, etc…). Which Moxy lacks. In my opinion, this makes Moxy harder to use day to day for data gathering for a single athlete (me). Moxy also doesn’t have a test mode that automatically determines your lactate threshold.
However, inversely, if I were doing studies or working with multiple athletes, then Moxy would actually be easier since I can just plug it in via USB and grab the files using their downloader – without having to instantiate a cloud account, etc…
Now, neither company wishes to get into a pissing match over their respective technologies (and neither wants to talk bad about the other). Which is logical – both companies make solid devices that will work for the vast majority of scenarios. And they both know the market is more than large enough for the two of them.
A Massive Pile of Your Questions:
Over the last few months, many of you have had specific questions posed within the threads on my preview post. In an effort to get answers to those, I scooped them all up into one gigantic layer cake, and then sent them over to BSX. They came back with a multi-page document outlining rather clear and concise answers. So rather than copy/paste that all here. Here’s a PDF file containing all the questions & answers.
How do I use all this data?
This is probably the most challenging question, oddly enough. You have to really look at two different functions of the BSX device. First is the LT test functionality. In that case, the data is in my view more useful to the average athlete as the ability for the device to give you pace/HR/power zones based on your lactate threshold allows you to then use that information and train by it. In many ways, that’s fairly straightforward and easy to follow.
However, the downside to the way the device currently works is that you must be in an active test mode to get this updated guidance. As such, you must be doing the LT tests at a regular frequency in order to truly benefit significantly from shifts in zones. This is different than some of the running lactate threshold paces that the Garmin FR630 introduced, as that is going to auto-generate that data whenever a workout manages to trigger a new LT level. Of course, those automated LT zones on the Garmin devices haven’t really been validated by anyone, and at this point seem to be somewhat finicky to get.
The next piece is the daily workout component. This is an area that I think BSX leaves far more up to your own analysis work. Essentially, they’re just giving you a muscle oxygenation level – and it’s up to you to figure out what the heck to do with it.
Unfortunately, most of the documentation available today in this realm will likely cause most athletes to gloss over in terms of how to read the data. Let alone how to generate and follow a training plan by it. Both BSX and Moxy have published resources around this (an eBook in Moxy’s case, and blog posts in BSX’s case). However, without devices themselves natively supporting SmO₂ (including aspects like setting workout targets and the like), it’s going to be challenging for many athletes to use and train by the data.
Oh, one last thing:
While this last question has nothing to do with data, I’m not really sure where else stick it. So, it’ll go here.
Many readers have commented around BSX’s decision to ‘create’ the Gen2 devices, and more significantly – to charge Gen1 buyers for the device. As a quick primer for those new to the discussion, when BSX announced the Gen2 device this past fall, they announced a buy-up program for Gen1 users. The device would end up being $79 to upgrade to a Gen2 device (compared to ~$400).
This upset some folks, since they argued that the Gen2 device was essentially providing for things that the Gen1 device had promised. And in many ways, they are correct. The Gen1 device did overwhelmingly imply during their Kickstarter campaign it would work outdoors as part of ‘Daily workouts’. That functionality never came to Gen1 users.
Further, some Gen1 users had issues with connectivity dropouts during tests. These dropouts were caused by poor communications hardware design inside the Gen1 units. While the Gen2 units have fixed this, it’s still a valid complaint on Gen1 units.
In discussing the upgrade program with BSX, they are indeed taking a loss on it from a per-unit standpoint (meaning, it cost them more than $79 to make a Gen2 device). So I believe they are finding some form of middle-ground in that pickle. I also believe the vast majority of readers that have commented agree here (obviously, some do not).
Finally, I think that BSX has certainly had some growing pains as a startup over the past 1-2 years. They’ve had to learn all the ‘fun things’ that come along with operating a company that ships products internationally. They’ve also had to learn the ins and outs of manufacturing complex sports technology hardware. I don’t envy their job. However, I do think most readers would agree that over the last few months they seem to be trying to be as proactive as possible in responding to questions and fixing issues as they’ve arisen. Just my two cents.
Summary:

Phew – you made it! Or, perhaps more importantly, I made it.
I think BSX has come a long way with not just the device, but their entire software platform since their Gen1 release. Put another way – the entire system ‘just works’. I don’t get errors with the software, nor do I get issues with units not responding or dropouts. Both desktop and mobile apps seem to be running just fine, and producing usable test and daily workout data.
Of course, the biggest challenge you’re going to face while using the BSX device is simply how to use the data. As I noted above, some aspects (such as tests and results) are fairly straight forward and easy for most people to train by. Whereas other aspects such as daily workouts will require more analysis and thought from the average person. It’s just not as straightforward as pace or heart rate. It’s in these areas that I think both BSX and display makers (like Garmin) can do more to make this data accessible and easy to understand.
Still, after three months of usage I’m not seeing any blockers with the device. This time around it does exactly what it says it’s supposed to do, and does so in an elegant way. Thus, I’m happy.
FOUND THIS POST USEFUL? SUPPORT THE SITE!
Hopefully, you found this post useful. The website is really a labor of love, so please consider becoming a DC RAINMAKER Supporter. This gets you an ad-free experience, and access to our (mostly) bi-monthly behind-the-scenes video series of “Shed Talkin’”.
Support DCRainMaker - Shop on Amazon
Otherwise, perhaps consider using the below link if shopping on Amazon. As an Amazon Associate, I earn from qualifying purchases. It doesn’t cost you anything extra, but your purchases help support this website a lot. It could simply be buying toilet paper, or this pizza oven we use and love.