Today Fitbit announced that they are rolling out their new Daily Readiness Score to Fitbit Premium users. This covers the Sense, Versa 3, Versa 2, Charge 5, Luxe, and Inspire 2. As long as you have one of those devices and a Fitbit Premium subscription, then you get to activate the Daily Readiness score in your account.
The aim of the score is to provide you with a daily ‘How ready are you’ number, encompassing sleep, recent activity, and heart rate variability. From there, Fitbit will give you recommended workouts optimized for that score. And if your score is low enough, it’ll tell you to simply relax and recover (potentially with low impact items), rather than trying to push your body.
Over the last week I’ve been gathering data trying out the new score system, and seeing how it works. Further, I’ve been comparing it to other scores from other devices, including Whoop and Oura – all in an effort to see what makes the most sense.
With that, let’s dive into it.
Getting it Set Up:
Now before you go forward, you’ll need to consent to the daily readiness score. Meaning, you’ll specifically have to go into the Fitbit app and agree to this, else you won’t get a score. As a casual reminder, you also previously had to consent to do things like see your Stress Management score details. Frankly, this is bizarre. Not because asking for permission for the data it already asked permission for (yet again) is weird, but because it, in turn, means that Fitbit isn’t using any of your historical data. It’s not collecting anything new here, it’s already been collecting this data (for years).
As a result, you won’t get your score for 4 days, and then it’ll take another 10 days of fine-tuning until you reach Readiness Score happiness. I know this sounds trivial, but if the entire point of daily readiness score is personalization based on your historical data – then why throw all that data away from consideration? Point being, you need to consent to start. Also, you can actually remove consent and delete the scores later if you don’t like Fitbit or something.

![clip_image001[6]](https://media.dcrainmaker.com/images/2021/11/clip_image0016-1.png "clip_image001[6]")
Anyway, with that all set, now you go forth and do nothing for four days. And by ‘nothing’, I mean sleep and workout as normal. Fitbit notes that you need to get at least 3 hours of sleep per night for at least four nights, and that you need four days of wearing it (notably/ideally with three workouts in there somewhere). During this time frame, it’ll count down the days till magic appears:
![clip_image001[8]](https://media.dcrainmaker.com/images/2021/11/clip_image0018-2.png "clip_image001[8]")
![clip_image001[10]](https://media.dcrainmaker.com/images/2021/11/clip_image00110-2.png "clip_image001[10]")
After you’ve completed this onboarding period, you’ll get your first score.
So, let’s break down what Fitbit is capturing and displaying here. Note that in my case I did this test period with the Charge 5, but again, you can use any of the aforementioned Fitbit devices.
Readiness Score Details:
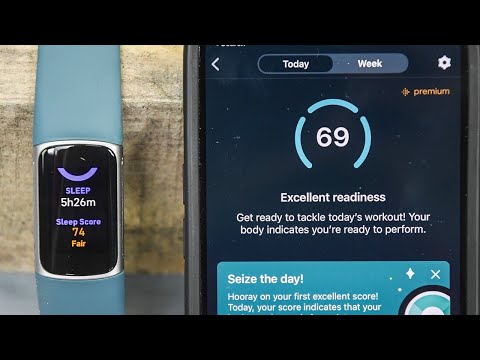
Each morning after you wake up and your sleep score is calculated, you’ll get your Readiness Score. It’ll be displayed within the Fitbit smartphone app:
![clip_image001[12]](https://media.dcrainmaker.com/images/2021/11/clip_image00112-2.png "clip_image001[12]")
That score won’t change for the remainder of the day, no matter what you do that day. This score is aimed at telling you whether or not you’re ready to tackle another workout, whether that workout should be harder, or whether you should take more recovery. It does this using data the watch is collecting in three core categories:
Part 1 – Activity Levels: It’s looking at your heart rate values over the course of the day, including both workouts and non-workouts, and figuring out how much effort you put out that day in terms of fitness fatigue.
Part 2 – Recent Sleep: The platform looks at not just your last night’s sleep, but weighs it with your last three nights’ sleep. Meaning if you’ve had a so-so night of sleep last night, but two solid nights prior, you’ll get more leniency than if you had three back to back to back crappy nights of sleep.
Part 3 – Heart Rate Variability (HRV): The unit measures your HRV score during your deep sleep. Historically speaking Fitbit has done HRV measurement over the course of the night, though I’ve asked for clarity on exactly which portions of the night they calculate the score from (more on why in a second).
With all three of these things put together, you’ll get a ‘Readiness Score’ that’s from 0 to 100 each day. The higher the score, the more ‘ready’ you are. The lower the score, the more recovery you need. The scores are bucketized into three buckets: Low (0-29), Good, and Excellent (30-100). You can see three examples of my score here:
![clip_image001[15]](https://media.dcrainmaker.com/images/2021/11/clip_image00115.png "clip_image001[15]")
![clip_image001[17]](https://media.dcrainmaker.com/images/2021/11/clip_image00117.png "clip_image001[17]")
![clip_image001[19]](https://media.dcrainmaker.com/images/2021/11/clip_image00119.png "clip_image001[19]")
Note that Fitbit is inconsistent on these numbers. In my actual usage, my score of ‘30’ got a ‘Good’ score. However, all their PR mockup screenshots from the past three months show a score of ‘30’ as a ‘Low’ score. Further, they don’t define anywhere at this point the top-end of the ‘Good’ score and where it transitions to ‘Excellent’. And finally, as you see above with my real-world 30, that fills the entire bar of the 2nd chunk, which seems weird – since obviously I’m a single unit away from being in the lowest category. That’s like having an odometer that shows you at 30MPH when you’re doing 70KPH on the highway. What’s the point?

In any event, you can tap on the readiness score to see how and why you got the score you did. Up top it’ll have some text, and then from there it’ll show your Active Zone minutes each day. Remember that Fitbit’s Active Zone minutes aren’t directly workout minutes, but a multiplier based on intensity. So a 40-minute workout (like yesterday) can earn 96 Active Zone minutes because it was painful enough.
As you slide down further you’ll see those three pillars shown – Activity, Recent Sleep, HRV, and how you scored in each one.
![clip_image001[21]](https://media.dcrainmaker.com/images/2021/11/clip_image00121.png "clip_image001[21]")
I can then tap on each of those categories to get a bit more detail on why it gave me that score. I like this, the approach is far more detailed than Whoop, or Garmin in terms of *WHY* something is contributing to a score (save one bit I’ll discuss in a second). Oura does a similarly good job here of contribution factors. Here’s Activity:
![clip_image001[23]](https://media.dcrainmaker.com/images/2021/11/clip_image00123.png "clip_image001[23]")
Then Sleep:
![clip_image001[25]](https://media.dcrainmaker.com/images/2021/11/clip_image00125.png "clip_image001[25]")
Then HRV:
![clip_image001[27]](https://media.dcrainmaker.com/images/2021/11/clip_image00127.png "clip_image001[27]")
What’s a bit unclear to me though is that given I had moderate activity, supposedly high sleep, and ‘average’ HRV, how I end up with a score of 39. I’m not necessarily disputing the feeling of 39, but more how those three bars end up giving me a 39, when visually if I average those, then I’d expect a 50-70 score:
![clip_image001[29]](https://media.dcrainmaker.com/images/2021/11/clip_image00129.png "clip_image001[29]")
So while Fitbit does a good job at explaining the *why* behind each component, they fail to explain how exactly each component contributes to your score. Meaning, is that ‘Moderate’ activity level hurting me? Is the ‘average’ HRV level bringing me down score-wise?
Scores aside, if we scroll down a bit we’ll see the recommendations for the day. In this case, it recommends 78-110 Active Zone minutes, which seems like an awful lot for a day with a readiness score in the 30’s. That’s roughly an hour-long workout at a moderately high intensity. Or 45 minutes at painfully high intensity.
![clip_image001[31]](https://media.dcrainmaker.com/images/2021/11/clip_image00131.png "clip_image001[31]")
And then below it recommends a slate of different workouts from the Fitbit Premium guided workouts catalog. The only challenge is none of these workouts would get me anywhere near that 78-110 Active Zone minutes, as all of them are in the 10-30 minute range, and all of them relatively low intensity (since Active Zone minutes are purely cardio based on heart rate zones).
![clip_image001[33]](https://media.dcrainmaker.com/images/2021/11/clip_image00133.png "clip_image001[33]")
![clip_image001[35]](https://media.dcrainmaker.com/images/2021/11/clip_image00135.png "clip_image001[35]")
Ideally it would have offered me a 45-60 minute workout at moderate to high intensity, which would have done the trick. Digging around the catalog they certainly have things in the HIIT range, and even some at those durations.
Finally, it’s worthwhile noting that Fitbit doesn’t display your Readiness Score on your wearable (Update: You can apparently add it to the Fitbit Sense, but not the Charge 5 or other units to my knowledge). Instead, you have to open the app. This seems strange to me, after all, they display your sleep score – and arguably our readiness score is more important than your sleep score. I would think ideally Fitbit would follow Suunto and Apple with a ‘Wake-up’ style message which displays your sleep/readiness stats for the day. Or at least, stick it in the same place they (Fitbit) stick the sleep score, on the ‘Today’ dashboard:

After all – if the point of the score is to provide value, then why hide it?
Comparison Scores:
I’ve been tracking comparison scores between different trackers over the last while. Of course, since I’m somewhat wrist-limited on my body, there’s only so many places to record data – especially since I’ve been having trouble getting accurate Whoop 4.0 sleep data anywhere but the wrist (it works great there, but sleep data fails on bicep or Whoop Body clothing positions). Point being, for this data set I’ve got the Fitbit Charge 5 on one wrist, Whoop 4.0 on the other, and the new Oura V3 ring on my finger. All 24×7.
Here’s the score comparisons for the last few days, once I cleared the initial ‘settling’ window of the Fitbit Charge 5. I’m past the settling windows on Oura and Whoop:
Monday Night:
Fitbit Readiness Score: 38
Fitbit Sleep Score: 74
Oura V3 Readiness Score: 67
Oura V3 Sleep Score: 70
Whoop 4.0 Recovery Score: 28%
DCR’s In My Head Score: Tired, I’d give sleep score a 50ish, but readiness in the 50’s.
Sunday Night:
Fitbit Readiness Score: 69
Fitbit Sleep Score: 79
Oura V3 Readiness Score: 77
Oura V3 Sleep Score: 73
Whoop 4.0 Recovery Score: 43%
DCR’s In My Head Score: Good sleep, ready to roll – solid 80’s readiness in my head.
Saturday Night:
Fitbit Readiness Score: 30
Fitbit Sleep Score: 64
Oura V3 Readiness Score: 57
Oura V3 Sleep Score: 62
Whoop 4.0 Recovery Score: 35%
DCR’s In My Head Score: Went to bed late, a little tired, but overall feel good, maybe in the 70’s.
–
Note that both Oura and Fitbit have additional Sleep Scores. One could (correctly) argue that the better comparison of scoring is Whoop Recovery vs Oura/Fitbit Sleep Scores, as technically speaking Whoop doesn’t take into account previous days’ activity/training load in their Recovery Score. Whereas both Oura and Fitbit do. Instead, Whoop’s Recovery Score is purely ‘What did you do last night’ driven. Whereas they give you a different daily training score, which is “How hard did you work today”. Anyways, just wanted to make that clear.
I’ll dive into both the Whoop 4.0 and Oura V3 in far more detail in my in-depth reviews slated for very shortly. At a high level you can compare them, but as with anything, the details and nuance depend on what you want out of each.
Of course, on the Fitbit side I’ve still got another 9 days in theory of wearing it before it reaches full happiness level. Though at this point I’m less concerned about the specifics of the score than I am about the usability of it.
Wrap-Up:
At a high level, I like how Fitbit has created the score and how they’re clear on where each component comes from. The fact that it takes into account more than just last night’s sleep is useful, as a single bad night’s sleep isn’t always disastrous (as anyone having trouble sleeping the night before a race can attest to). Similarly, inclusion of activity levels in a single readiness score is also quite logical – and ironically something very few companies actually do. Most divide up the training/activity load compared to the sleep side. This pulls it all together. Finally, in theory, recommended workouts based on that score is great, especially since Fitbit has such a diversity of workouts in terms of types of sports but also intensities.
Now the challenge though is that my real-life usage of it sorta leaves me with constantly asking “Ok, but why?”. For example, it says I have a 39 score yet recommends a pretty significant amount of high-intensity work today – thus, “OK, but why so much intensity then?”. Or it gives me the three pillars/components of the score that all show roughly mid to high ‘scores’, yet my overall score today is at 39 – thus, “OK, but why is more score lower than any given average piece?”. Or that its odometer has a mere three chunks, enabling me to score a 30, yet still appear to be at 70% on the graph – thus, “Ok, but why not just fill the progress bar up to match your score?”
Again – I really do like the structure of what Fitbit is doing, but in actual execution, it feels a bit unfinished – especially for a Premium-only feature.
With that, I’ll probably check in again down the road a ways to see if perhaps they’ve changed things based on feedback from users or their own data.
Thanks for reading!
FOUND THIS POST USEFUL? SUPPORT THE SITE!
Hopefully, you found this post useful. The website is really a labor of love, so please consider becoming a DC RAINMAKER Supporter. This gets you an ad-free experience, and access to our (mostly) bi-monthly behind-the-scenes video series of “Shed Talkin’”.
Support DCRainMaker - Shop on Amazon
Otherwise, perhaps consider using the below link if shopping on Amazon. As an Amazon Associate, I earn from qualifying purchases. It doesn’t cost you anything extra, but your purchases help support this website a lot. It could simply be buying toilet paper, or this pizza oven we use and love.


Your problem with the active minutes/sessions seems to be based on trying to score all your active minutes in training sessions. I thought the whole point of all day wearables (and certainly fitbit) is that your normal life also contributes to active minutes? I haven’t trained yet today but I already have 40 active minutes credited from just going about my normal daily activities.
It’s true, you can get active minutes that way. But for me, I don’t tend to get many active minutes in my day to day life. I’m not sure if it’s because my resting HR is so low that me getting into any sort of zone takes considerable effort, or perhaps, I’m just lazy. :)
Hi ray, what I see Fitbit is less explanatory than Garmin in its data and numbers that sound fantastic but it charges you a subscription …
Fitbit really puts so many sensors and data that it does not even know what to do with it, I have read many comments that the EDA sensor is totally useless, it is a number but it does not tell you anything, not even because it is that number …
As always great review Ray, I look forward to the WHOOP 4.0 review.
I’ve had the Charge 5 for two weeks. It came with 6 months of Premium so I’ll give it a six month evaluation. I’m unlikely to subscribe due to the cost/benefit analysis. My active minutes are all over the place. Like Kevin, I get minutes for normal daily activity but my high intensity workouts get the same treatment as normal activity for the most part. I wear a chest strap for higher intensity workouts so I know that my heartrate is much higher than what the Charge 5 is registering. For normal activity, the heartrate is fine.
The Charge 5 is a step up from my Garmin Vivoactive 3. Even with the compromises, it does what I need it to do.
Good deal.
Yeah, so if ones zones are configured correctly (admittedly, a big if), Active Zone minutes are earned in the fat burning zone at 1x multiplier, and then in the cardio and peak zones at 2X multiplier: link to help.fitbit.com
In my case, I clear into the fat-burning zone at a default low of 105 (which, is kinda silly). Whereas Cardio and Peak is 131 and 162 respectively.
How does Garmin’s Body Battery in the morning compare to your “In My Head Score”?
My experience with BB is that it’s fairly ok, but after 8+ hours of cycling and the score dropping to < 5 the score will barely go up again during the night and the next day; which is not consistent with "In My Head Score".
Garmin did tweak the Body Battery algorithm recently for the better, but this is one area where it still fails. Recently ran a 25km which dropped my Body Battery to 5 (felt more like 25). Then slept for 11 hours and it only recharged to 80 (felt more like 90+).
Body Battery also fails at detecting hard weight lifting sessions. A hard deadlift and squat workout does not have much effect on the score, even though my legs are knackered the next day.
For these last few days I didn’t track both head score and body battery, mainly because I had to take off the Garmin to fit the Fitbit on that wrist (only wanted one watch per wrist). With Whoop 4.0 having issues with Body/Bicep for me during sleep (not tracking at all), I went back to the wrist and thus ‘lost’ one of my wrists for another watch.
I think the challenge with any HRV-driven metric (including Body Battery), is it doesn’t tend to account for leg soreness, but rather overall fatigue. So for example, running down a mountain will absolutely destroy my legs if it’s the first time in a while, but the rest of my body feels fine.
Hi Ray, thanks for the insightfull article and post. Like, apparently many others, I’m also in the market for a device that provides ‘accurately’ (to the extent possible) a score that indicates how ready you are for workouts or the days, so based on fatigue levels/previous efforts/strain, sleep and HR measurements. From that point of view this article is really good but also looking forward to the Whoop review.
I hoped the body battery of Garmin would solve my problems, but what I find very annoying there is that if you wear a garmin watch that supports body battery but uses an Garmin Edge for cycling (which many people including me do), the cycling effort from the edge is not taking into account in the body batt score of the watch.
Do you know why or I garmin is going to solve this? I really do not understand why they don’t integrate this over devices, in that way they can cover the market that Whoop currently is aiming on but then with (more) accurate HR data..
This Mark Lewis guy on Youtube explained it fairly good also I think, search on YT for Mark lewis – Garmin NEED THIS NOW to fight off Whoop
Out of curiosity, why wouldn’t you wear the watch while cycling (even if not recording)?
apologies, I apparently did not do my reseach well. I want to have the data from the Edge activity (mainly HR date) to be used in the body battery.
I was under the assumption that a Garmin HRM cannot be connected to 2 devices at the same time, but based on your reply, searched and just found out it can.
So in theory I could go cycle with the Edge 530 and HRM band and at the same time have the HRM band connected to the watch to have accurate HR data for the body battery.
Only thing is then on the watch to start an activity also but discard it to ensure the HRM is used for HR measurement and not the sensor in the watch. (if my line of thinking is correct this time..)
Cool, that would mean I can upgrade my 735xt with a valid reason now :)
A couple of thoughts.
These products seemed to be designed for the ‘average’ user with relatively low level outputs. How would they score a typical pro cyclist doing 4 – 6 hours a day of intense work? Also, when measuring daily stress, does the scoring system take into account the value of a decade or two of solid base work in influencing recovery?
It should be easy enough to recommend what the athlete is capable of on any given day by an analysis of how they have responded to different stimuli historically.
Funny you ask that…
Whoop sponsors Team EF, and has all their cyclists using it. During the Tour, they basically max’d out the units load (strain) scores daily. Which technically speaking you can’t ever get to the max limit of 21, but practically speaking you sit at 20.8 or so.
It’s actually one of my issues with how the platform works, because nothing is really comparable to the average person, as going from 20 to 20.8 is a huge leap mathematically, but going from 10-18 is far less of a leap.
Whereas other training load platforms allow you to just accumulate load indefinitely. And that makes sense.
I’m not sure I agree with this assertion. I would consider myself an average user and my score this morning made absolutely no sense, hence why I went looking for explanations such as this article. I took a 64 minute walk yesterday, which lately due to the winter is higher than my recent average, but not higher than my “in my head” effort when weight lifting. My sleep was scored as “high” (good thing), my HRV was scored as “high” (good thing) ; stress management 88; readiness score…… 1 (low)
You can add your readiness score on the Today app on the Sense and Versa 3. You can also add it as a widget on those devices.
Ray, thanks so much, very interesting. I am a data geek and have used the Oura Gen 2 since 12/18. Awaiting Gen 3. Tried the Whoop back on 2019, very disappointed. But ordered the 4.0, which may arrive some time in 2022. The reviews are scary, numerous battery issues and unreliable data- brushing teeth-180+ HR! Have my Garmin 745, which I find solid. Bought a Charge 5 1 week ago.I have been impressed. Wrist HR marches within a beat or 2 of my Garmin on my wrist. GPS connects in about 15 seconds compared to my Garmin in about 5 seconds. GPS is off a little. 9 mile run on a tried and true route shows the Fitbit 9.21.
At 78 I am still running 40+ miles per week and walking our dog 2-3+ miles a day, which gives me over 1600 Intensity minutes(Garmin) and 817 Active Zone(Fitbit).
Been logging my road running miles for 45 1/2 years- currently at 96,3xx miles and counting.
My current Oura ring nails sleep and activity pretty well. Geez I ramble.
Ray, thanks again. You rule.Say hi to Bobby and your daughters. Nick
This is really good as usual! I’m still super confused, a readiness score of 30 out of 100 never looks good, but some reason Fitbit labels that as good. It makes no sense. And the big discrepancy between oura, Fitbit and whoop is also worrying as these are 3 top devices for HRV and readiness.
A readiness score that combines several factors seems a good idea, but in the end the HRV reading should be the only metric that should matter, because in theory it encompasses everything that happened in the short term (ie. the day before).
A good article about this: link to medium.com
However, the challenge with that, as he points out is that sometimes there’s just meaningless variation that doesn’t have any real impact on things. Even people who religiously track HRV in the most perfect way possible find frequent variations that aren’t really accounted for.
After all, there’s good reason why companies use all these other data points: It provides context.
Certainly using a single score for everything would be easiest for everyone (including the companies), but the real-world has shown us that HRV doesn’t really nail that perfectly – it’s just one component.
That’s not my takeout from the article. Yes, HRV can have big changes from day to day, that’s why it needs to be compared to a baseline and figure out trends (coefficient of variation is another important metric).
If for example I have a bad night’s sleep or a high intensity workout, then my HRV will probably be lower next day. If I would go and compute a Readiness score based on my low HRV and also my low Sleep Score and High Activity rating, I would in fact be penalizing the user twice (or thrice). If I’m the other hand my HRV was normal next day, then it means my body was not that affected by one bad night sleep or a high intensity workout, and that’s a good thing.
Like Marco Altini is saying “aggregating information gives the false expectation that the data becomes somewhat more insightful, while it is simply diluting the insight.”
But again, the challenge is assuming the HRV values are the end-all be-all of whether your body is ready for load or sleep. And there’s boatloads of evidence that indicates there are far more factors than just fatigue or training that influence it, including factors that don’t have anything to do with ones decisions around it.
This provides some good details/examples there: link to simplifaster.com
Thus, using just HRV alone lacks the context required to make decisions. Instead, you need those other factors. For example, in your case, if you had a good night’s sleep, plus an easy/reasonable training day, and felt reasonable/good – would you train that day as planned if your HRV value dropped that morning? My guess is yes, you would. You’d likely write off that value as a quirk.
Ultimtaely, that’s exactly what these readiness values are trying to do. Now, we can debate how each one weights things. That’s something I show here. I think Whoop’s weighting leads to lower than real values. I think Oura and Garmin tend to be pretty close. Fitbit seems imperfect right now.
Marco argues that you can’t compare readiness levels between devices – and that’s both true and untrue. Sure, they are all using different algorithms (and even different inputs) to decide whether you should do something big or not. But, from a consumer standpoint, all that matters is that end advice. Meaning, they’re absolutely comparable if I as a user receive a simple number/guidance on whether to move forward with training. It’s up to each company to make that number as realistic and valuable as possible.
Hi Ray,
very interesting post. As a long-time OURA 2 user, I am looking forward to your in-depth review of Oura3 and Whoop, too, and do have some suggestions.
I am doing HRV measurement for 2 years now, starting with HRV4training and Elite HRV apps using my iPhone, filled Excel Sheets with that data, used my Garmin 945 with some 3rd party hrv apps, calculated rolling averages, and finally ended up with OURA about 18 months ago. It was a great choice. I kept exporting the data to HRV4training to get the rolling averages automatically.
Why I am looking for a new solution? Well, I did get a ton of / in case of OURA / solid data but could not make much out of it. I did several analyses on their web platform and also exported the raw data but could not manage to find any mathematical relevant correlation within the data. I assume WHOOP users may have an advantage here as they do get analysis/ comparison of their data with peer group data and analysis of the influce of the daily tags they set. Within Oura, tags do not matter.
What I wish from a review? As I read, you do comparison with your subjective feeling, which is great for the upcoming review. I think this is key. Otherwise all these platforms only collect data without interpretation. I am not looking for the most exact HRV measurement, but for a platform that gives me some training advice and identifies patterns/correlations.
During my OURA usage time I had some illnesses, vaccination shots, a one week training camp, some serious and structured training and some lazy time. Surprisingly RESPIRATION RATE beside BODY TEMPERATURE were the only solid indicators that gave me a warning about my fitness status.
So, I would like to read more about your experience in how the data and the app advice / if there is any / fits with your subjective feeling.
Thanks
bobo7
Bono 7. Great read. Thanks for sharing. Been with Oura just shy of 3 yrs(35months) and have experienced similar observations. Truly not like your deep exploration.👍
Not sure their algorithms get much data from very active folks in their late 70’s. At 78, my HRV and Deep Sleep numbers have declined as well as Max Heart Rate. Not complaining, just grateful to be healthy and still running.Nick
Thanks for the overview!
Do you know if stats from partners like Strava that are synced back to Fitbit are taken into account? For example, if I wear my Sense during a ride that is tracked via a Garmin Edge 530, but I did not have the Sense in exercise mode? I know stats do show in Fitbit after they are uploaded to Strava, but just not sure if Readiness takes that into account since it didnt recorded it.
How long did you test the feature for? I just activated it and it said it will take 4 days to achieve first readiness score, but it also pretty clearly said it would take 14 days to calibrate itself to you. Thinking that might explain the weird 30s even when you felt pretty good?
About 8 days, which I noted in the post I hadn’t reached the full 14 days yet.
That said, I’d also argue that’s of Fitbit’s own doing. The fact that when you toggle it that it doesn’t just look at the exact same data it already has seems silly to me. There’s no reason it needs to wait 4-14 days after giving consent. It’s not collecting any new/additional data.
I believe that technically, Whoop *does* factor in yesterday’s activity into their Recovery score, just indirectly. Part of Whoop’s Recovery score is based on how much you slept vs. your calculated sleep need, and your sleep need is based in part on your strain from the previous day. So, days with lots of activity require you to sleep more that night to achieve a high recovery score the next day. All else being equal (HRV, RHR, RR, and Sleep Hours), recovery will be lower following days of high activity, since your % of sleep need would be lower.
Is this similar to Fitbit Active Zone minutes?
No, pretty different. Active Zone minutes basically cover when your heart rate rises (typically for a workout, but even just for a faster paced walk).
Whereas Readiness Score is about taking that, and primarily your sleep, to determine how ready you are to add workouts (or instead, not do workouts) the following day.
Can we sync the data from older Fitbit models to this one?