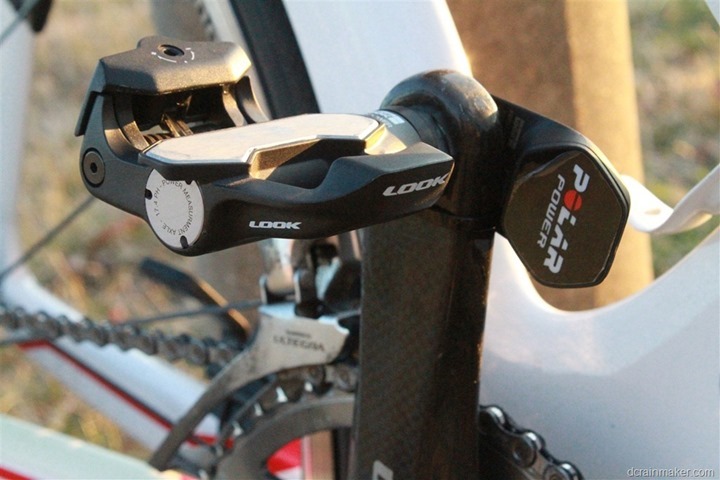
Earlier this week a peer reviewed university backed research paper was released that essentially said that Polar power meter pedals shouldn’t be trusted, and that instead, SRM was better:
“The power data from the Keo power pedals should be treated with some caution given the presence of mean differences between them and the SRM. Furthermore, this is exacerbated by poorer reliability than that of the SRM power meter.”
Following that, a not-so-small flotilla of you e-mailed me the paper and asked for my thoughts. There was even a long Slowtwitch thread on it, as well as a Wattage Group discussion on it.
It wasn’t until two nights ago that I got around to actually paying the $25 to read/download the study, which was published in the “International Journal of Sports Physiology and Performance”. Like most fancy organizations, the inclusion of ‘International’ and ‘Journal’ somehow translates to the rest of us in non-academia to “must be right and smarter than I”. So much so that some cycling press even picked up the story yesterday, without apparently digging into the claims much.
Except…here’s the problem: The supposedly peer-reviewed paper was so horribly botched in data collection that the results and subsequent conclusions simply aren’t accurate.
Now, before we get into my dissection of the paper – I want to point out one quick thing: This has nothing to do with Polar or SRM, nor the accuracy of their products. I’ll sidestep that for the moment and leave that to my usual in-depth review process.
Instead, this post might serve as a good primer on why proper power meter testing is difficult. So darn difficult in fact that four PhD’s screwed it up. What’s ironic is that they actually hosed up the easy parts. They didn’t even get far enough to hose up the hard parts.
The Appetizer: Calibration
The first question I respond with anytime someone asks me about why their two power meter devices didn’t match is how they calibrated them (and, how they installed them). When it comes to today’s power meters, so many are dependent on proper installation. For example, if you don’t torque a Garmin Vector unit properly, or or don’t let a Quarq settle a few rides and re-tighten a bit, or if you don’t get the angles right on the Polar solution. Installation absolutely makes the difference between accurate and non-accurate.
In this case, they didn’t detail their installation methods – so one has to ‘trust’ they did it right. They did however properly set the crank length on the Polar, as they noted – which would be critical to proper values. They also said they followed the calibration process for the Polar prior to each ride, which is also good. Now on the older W.I.N.D. based Polar unit they were using, there isn’t a lot of ways for you to get detailed calibration information from it – but, they got those basics right.
Next, we look at the SRM side of the equation. In this case they noted the following:
“The SRM was factory calibrated 2 months before data collection and was unused until the commencement of this study. Before each trial the recommended zero-offset calibration was performed on the Powercontrol IV unit according to the manufacturer’s instructions (Schoberer Rad Meßtechnik, Fuchsend, Germany).”
Now, that’s not horrible per se, but it’s also not ideal for a scientific study. In their case, they’re saying it was received from SRM two months prior and not validated/calibrated by them within the lab. While I could understand the thinking that SRM as a company would be better to calibrate it – I’d have thought that at least validating the calibration would be a worthwhile endeavor for such a study. Having factory calibrations from power meter companies done incorrectly is certainly not unheard of within the industry, though albeit rare. On the bright side, they did zero-offset it each time.
The Main Course: Data Collection
Next, we get into the data collection piece – and this is where things start to unravel. In their case they used the SRM PowerControl IV head unit with the SRM power meter. Why they used a decade old head unit is somewhat questionable, but it actually doesn’t impact things here.
On the Polar side, they went equally old-school with the Polar CS600x, introduced eight years ago in 2007. Now, in the study’s case they were somewhat hamstrung here as they didn’t have many options with using the W.I.N.D. based version of Polar’s pedals (the new Bluetooth Smart version only came out about 45 days ago). Nonetheless, like the older SRM head unit choice it really didn’t matter much here. It’s not how old your sword is, but how you use it. Or…something like that.
Now, when it comes to power meter analysis data – it’s critical to ensure your data sampling rate is both equal, and high (The First Rule of Power Meter Fight Club is…sampling rates). Generally speaking you use a 1-second sampling rate (abbreviated as 1s), as that’s the common demonstrator rate that every head unit on the market can use. It’s also the rate that every piece of software on the market easily understands. And finally, it ensures that for 99% of scenarios out there (excluding track starts), you aren’t losing valuable data.
Note that both of these have nothing to do with the power meters themselves, but just the head units.
Here’s how they configured the SRM head unit to collect data:
“Both protocols were performed in a laboratory (mean ± SD temperature of 21.8°C ± 0.9°C) on an SRM ergometer, which used a 20-strain-gauge 172.5-mm crank-set power meter (Schoberer Rad Meßtechnik, Fuchsend, Germany) and recorded data at a frequency of 500 Hz.”
Now it’s a bit tricky to understand what they mean here. If they were truly doing 500 Hz, that’d be 500 times a second. Except, the standard PowerControl unit doesn’t support that, only a separate torque analysis mode which best I can tell max’s out at 200 Hz. What would have been more common, and I believe what they actually did is .5s on the head unit. This means that the head unit is recording two power meter samples per second. That by itself is not horrible, it just makes their lives a bit more complicated as SRM is the only head unit that can record at sub-second rates. So you have to do a bit more math after the fact to make things ‘equal’. No worries though, they’re smart people.
What did they set the Polar to?
“Power measured by the pedal system was recorded using a Polar CS600X cycle computer (Polar Electro Oy, Kempele, Finland), which provided mean data for each 5 seconds of the protocols.”
Hmm, that’s strange. They set the Polar to 5s, or every 5 seconds. That means that it’s not averaging the last 5 seconds, but rather taking whatever value occurs every 5 seconds, ignoring whatever happened during the other 4 seconds.
Of course what’s odd here is that the CS600x for all its faults is actually perfectly capable of recording at the standard 1s frequency that the rest of the world uses for power meter analysis. The manual covers this quite well on page 30, so it’s certainly not hidden (it can also be set to 2s, 5s, 15s, or 60s. Now oddly enough, they do seem to understand the implications of the situation, where later in the study they note:
“…This was due to the low sampling frequency and data averaging of the cycling computer that accompanies the Keo pedal system. This was not sensitive enough to allow accurate determinations of sprint peak power.”
So…why didn’t they simply change the frequency? Perhaps because 5s is actually the default. Or, perhaps because they didn’t even realize you could change it. Either way, I don’t know.
But what I do know is that it would turn out to be the fundamental unraveling of their entire study.
(Note: There are some technical recording aspects that can actually make things even worse above, such as accounting for how each power meter transmits the actual power value based on number of strokes per second, which varies by model/company. But, for the purposes of keeping this somewhat simple, I’ll table that for now. Plus, it just compounds their errors anyway.)
Dessert: A sprinting result
So why does recording rate matter? Well, think of it like taking photographs of a 100m dash on a track. And from only those photographs you wanted to give people a play-by-play of the race afterwards. That’d be pretty easy if you took photos every 1-second, right? But would it if you only took photos every 5 seconds?
In any world class competitive men’s 100m race that’d only result in one photo at the start, one in the middle, and one just missing the finish tape breaking (since most are done in slightly under 10-seconds).
That’s actually exactly what happened in their testing. See, their overall test protocol had two pieces. The first was a relatively straight forward 25w increment step test. In this test they incremented the power by 25w every two minutes until exhaustion. This is a perfectly valid way to start approaching power meter comparisons – and a method I often use indoors on a trainer. It’s the easiest bar to pass since environmental conditions (road/terrain/weather) remain static. It’s also super easy to analyze. In this test section, they note that the SRM and Polar actually matched quite nicely:
“There was also no difference in the overall mean power data measured by the 2 power meters during the incremental protocol.”
That makes sense, with two minute blocks and using only median data (more on that later), they’d see agreement pretty easily. After all, the power was controlled by a trainer so there would be virtually no fluctuations.
Next, came the second test they did, which was to have riders do 10-second long sprints at maximal effort, followed by 3 minutes of easy pedaling. This is where they saw difference:
“However, the Keo system did produce lower overall mean power values for both the sprint (median difference = 35.4 W; z= –2.9; 95% CI = –58.6, 92.0; P= .003) and Validity and Reliability of Power Pedals combined protocols (mean difference = 9.7 W; t= –3.5; 95% CI = 4.2, 15.1; P= .001) compared with that of the SRM.”
Now would be an appropriate time to remember my track photo analogy. Remember that in this case the SRM head unit was configured to be measuring at every half a second, so during that 10 seconds they took 20 samples. Whereas they had the Polar computer measuring at every 5 seconds, so it took 2 samples. It doesn’t take a PhD to understand how this would now go horribly wrong. Of course the results would be different. You’re comparing two apples to twenty coconuts, it’s not even close to a valid testing methodology.
They simply don’t have enough data from the Polar to establish any relationship between them. In the finish line analogy, we don’t even have a photo at the finish – they completely missed that moment in time due to sampling. Who’s the winner? We’ll never know.
(Speaking of which, in general, I don’t like comparing only two power meters concurrently. They doesn’t really tell you which is right or wrong, but rather that someone is different. To at least guesstimate which is incorrect, you really need some other reference device.)
Tea & Coffee: Analysis
Because I live in Europe now, a tea or coffee course is mandatory for any proper meal. And for that, we turn to some of their analysis. Now at this point the horse is dead – as their underlying data is fundamentally flawed. But still, since we’re here – let’s talk about analysis.
In their case, throughout the study they only used ‘Mean’ and ‘Median’ values for comparisons. Now, for those who have long forgotten their mathematics classes, ‘Mean’ is simply ‘Average’. Take the sum of all values and divide it by the number of values. Where ‘Median’ is taking the middle value of all the data points collected.
The problem with both approaches is that when it comes to power meter data analysis – it’s actually the easiest bar to pass. You’ll remember for example me looking at the $99 PowerCal heart-rate strap based ‘power meter’. Using the averaging approach, it does quite well, as when you average longer periods like 2-minute blocks at a steady-state value (as they did in the incremental test), it’s super-easy to get nearly identical results (as they did in the study). It’s much harder to get accurate results using such a method though in short sprints, due to there being slight recording differences and protocol delay.
Instead, when comparing power meters you really want to look at changes over different time periods and how power meters differ. You want to understand things like how and when they are different, as well as why they might be different. For example with their approach of 5s recording, they wouldn’t have been able to properly assess a 10-second sprint, nor variations that would have occurred at the peak power output.
Which, ultimately takes us to the most important point: You have to understand the technology in order to study it.
I’m all for people doing power meter tests, I think it’s great. But in order to do that you have to understand how the underlying technology works. That means that you have to understand not just the scientific aspects of the outputted data, but also how the data was collected and all of the devices in the chain of custody that make up the study. In this case, there was a knowledge gap at the head unit, which invalidated their test results (a fact that I don’t think even SRM would dispute).
Lastly, it’s really important to point out that the vast majority of accuracy issues you see in power meters produced these days aren’t easily caught indoors. Too many studies are focusing on testing units there, when in fact they need to go outdoors in real conditions. They need to factor in aspects like weather (temperature changes and precipitation), as well as road surface conditions (cobbles/rough roads). These two factors are the key drivers today in accuracy issues. Well, that and installation.
I’ve had a post on how I do power meter testing sitting in my drafts bin now for perhaps a year or so, perhaps I’ll dust it off after CES and publish it. And at the same time, I’ve also been approached by a few companies on getting together and establishing some common industry standards on how testing should be done – for old and new players alike. Maybe I’ll even get really all New Year productive and take that on too.
In the meantime, thanks for reading!
FOUND THIS POST USEFUL? SUPPORT THE SITE!
Hopefully, you found this post useful. The website is really a labor of love, so please consider becoming a DC RAINMAKER Supporter. This gets you an ad-free experience, and access to our (mostly) bi-monthly behind-the-scenes video series of “Shed Talkin’”.
Support DCRainMaker - Shop on Amazon
Otherwise, perhaps consider using the below link if shopping on Amazon. As an Amazon Associate, I earn from qualifying purchases. It doesn’t cost you anything extra, but your purchases help support this website a lot. It could simply be buying toilet paper, or this pizza oven we use and love.

