
Upon the conclusion of my Las Vegas trip last month, I took a 40 minute flight over to Long Beach, California (greater LA area) to visit the folks at ERO Sports. I’ve long followed the Alphamantis work around aerodynamics, and have seen early closed-door prototypes over the past few years. So I was looking forward to checking it all out in a production capacity.
The testing would occur at the VELO Sports Center track, which is an indoor velodrome normally used by track cyclists. The velodrome was originally outdoor during the 1984 Olympics, and lasted until 2003, when it was demolished and re-built as an indoor structure.


We had blocked off about 5 hours of time at the track for just our use. Interestingly, afterwards some of the local kids cycling teams were out training on it:

The goal of the Alphamantis system is to be able to determine aerodynamic drag in a dynamic environment. In other words, while you’re riding your bike and going somewhere – rather than just being put on a trainer in a wind tunnel. This post focuses on how they’re doing that indoors in the track. Down the road they’ll be moving that to outdoors as well (including all the complexities that comes with measuring wind and wind direction in real-time).
While the system is built and designed by a company called Alphamantis (based in Montreal, Canada) – the operators of that platform is a company called ERO Sports, which is based in Carson, California. The technology behind Alphamantis was largely locked down to the Canadian cycling teams until the completion of the 2012 Olympics in London. Since the Olympics, that’s been expanded and and is now being used by national teams, the world’s top pro cycling teams, and individual pro athletes in sports like triathlon.
I should point out this isn’t a ‘Review’ of their services. I didn’t experience that, the focus as you’ll see wasn’t actually on me as an athlete. Instead, I was trying to understand how it technically works – and then some fun scenarios and tests around it. Because of my travel schedule, I was unable to join the rest of the media folks that were there a few weeks prior during a day of presentations/testing – so during a trip I had nearby, I arranged time with them to get an inside look at how things work. But a review of their services/offerings this is not.
Pre-testing:
Prior to getting on the track you’ll need to come prepared with whatever you’d use in training and racing. This is probably a logical time to point out that you should really train on the same equipment that you race with. I know this sounds obvious, but I often hear folks that train on entirely different bikes than they race with. Of course, I don’t think anyone expects you to train with an aero-helmet though.
In my case, I brought with me my bike (triathlon), as well as my trisuit and aero-helmet. And of course all the normal stuff like cycling shoes, bike computers, etc… Ultimately, you want this to be exactly like what you’d show up on race day with. So if you’re taking a Bento Box on race day – then yes, take that too. As you’ll see, all those things really do matter.
At any rate, you’re going to show up to the Velo Sports Center, which houses the aforementioned velodrome in Carson, California – just a few miles away from the Long Beach airport (which is a few more miles away from LAX). The Velo Sports Center sits within the Home Depot Center grounds.

Here’s the outside of the building:

Once you arrive, you’ll check-in at the front desk to sign some waivers. Roughly they translate to “if you crash, it’s your problem”. Ok, noted.

From there you’ll head over to get fit on your bike. While most serious athletes coming into a facility like this would probably have been fit before, the ERO team does want to briefly take a look at things. In my case, they did it purely to demonstrate the technology – though we did end up re-rising my saddle and aerobars up to where they should have been the last time I was fit (ironically, it ended up almost spot-on where it was configured a long while ago before things slowly slid out of compliance).

The fit process includes adding a bunch of stickers to you, which the sensor system (that bar on the tripod below) reads and understands.

These sensors are then reflected on a TV screen showing a wireframe model of your position on the bike. At the same time, that system is recording the exact distances/angles.

This can then be combined with the Retül fit bike, which enables them to slowly tweak your position on a bike that doesn’t require you to get off the bike to feel the difference. So he’s able to simply adjust the bike in real-time and I can feel the differences between positions.

In my case, since I was mostly focused on understanding the track portion for this post, we only spent a few minutes here in this area. Additionally, in my case we did the change in seat height after my runs on the track (just for those Slowtwitch folks who might want to say my seat is too low…which it was.)
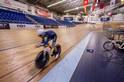
Testing on the Track:

This is probably as good a time as any to point out that I’ve never been on a velodrome track before. I was relatively confident that I’d not only crash, but would manage to do so just walking across the track.

Everything is setup inside the track down near the starting line area. In this case, their setup includes computers to monitor the sensors in realtime, timing systems to monitor exactly when you complete each lap, and an Alphamantis Bridge that transmits and repeats your ANT+ sensor data in realtime from your bike to the computers via WiFi– no matter where you are in the velodrome.

At a high level, the system is designed to produce an aerodynamic drag value based on the known (very precise) distance around the track in conjunction with your bike transmitting data from an ANT+ speed sensor and ANT+ power meter. By understanding how much power is required to go a given speed on a specific surface without any wind, they’re able to determine the drag. Obviously, more drag is bad. Less drag is good. This drag value is measured in CdA, which is the aerodynamic drag area. Less is better.
In order to start things off, they’ll precisely measure out your wheel circumference, which is used by the ANT+ sensor and corresponding computers to measure speed. It’s critical this is absolutely perfect – hence why they measure it out with a tape measure.

Note that if you don’t have an ANT+ speed/cadence sensor on your bike, they have spares. It was interesting to see how frequent they are parsing the data. For example, during travel my speed sensor had gotten bumped out of alignment. As a result, when we did the first warm-up set, you can see how many false-positives it was getting (Green), and even the speed-only sensor (another ANT+ sensor on my bike) was having some troubles. Yet, the PowerTap speed was very constant (no dependency on having the magnet aligned right). Even more interesting is that my Garmin head unit thought the world was perfectly fine as far as readings go. Only the more detailed real-time reporting surfaced it as seen below.


Next is then pairing your ANT+ power meter to their system. Their system can pickup multiple power meters at once (which was actually interesting in my case since I had a few), though they focus on just using a single power meter normally. Note that like the ANT+ speed sensor, they can loan units here as well. I’ll talk more about the power meter aspect a bit later.
With those things all setup and paired, it’s time to get out and ride. In my case since I’d never ridden on the track before, they gave a few hints. This essentially boiled down to ‘don’t go slow on curves’, and ‘don’t stop’. If both of those rules were respected, I’d in theory not crash.
Thankfully a bunch of smart guys and theories worked out. I started off just riding around the very bottom, not even so much on the curves, and then over the course of a few laps I got more and more comfortable until I was up a bit on the wall. For the purposes of all of the testing here, they want you as close as possible to the thin dark blue line near the bottom.

Fear not, you don’t have any reason to go up high.
Now, they actually want you to track that line as close as possible. But even if you don’t, it’s alright, they’re able to see that variation since they know your exact speed throughout each loop – and then further reconcile that with data each time you trip the sensor at the completion of each loop around the track. In fact, if you look at my lap by lap summary information, you can see the slight variations in the distance I went as I’d wander a few inches here and there on the line.

They noted that anywhere within about a foot or so is more than sufficient for accuracy.
Now that I got comfortable going round and round, it was time to calibrate my power meter. We tested against all three power meters I had on my bike, but for most tests we used the PowerTap, since (as I explain later), it’s the closest power value to the equations being used.
The calibration of the power meter is done every single test set, always after about 2 full laps (to clarify, technically this is just a zero offset, not a full-stop calibration). As I enter that third loop they’ll give me the signal to calibrate. In my case I just simply coast along the backstretch and they’ll confirm they received the calibration notification via the ANT+ repeater.
The actual test data then is gathered after the completion of that loop.
The reason for the constant calibrations is because the power data is so critical to getting accurate numbers. And drift can occur for any number of reasons – though primarily environmental (temperature shifts).
Now onto the actual testing.
Each test set involves about 10 loops. The reason for this is to attempt to determine the actual patterns. As you’ll see, tiny changes to your position or bike can make a substantial and visible difference. Thus if you just did a single loop, you might have numerous false positives.
First we started off with a baseline – this would be used to compare any future changes to equipment or position. Because it can actually be fairly hard to hear in there, for each loop they’ll tell you how many loops left via hand signals.

Then, after the baseline we moved into testing different setups and configurations. For example, some of them were person-specific that involved no equipment shifts. In this case, it was just shrugging my shoulders (relaxing them). In many triathletes, this will result in an immediate and notable gain in aerodynamic efficiency.
In my case…not so much. While there was some almost perceptible gains, one could see over the course of that 10-loop test set that I slowly unconsciously shifted back to normal – mostly because it didn’t feel natural. However, if you look at the below chart, you’ll see one of their regular athletes that was able to very clearly show this.
Look at the bottom right chart, and then notice about 60% of the way across it the red line dips down. That dip is the slight change in shoulder position.

And in fact, that’s a really interesting point here. As they noted numerous times, just because you can put someone in a given position – doesn’t mean that person can ride that position for 5+ hours (as in an iron-distance race). A 40K time-trialist has very different needs than someone who’s going to run after it. Or run a marathon after it. Or eat during the race. All impact position and whether or not an athlete can hold that position.
Some of it, of course, is adaptation on the part of the athlete, and some of it is finding other ways to gain those efficiencies.

From there the afternoon progressed as a series of tests – I did some 25 miles of loops around the Velodrome. That may not sound like a lot in the scheme of an outside ride, but that’s actually a lot of loops (over 100).
Perhaps the most interesting revelation here is just how person-specific aerodynamics are – far more than I would have thought. Going into this, I would have thought that Helmet A vs Helmet B is a simple case of ‘Helmet A is more aerodynamic than Helmet B”. When in reality, it’s far more based on the positioning of that helmet on a given person. Thus as they’ve seen (and showed me) – on one person Helmet A is faster, while on another, Helmet B is faster. And that applies to many more things than just helmets – from full bikes to tiny details such as hand placement.

As we looked at positions, they brought out a few riders that have significant experience riding on the track – and that can more easily demonstrate some of the changes and impacts to aerodynamic position. Everything from shifting one’s position on the aerobars, to just how one grips the bars themselves. Or shrugging shoulders. Or changes in aero helmets or regular helmets.
Post-Testing Results:
While basic ‘better or worse’ information is given in real-time while at the track, there’s additional information that’s handed over a few days later. This information includes the lap-by-lap detailed numbers of each test set that was done. It also includes summary information. I’ll walk through examples of the files, and then explain my thoughts.
The whole PDF file includes many different pages of information. But it starts off with a summary page. Again do keep in mind that in my case, we weren’t aiming for making me faster – the goal was simply to allow me to understand the technology and test a few other random things. As a baseline number, .2935 is actually pretty high. They suspect that cleaning up the cabling (brake/gearing) towards the front end of my bike would go a long way towards reducing that number.

Once we get beyond the summary information, we get much of the same in a more graphical layout:

Then comes the more detailed information for each wattage level that’s calculated. The tests are listed along the bottom.

I then get information about each test run within the set, all part of the booklet. The test runs can then be tied to a specific scenario (i.e. with aero bottle, without, etc…).

Ultimately though, you’re going to likely make most of the time saving changes immediately on the track, rather than looking too much at the reports later on. Further, for most riders, the reports would help them to quantify the time savings made that day as they progressed through different iterations. The weekend I was there it was scheduled that a top triathlete was going to ride the next day. Unfortunately things got rescheduled, as it would have been interesting to see that progression over the course of the day from a numbers standpoint.
Now, the challenge here is that this information isn’t terribly ‘portable’. Meaning, it really is all about you. And even more specifically, you on that specific bike. I attempted to explain this during my review of the Profile Design Aero HC.
While on the surface it may seem that you could take this information and compare your aerodynamic your significant other (if he/she raced), in reality that’s actually somewhat difficult. Variables such as the power meter used can impact the final numbers. In fact, we tested this a bit using the three different power meters on my bike. Each resulted in different numbers – due to the fact that all three measured power in different locations. Further, that testing is based on the accuracy of that particular unit on your bike. This is one of the reasons why they re-calibrate each test set, to mitigate against drift. So even comparing a test from this week to one four months from now might be difficult with just a given power meter, let alone two different power units on two different bikes.
To mitigate this they are looking at potentially just providing power meters that they own for the testing – rather than using each persons own power meter. Of course, that introduces significant logistical complexities.
They have found some patterns (both in general, as well as even in my session), Andy from Alphamantis noted that:
“Between the PowerTap and Quarq, the PowerTap is closer to physics, whereas the Quarq is closer to physiology. This is due to being closer to the the wheel due to loss of drive train/etc, and thus closer to what we’re measuring.”
Now, don’t mis-read this statement. This isn’t saying the PowerTap is more accurate (actually, it’s almost saying the opposite). What they are explaining is that because they are ultimately measuring your data based on the track surface, the PowerTap is physically closer to the track from an output standpoint. Versus the Quarq power output stream needs to take into account drive train loss – which could be variable (but the Quarq is closer to your actual human output). And while it’s a very tiny variable, for this scenario, that variable can make a difference. Below is a visualization of that data as it hits the system. As you can see, the differences there can and would have an impact on the results. As long as you stick to one of them though, you’d have a consistent baseline from which to work from for that specific day.

(Note: This is showing a given set, thus the drop you see below the 50s marker is the calibration occurring)
All that said, for same-day testing, all of that is mostly nullified through the calibrations. Hence the reason so many top pro cycling teams and individual pro cyclists/triathletes are using it in blocked off time periods. They aren’t as much trying to compare it to data from months ago, but rather making tweaks that can be immediately applied.
Random Tidbits:

Going into the testing, I had cobbled together some thoughts on fun things to test while there. What I found though is that the day becomes a little bit of a case of ‘Riddle me this’. Meaning, you can stand around as a bunch of data geeks and ponder: “Riddle me this: Is it faster to have the GoPro on the bars, or mounted just above the wheel?” or “Riddle me this: Is it faster to use this water bottle, or that water bottle?”. Ultimately, each one of these exercises takes a fair bit of time to get the baseline established (10 laps), then the test for each (10 laps per test). But that’s sorta what makes it so fun.
I could have sat there for days pondering ‘Riddle me this’ type questions with this group of folks. The inner-data geek I suppose.
Of course, the challenge with that is then taking one of those tests and validating it on other riders. That’s where all of a sudden a test suite that you could have knocked out in 20-30 minutes becomes something that could take hours with a small army of testers.
In any case, using the limited people I had handy, we did play around with a few scenarios for fun. For example, a GoPro. What impact does a GoPro have on aerodynamics? We did a test with one of the riders there where we placed a GoPro on a road bike.

First up, was the baseline. The way the average works is the set high (red) and low (green) CdA values are thrown out (excludes lap #1 as always), and then everything else is averaged:

Then, the GoPro up above the bars:

And then finally, the GoPro below the bars:

Results:
Baseline: .3279
Above Bars: .3305
Below Bars: .3262
It comes out virtually a wash. In fact, technically it was slightly faster below the bars than baseline – which likely can be explained by the road bike position being slightly more dynamic than the time trial position. In any case, you can see there’s very little impact to CdA here from the GoPro. This sorta surprised us both.
Looking at the triathlon bike, we did some tests there as well. I placed it below the aerobars. In fact, the impact was less than the impact of the aerobottle system.

Ultimately I think it would be an absolute blast to sit there and test all sorts of interesting things. And then potentially to go to a wind tunnel and test the same things. Understand how the different testing methodologies (and results) differ, and what that means to consumers.
Summary

As a data geek, I found the time at the track fascinating. As a triathlete, I found it eye-opening to see what an impact aerodynamics may have. But even more importantly, to understand that just because something saves time doesn’t mean it’s viable – especially for long-course athletes going 5+ hours on a bike in time-trial position. Though at $800 for a session (including fit), it’s a pricey option for age group athletes. Thus I suspect you’d likely only see front of the pack AG’ers in there – of course along with professional athletes.
I think that the indoor track testing is an incredible tool to start to understand how to literally get free speed – even with no equipment changes, and do so in an environment where you’re actually riding. The next step will be extending that outdoors to controlled locations (such as Formula 1 style tracks which can be ridden without interference), to take into account aspects such as wind at various angles.
Is this better than a wind tunnel? It’s not a simple yes or no question. It’s probably better when a rider is involved, because it can be fit to actually riding. Whereas when a simple piece of equipment is tested – then using a wind tunnel makes more sense. But of course, as you’ve probably come to realize – one starts to seriously question the usefulness of generic wind tunnel test data using the marketing of much of the equipment we buy, especially given how obviously individual the results may be from person to person.
As always, if you have any questions – feel free to drop them below. Thanks for reading!
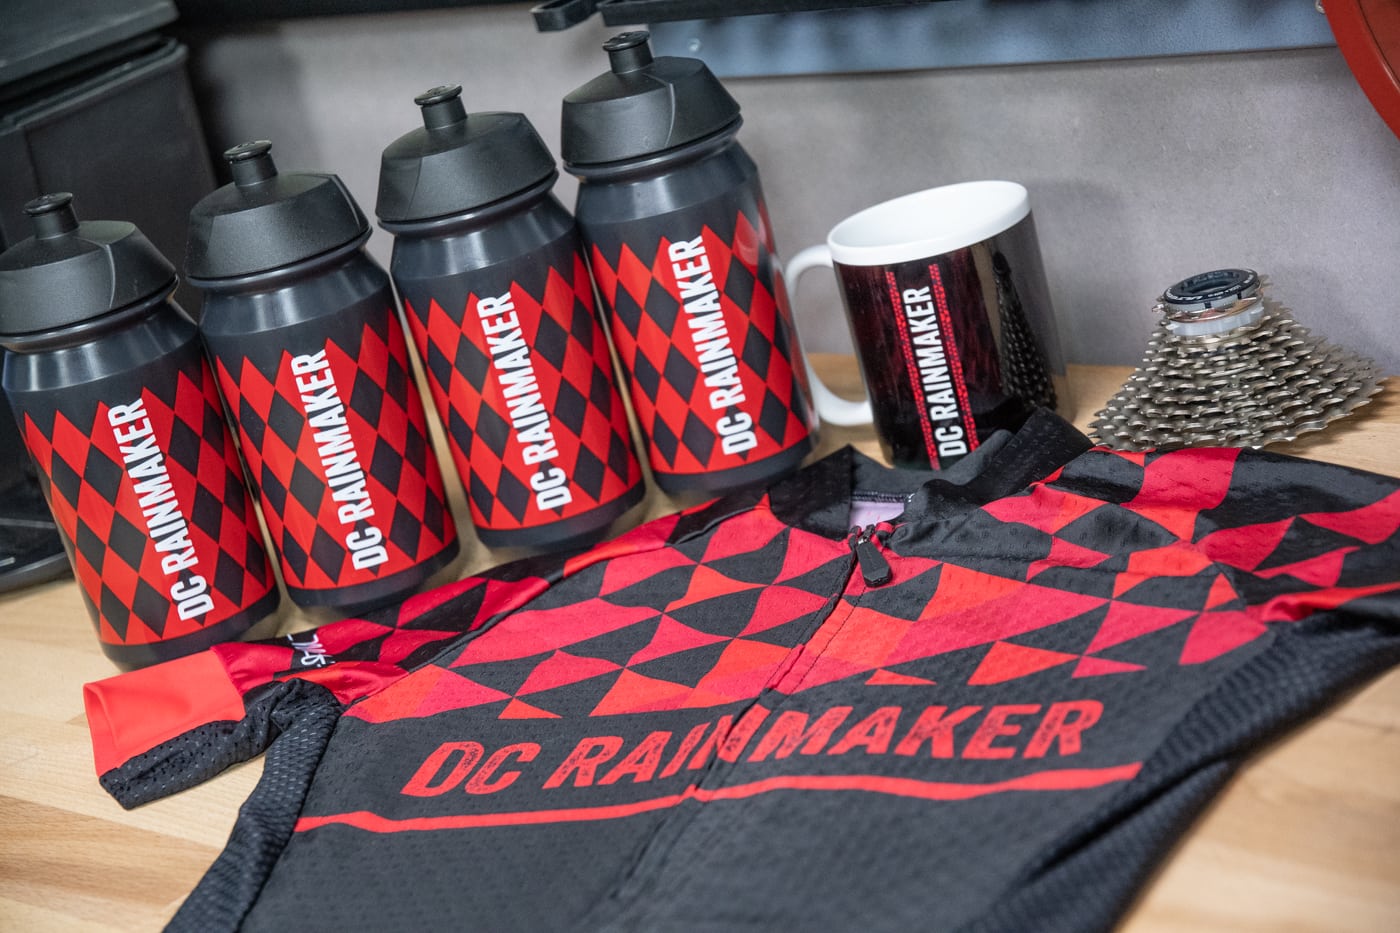
FOUND THIS POST USEFUL? SUPPORT THE SITE!
Hopefully, you found this post useful. The website is really a labor of love, so please consider becoming a DC RAINMAKER Supporter. This gets you an ad-free experience, and access to our (mostly) bi-monthly behind-the-scenes video series of “Shed Talkin’”.
Support DCRainMaker - Shop on Amazon
Otherwise, perhaps consider using the below link if shopping on Amazon. As an Amazon Associate, I earn from qualifying purchases. It doesn’t cost you anything extra, but your purchases help support this website a lot. It could simply be buying toilet paper, or this pizza oven we use and love.


Just a spelling mistake. It should be a ‘waiver’.
Doh, fixed!
Thanks for another great article!
Here is another one of interest:
Surprises in cycling aerodynamics
“CFD simulations validated by wind-tunnel measurements
show that drafting also benefits the leading rider,
due to the presence of trailing riders in his wake. The
drag reduction for the leading rider is up to 2.6% with
one trailing rider and up to 3.1% with two or more trailing
riders. The same effects imply that in a group of 6 or
more similarly-sized riders, the position with the largest
drag reduction is not the last, but the one-but-last. The
difference in drag reduction between both positions is
about 1%. In top competitions, where winning or losing
is often a matter of seconds, these drag reductions due
to trailing riders are significant and can be decisive.”
link to europhysicsnews.org
So in “human language”: is it more or less correct to say that the Quarq measures the power INput and the PowerTap the power OUTput? And you can find the difference “on” your chain?
I would say that’s a very accurate way of looking at it.
Very interesting, as always.
One question regarding the plot comparing Quarq vs Powertap power. I see in the legend that it is written Powertap x 1.10. Does it mean that Powertap measurements are around 10% lower than Quarq measurements in your case?. In other words, are you saying that drivetrain power losses are around 10% for your bike configuration?
Thanks.
CdA of 0.29x, that’s really bad even for a road bike position.
Sure, though remember – it’s not all about position. In fact, in talking with them, while we would make some gains in position in my case, much of the gains might actually come from really cleaning up much of the front end cabling. They think there’s a pretty big hit there based on what they’ve seen in other tests.
Perhaps some day I’ll go back and do a true fit/focus on me, rather than on the technology of their platform.
If Ray’s agenda for his visit was to improve his personal performance on the bike and focus on lowering his CdA, he would have spent a lot more time with Jim working on his position. As he notes in the article, he really only spent the bare minimum amount of time with Jim and the Retul bike to have some basic understanding of that aspect of the fit/aero process.
Also, after looking at Ray’s bike, I was surprised to see that as much as he is a sports tech geek, he’s not much of a bike/aero geek. His frame is fine, but certainly not a superbike. Look at this wheels, bars, non-aero brakes, sensors attached everywhere for his testing – this is not a particularly aero setup. Actually, it’s pretty bad in that respect. No offense Ray!
Finally, Ray is a pretty big dude and this has a huge effect on CdA. In particular, he has pretty broad shoulders, whether from swimming or otherwise, and that is a kiler when it comes to drag. Take a look at the dude in the photos with the dual disc track bike – he is a local rider, very very strong, and basically is about as good as it gets in the TT position with a CdA <.20. He jokes that he was "blessed with narrow shoulders" and it's true – it really does help.
It would be cool to make little Aero BacPacs for GoPros. The extra space could even hold a bigger battery. Of course, you’d have to come back to the track and test the added weight. While I’m rambling, here’s another idea: a bike frame or handlebar with integrated water storage. A couple pipe fittings and a food-safe coating, right?
so should I change from the water bottle that came with the Profile setup to a regular bottle? (this is for the set up between my hands on the tri bike, right?)
I’m not sure I’d actually make that change – despite the aerodynamic benefits. The fundamental thing that traditional aerobottles bring is the reminder to drink – via the straw. It removes the barrier to taking a water bottle out and drinking.
For some, that barrier may not be an issue. For others (like myself), I procrastinate taking out the bottle. Not because of bike handling or whatever, but just because.
So while you remove the hit on aerodynamics, it catches up a few hours later in an Ironman.
Re: an $800 test for “free speed.”
The girl (mine, not yours) says: “A $1000 wheel and a $250 helmet are not ‘free speed.’ They are $1250 of speed. Leaning forward a bit while you run, that’s free speed. Because it’s, like, free.”
Point taken.
See, The Girl’s are always right…
If you want real free time, you should start with your transitions. No need for a fancy helmet/bike/aerobars/… real free! If I’m not mistaking, Ray had a blogentry about this some time ago. Should look for it in the archives.
Very cool. That would be a fun day- albeit not a cost effective one for me.
Downside: no aspect angle data. All at zero yaw to the wind.
Interesting: I would have thought that the boxy looking GoPro would have made more of a difference.
In terms of safety its best to use the aero-helmet as little as possible as they aren’t as good in a crash as a “normal” helmet. (link to bhsi.org)
Basketball, volleyball and weights in the middle in case you get bored?
Why don’t the head units inform you when the powermeter does a self calibration (i.e. to know when you coasted long enough if you have a powertap) Maybe just a simple flashing of the numberbeing shown if you’re looking at a power field.
Wonder how sensitive the ibike is to use that and another powermeter to measure aerodynamic drag.
The ANT+ Power profile has nothing in it to allow a sensor to inform the head unit it has done a self calibration so there is no way for the head unit to let the user know…
In this case, they have a known location for the calibration procedure to be done (coasting on the straights of the backside of the track), so they can track it occurring pretty easily (and do).
Fwiw, the next rev of the ANT+ power profile spec will include notification of the offset changing (it came out of a request I made in general that then O-Synce pushed forward to ANT+, who agreed to the change, SRM will be supporting it first).
One thing about position this test measures, but this does not go into it. Position changes drag but can also increase or decrease watts and endurance due to muscles used. I saw all these pros sitting way up on the seat to open their hip angle to get the right combo of glutes/quads/aero. I naturally tried to mimic it and failed, my watts dropped, but my aero position was good. So I raised my bars a bit and slid back — apparently my back has the flexibility for this. My aero gets a worse, my watts and speed increase because I have the right combo of glutes/quads.
@paulB: That’s a good point.
We do view the full process as supply and demand. Your biomechanics and physiology define the supply of power for each effort duration. And the bike and its dynamics determine the demand for the power, and how efficiently you convert power into speed.
Your optimal position will always be at a point where aerodynamic considerations slightly eat into your peak power position. It’s simply the compromise that’s required. But Jim Manton at ERO Sports is not about to let aero considerations completely degrade your power performance, don’t worry.
“In order to start things off, they’ll precisely measure out your wheel circumference, which is used by the ANT+ sensor and corresponding computers to measure speed. It’s critical this is absolutely perfect – hence why they measure it out with a tape measure.”
Ray if they really wanted a precise circumference they should have measured it with you on the bike. It gives at least one percent difference between being on the saddle or just walking next to the bike. This time I’m more than confident I measured the tires of my bikes including trekking one with several methods. You know also with family members, with one pushing the bikes very slowly and with another one supporting me to avoid my fall sideways. 🙂
If u ride naked it will cut back on time too lol
Not true. In talking with Jim, his quote was “skin is slow.” This is what you see so many skinsuits these days in LS, even in relatively warm weather. There was also some talk about measuring the effect of shaving legs and arms. Just have to find a willing and able subject and the track time to test this.
Couple of things:
Powermeters: We do now supply the power meter, and I think it was Ray’s testing that really confirmed the need to do so. They’re Powertaps built on Zipp rims and we have cassette bodies (and cassettes) to deal with just about any setup (650’s too). The wheels are built and routinely calibrated by Rich Sawiris at Wheelbuilder; couldn’t have a more knowledgeable guy do either for us!
Roll-Out: Tisztul_A_Visztula you’re correct, and we now conduct roll-outs with the rider on the bike.
Jim, I am more than happy that you clearly agreed with me, it is so rare in the world of web.
I have another comment and this time I am the one who agree with Robert and indirectly with you: “skin is slow”. Unfortunately I do not have any professional direct experience as regards CdA, but I have read a book of outstanding quality: The Bicycling Science.
Now I can’t cite the relevant sentences from the book word by word, but the authors also made it clear that smooth surfaces are not optimal due to the characteristics of eddies created by smooth surfaced and different shaped objects. As I remember they highlighted the example of golf balls, they have dimpled surface, because it makes them faster versus classical spheres.
Note: I am not a golf player at all, but I assume dimpled balls are not just about maximizing flying distances, but also about increasing the predictability of the ball’s trajectory and the concave “wounds” on the surface may have slow the ball while it is rolling on the grass.
Almost forgot. We, too, were surprised by the GoPro results; more testing will be forthcoming!
Tisztul_A_Visztula
Re: Skin is Slow. Again, you’re correct, there are certain fabrics which have texture and, therefore, “trip” the boundary layer. The boundary layer is the layer of air disturbed as an object passes through – the closer to the object, the more disturbance. Without getting too technical, the texture is basically “roughing up” the airflow just a little to delay the negative pressure zone behind the object moving through the wind.
This works to a certain point, but unless I’m mistaken, once you hit a certain speed, smooth is better. Andy could probably speak to this better than I. He teaches me most of this stuff anyway!
Ray, will all those tests lead to any actual differences in your position on the bike or setup when you race now?
In this case, we weren’t really focusing on me as an athlete/setup, and more about showing how the tech worked. Had I been there to make me faster, would have spent a fair bit more time. Also would have decided what type of race we were aiming for (i.e. shorter or longer).